

In This Article

The collapse you don’t see coming
In February 2021, Winter Storm Uri rolled into Texas. Temperatures plunged, demand spiked, and the “fortified” power grid — the one officials swore was reliable — collapsed almost instantly. Millions were left without heat, water, or electricity. People weren’t caught off guard because there hadn’t been warnings — they were caught because they trusted a system that was never built to withstand real stress.
That’s how cracks work. They don’t always scream until they snap.
And we’ve been talking about cracks for years. In 2Q 2017, we warned about “cracks in the dam” — the kind you don’t notice until the water rushes through. By 2Q 2024, we shifted to “surface pressure” — pointing to the weight building quietly across the system. And just last quarter, we noted “cracks in the foundation” of housing.
Today, those metaphors aren’t theory anymore — they’re showing up in the data. Nearly 2 million jobs revised away, inflation reaccelerating, housing rolling over, and the Fed surveys bleeding red. The pressure has moved from cracks to buckling scaffolding.
For years, we’ve been pointing to cracks in the labor market data — cracks everyone from the Fed to Wall Street to financial media assured you didn’t exist. We flagged the Birth/Death model for what it was: statistical garbage used to inflate job growth where none existed. In May 2024, we wrote:
“Infamously, the Birth/Death model ‘decided’ to add 363k jobs, while the household survey showed a de minimis +25k. Garbage in, garbage out.”
In Q4 2024, we added:
“…private sector actually saw a decline of –163k jobs, while the Birth/Death model yielded a +951k increase.”
Most recently in August, we reiterated a quote from Simplify Asset Management’s Chief Strategist, Mike Green … something that we highlighted back in August of 2023:
“My critiques of the Birth/Death model… it does a terrible job at economic turning points due to its trailing trend ARIMA approach. This maximizes job estimates when the economy is entering a recession… Post pandemic estimates of new business jobs are highest in history.”
We didn’t make this up. We didn’t need to — the math was right there. But while Powell and the press were cheering “record jobs,” we were telling you the foundation was cracked.
Fast forward to today, and those cracks are no longer hypothetical. In just the past two months, revisions wiped out nearly 2 million jobs, including a benchmark revision of -911k for the 12 months ending March 2025 and a total of 1.73 million phantom jobs erased over two years. And here’s the kicker: on September 9th, the BLS released yet another benchmark revision, and it was massive! (MORE ON THIS BELOW)
Powell already used last year’s revision as cover foe his pre-election cuts — and with his job on the line, does anyone doubt he’ll try it again?
That’s not a rounding error — that’s the statistical scaffolding collapsing under its own weight.
Like Uri showed Texans, the cracks were always there. Everyone just pretended not to see them.
From here, let’s walk through the latest data — inflation, jobs, housing, and the Fed’s ongoing circus — to show how those cracks are widening today … we’ll start with:
CPI/Inflation: garbage in, garbage out, part II
The latest CPI data for August which showed up on September 11th delivered what we’ve been warning about all year: inflation isn’t dead, it’s reaccelerating. Not because of tariffs, not because of some new “mystery factor,” but because the rate of change and base effects said it would.
- Headline CPI: +0.38% MoM, accelerating to +2.92% YoY (vs. +2.70% prior). Energy rose +0.69% MoM, +0.22% YoY. Food prices +0.48% MoM, +3.19% YoY.
- Core CPI: +0.35% MoM, accelerating to +3.11% YoY (vs. +3.06% prior). That’s the highest reading since February.
- Shelter: +0.44% MoM, slowing just a touch to +3.63% YoY (vs. 3.67%). Rent of primary residence +3.50% YoY (vs. 3.55%), Owners’ Equivalent Rent +3.97% YoY (vs. 4.06%). Lodging away from home +2.29% MoM, but still down -2.56% YoY.
- Other components:
- Used Autos: +1.04% MoM, accelerating to +6.04% YoY (vs. +4.79%).
- New Autos: +0.28% MoM, +0.66% YoY (vs. +0.41%).
- Apparel: +0.50% MoM, rebounding to +0.23% YoY (vs. -0.21%).
- Medical Care: -0.16% MoM, slowing to +3.45% YoY (vs. 3.51%).
- Transportation Services: +1.01% MoM, slightly slower at +3.50% YoY (vs. 3.53%).
This isn’t disinflation — it’s broadening acceleration. Energy, autos, services, education, shelter … inflation is showing up everywhere Powell insisted it wouldn’t … this is also consistent with @Hedgeye risk management’s Quad 3 “stagflation” call (inflation up/growth down), leading us into an upcoming Quad 2, then Quad 1 count for the upcoming quarters.
Though, given the most recent data … what’s the Fed’s line? Powell said last week: the “pass-through” of tariffs into prices has been “slower and smaller than we thought,” but still blamed tariffs for the stickiness. At the same time, he admitted the Fed anticipates inflation will continue to rise, though “maybe not as high” as expected.
So, let’s recap. Powell cut rates when CPI was nearly 80bps higher than it is today, but now with inflation lower, he’s stalling cuts — while blaming tariffs that he just admitted aren’t really driving the numbers. That’s not policy, that’s improv comedy … something we pointed this out months ago.
Meanwhile, the data is doing exactly what we told you it would — broadening and reaccelerating.
Jobs/Labor market: a tale of two realities
If CPI is where the Fed hides behind lagging inputs, the jobs report is where they outright manufacture stability.
We’ve been pounding the table for years that the BLS Birth/Death model is nothing more than a rounding error on steroids. It invents jobs when the cycle is rolling over, justifying a “healthy” labor market that doesn’t exist outside of an Excel spreadsheet. Back in May 2024 we wrote:
“Infamously, the Birth/Death model ‘decided’ to add 363k jobs, while the household survey showed a de minimis +25k. Garbage in, garbage out.”
And in Q4 2024 we added:
“…private sector actually saw a decline of –163k jobs, while the Birth/Death model yielded a +951k increase.”
Fast forward to August, and the household survey shows exactly what we warned about:
- Payroll jobs (Non-Farm): Flat in July after +73k in June — the weakest stretch since 2020.
- Private sector jobs: Just +83k MoM, anemic for this stage of the cycle.
- Full-time jobs: Collapsed by -440k MoM.
- Multiple jobholders: Down -523k MoM. This isn’t workers voluntarily stepping back — it’s lost hours and lost wages.
- Part-time jobs: Rose +219k MoM. The economy isn’t creating quality jobs; it’s creating survival gigs.
- Unemployment rate: Pushed higher again, from 4.1% to 4.25%.
- Continuing claims: Now at 1.974M, up +16k WoW, and the highest level since 2021.
And while Powell still insists the labor market is “balanced,” the composition tells a very different story. A large portion of so-called “job creation” in recent years came from illegal immigrant hires, padding the headline while hollowing out wage growth. Now, as that labor force exits, Americans are filling some of those roles — but at weaker pay, fewer hours, and reduced security. The churn makes the surface look stable, but the quality of employment is deteriorating.
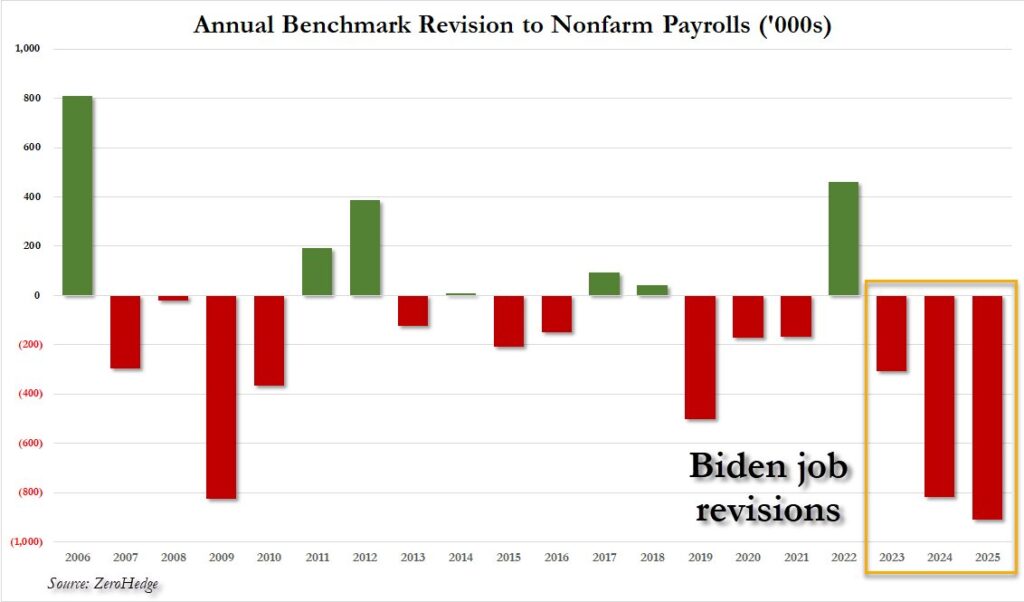
For a moment we’d ask you take your political blinders off and visualize the YoY Biden era revisions as detailed/illustrated by ZeroHedge noted on September 9th, while also considering this stated fact … as backed by data:
“There was virtually no job creation in the last year of the Biden Admin.”
This is Powell’s definition of “solid.” A labor market where full-time work is shrinking, part-time is rising, unemployment is grinding higher, and more people are losing their second and third jobs. If this is solid, then ice cream soup must be gourmet cuisine.
Housing: from surface pressure to buckling foundations
If jobs are the canary, housing is the mine shaft — and it’s filling with gas.
Back in 2Q 2024, we called it “surface pressure” — the quiet stress of affordability and rate shocks pressing down on buyers. Q2 2025, our discussion of “cracks in the foundation” … warning that prices and demand couldn’t hold.
Now, with the latest data, those cracks are widening:
- New home sales: Down -8% YoY.
- Median new home prices: Down -5.9% YoY.
- Average new home prices: Down -5% YoY. That’s two straight months of outright price declines.
- Pending home sales: Fell for the third time in four months.
- Existing home sales: Still stuck at post-2011 recovery levels.
- Mortgage applications (late August): Fell -0.5% WoW; slowed to +21.6% YoY (vs. +22.7% prior). Refinances -3.5% WoW, slowing to +18.6% YoY. Purchase index +2.2% WoW, +24.3% YoY. Average 30-yr fixed rate at 6.69%.
- Mortgage applications (early September): Surged +29.7% WoW, +44.7% YoY as rates fell to 6.39% — the lowest since October 2024. Refinances spiked +57.7% WoW. Buyers are chasing rate drops, not fundamentals.
And yet, even with rates easing, builders are still struggling. The NAHB Housing Market Index is stuck at 32, its 17th straight month below the “healthy” 50 mark. 39% of builders cut prices, and 65% offered incentives to move inventory.
Here’s the kicker: inventory is rising. Which means the old narrative — that sales were only weak because “there weren’t enough homes to buy” — is dead. Even Lawrence Yun, the National Association of Realtors’ eternal optimist, admitted last month:
“Even as more inventory helps to fulfill housing demand, home sales are not increasing.”
Translation: buyers aren’t staying on the sidelines because there’s nothing to buy. They’re staying on the sidelines because affordability is shot, incomes are under pressure, and confidence is waning.
The story isn’t resilience. It’s demand collapsing under the weight of weak jobs, high prices, and tightening credit.
Of course, CNBC and the Fed still call this “balanced.” Balanced compared to what — the GFC?
The Fed: when balance means anything you want it to
Powell wants you to believe the economy is “balanced.” Balanced inflation. Balanced labor. Balanced risks. Balanced, apparently, like a Jenga tower with half the blocks missing.
At Jackson Hole, Powell admitted tariff pass-through has been “slower and smaller than we thought” — Fed-speak for “we got it wrong again” — but still pointed to tariffs as the villain behind rising inflation.
Meanwhile, the Fed’s own surveys keep flashing weakness:
- Richmond Fed (Aug): Improved +13 points but still -7, its sixth straight negative print. Employment came in at -11, new orders -6, and backlogs -12.
- Dallas Fed (Aug): Back in contraction.
- Chicago Fed Activity Index (Aug): Still negative.
- ISM Services (Aug): Rose +1.9 points to 52.0 (a six-month high). But employment stayed stuck at 46.5, deep in contraction. New orders ticked up to 56, while prices paid eased slightly but remain elevated at 69.2.
This is the Fed’s vaunted “balance.” A labor market losing full-time jobs, housing sliding, regional surveys flashing recession, and inflation broadening higher — but sure, let’s call that balanced.
It’d be funny if it weren’t trillions of dollars and people’s livelihoods on the line. With nearly 20,000 employees and more PhDs than some countries produce in a decade, the Fed still manages to forecast the economy with all the precision of a dart-throwing chimpanzee.
And yet, markets keep levitating. Why? Because fundamentals don’t matter when passive flows are in the driver’s seat. At the same time, with inflation rising … the slightest bit of GDP growth places us squarely in a Hedgeye Quad 2 (reflation) economic investing regime which throws kerosine onto already inflated asset prices.
Remember … while markets are passive driven, the Rate of Change in the data matters… less bad equals incremental improvement!
Final thoughts: until the Other Side hits
Winter Storm Uri exposed just how fragile the Texas grid really was. One unexpected shock, and the whole system buckled — millions of people left freezing in the dark. On paper, it looked fine. In reality, it was rotting underneath.
That’s been our message for years. In 2017, we warned about cracks in the dam — risks building beneath the surface … January 26, 2020, we warned readers about, “The importance of History, and boy, it is rhyming today” … a mere three weeks before a massive collapse (with Covid being the accelerant, not the match).
In 2024, we called it surface pressure — the weight pushing down but not yet breaking through. And just recently in August of 2025, we pointed to cracks in the foundation — visible damage in housing, jobs, and inflation.
Now, with nearly 2 million jobs revised away, CPI reaccelerating, housing rolling over, and Fed surveys flashing red, it’s clear: the scaffolding is buckling.
All this being said, we’re not calling for a crash … to the contrary, we believe we’re in the process of a melt up!
But how could markets continue marching higher?
Because fundamentals matters much less when passive investing keeps pouring flows into indexes regardless of what the economy looks like underneath. Passive doesn’t care if housing affordability is toast, or if regional Fed surveys are bleeding red … it just buys … and with every passing day, the more shares are retired … taken out of circulation reducing public floats, the larger the impact each incremental dollar has in inflating asset prices (inelastic markets = extremely volatile price swings).
One thing that passive bids do care about is full-time jobs! Why?!
What happens when that bid dries up? When high-income earners losing their jobs means fewer 401(k) contributions, fewer passive inflows, and suddenly the tide goes out? That’s when markets stop ignoring fundamentals. And when that turn comes, it comes fast. In this respect, our ears are perked … markets do have our undivided attention.
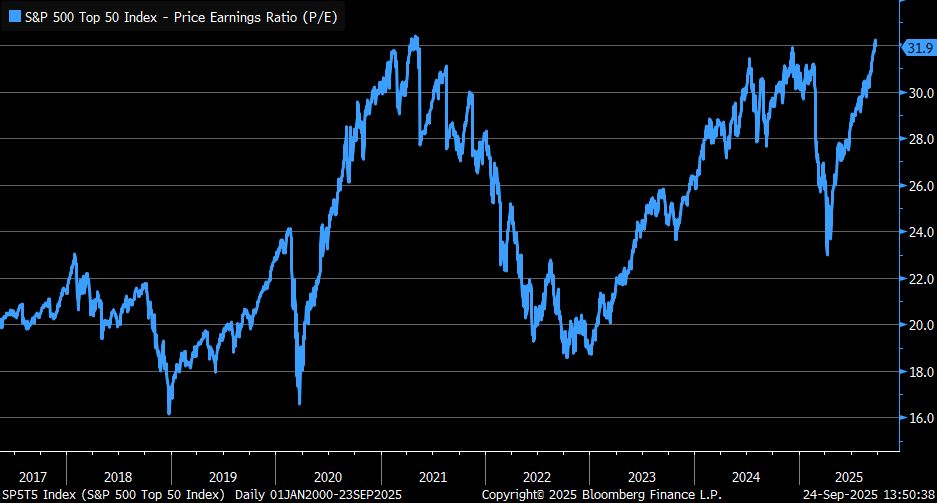
Per Chief Investment Strategist at Charles Schwab, Liz Ann Saunders, the P/E ratio for the 50 largest names in the S&P 500 just hit 31.9 … any Wall Street analyst who suggests a 31.9 Price to Earnings ratio to be a sign of strength should be forced into retirement … they’re dinosaurs … EXTINCT.
While market breadth is expanding (modestly) … the SPX / equal weight correlations are … how shall we put it?! EXTREME!
As noted last week by Simplify’s Mike Green on X.
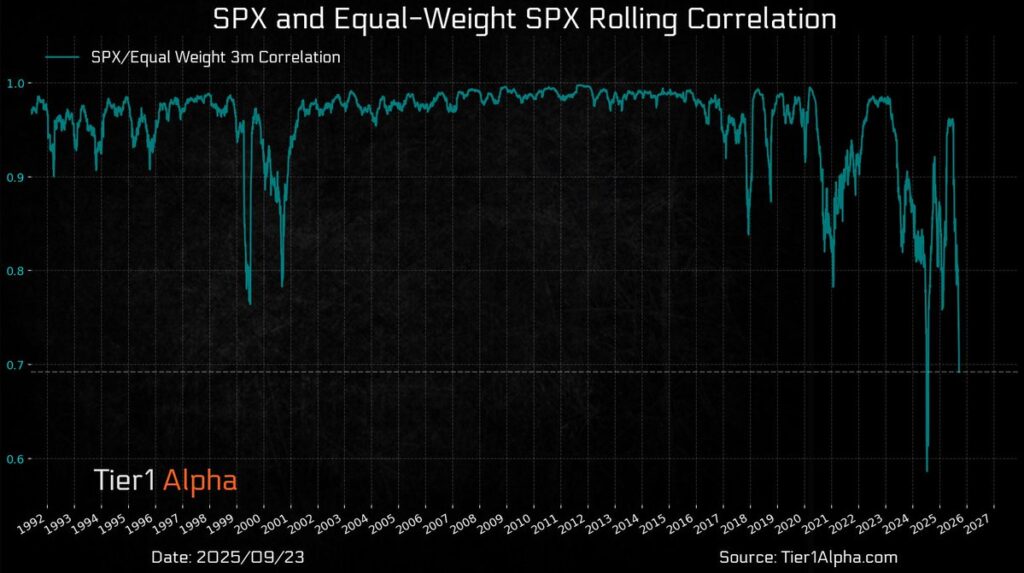
This above graphic illustrates clearly as to why our primary flagship model has been lagging a bit on the year. While we’ve made some adjustments to account for this, at the same time, as Mike Green also sarcastically said:
“It’s different this time…”
We don’t know the exact day, week, or month reality arrives. No one does. But we do know this: the wave higher is fueled by passive momentum, not sustainable strength.
And when the Other Side hits, you’ll want more than hope. You’ll want a plan.
Do you have a risk management strategy that lets you ride the insanity higher today while protecting against the collapse tomorrow? If not, that’s why we build comprehensive plans at no cost for anyone who walks through our process whether you utilize our services or not — because waiting for the cracks to widen isn’t a strategy. It’s denial.
Schedule your free consultation. Let’s make sure you’re prepared before the next Uri moment arrives.
As always … Good investing!!

Mitchel C. Krause
Managing Principal & CCO

4141 Banks Stone Dr.
Raleigh, NC. 27603
phone: 919-249-9650
toll free: 844-300-7344
mitchel.krause@othersideam.com
Please click here for all disclosures.

