
In This Article

Year in Review
On November 26th, 2018, as reported by MarketWatch, over 90% of the 70 asset classes tracked by Deutsche bank (and cited in the WSJ) were on track to be negative for 2018. That was before December, which then became the worst performing month since the Great Depression.
Below find a Recap of major indices and sectors for the month of December as well as OSAM’s inception date to year-end for our MSDD model vs. major indices.
| December Recap (close as of 12/31/2018) | Index | 2018 recap as of 2/12/2018 (close as of 12/24/2018) | 2018 recap as of 2/12/2018 (as of close 12/31/2018) |
| DJIA: -8.65% | DJIA | -12.35% | -6.03% |
| Russell 2000: -12.04% | Russell 2000 | -14.30% | -8.70% |
| Nasdaq: -9.48% | Nasdaq | -11.70% | -5.40% |
| 30-Year Yields: -8.40% | S&P 500 | -10.20% | -4.20% |
| 10-Year Yields: -10.00% | MSDD | -12.50% | -10.30% |
| U.S. Dollar Index: -1.12% | |||
| Crude Oil: -11.12% | |||
| Copper: -5.60% | |||
| Gold: +4.50% | |||
| Silver: +9.08% | |||
| Sector | Symbol | % down from high as of 12/24/18 | % down from high as of 12/31/18 |
| Communication Services | XLC | -24.33% | -19.84% |
| Consumer Discretionary | XLY | -21.37% | -15.36% |
| Consumer Staples | XLP | -14.52% | -10.93% |
| Energy | XLE | -30.19% | -25.64% |
| Financials | XLF | -24.68% | -19.58% |
| Health Care | XLV | -15.44% | -9.36% |
| Industrials | XLI | -24.11% | -18.99% |
| Information Technology | XLK | -23.78% | -18.02% |
| Materials | XLB | -24.67% | -19.61% |
| Real Estate | XLRE | -12.53% | -9.04% |
| Utilities | XLU | -8.66% | -6.25% |
Long only models struggled to find footing, even in the most solid names. Value investing hedge fund “all-star” David Einhorn had his worst year ever, losing 34% in 2018.
The year also saw the correlation between the “risk on” S&P 500 vs. the safe haven of the “risk off” treasury bond market diverge as both equity and bond markets lost significant value.
As you can see from above many sectors, which comprise the S&P, were down nearly 20% from their highs on a YTD basis. Additionally, you may have noticed, I’ve included 2 sets of numbers, those as of 12/24/2018 as well as 12/31/2018.
Looking at the 12/24/2018 closing numbers, 7 of 11 sectors in the S&P were down 20-30% off their highs throughout the year.
Outside of Gold, Utilities, cash, or being short, there were very few places to hide in traditional financial markets…
So did anything go right? I think so, but you be the judge…
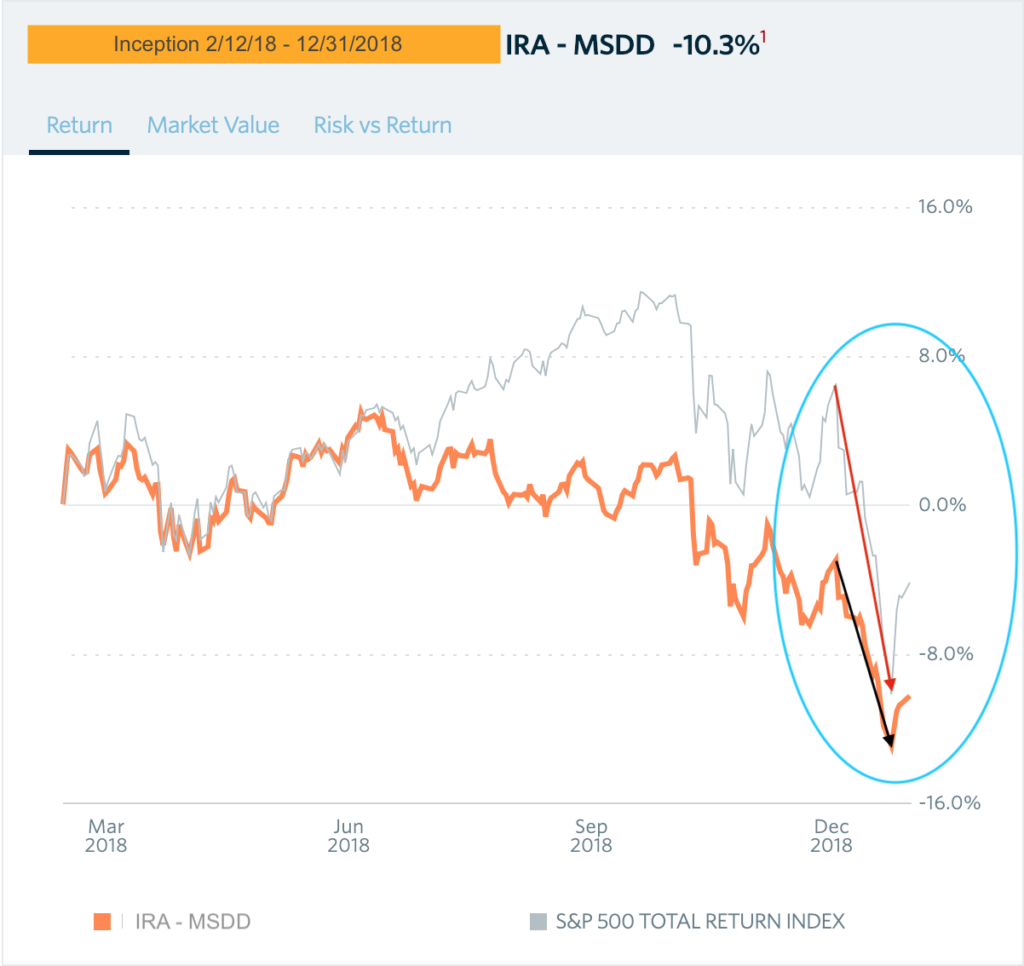
You can see where our portfolio became more defensive earlier in the year. As market losses accelerated into December triggering more of our capital preservation strategies, the cash position strengthened; our precious metal portfolio turned positive resulting in the markets falling nearly twice that of our portfolio over the same time frame; from 12/8 – 12/24, the S&P 500 fell -16.5% while we fell -9.5%.
It is true we have not “bounced” as much as indices since the Dec. 24th low, though as you’ll read below; I don’t think we’re out of the woods just yet… We’ll pick our spots, invest in quality companies and capture our fair share of upside, just as we have in previous years, doing so with less risk than markets.
As of this release, we sit at a crossroads and still can’t be sure the worst is behind us…
Extreme volatility and erratic behavior in price action over the course of the 4th quarter has invoked emotions I have not seen since the “Great Recession” of 2007-2009. Christmas week alone brought us a negative 650-points on the DJIA (Monday), followed by a 1,000-point gain (Wednesday) with Thursday bringing us an 800-point “swing-day” as the DJIA trades down as much as 556 points by mid-day only to close up 260…
In an environment like this, I would rather miss a little to the upside then a lot to the downside. We have never said you can’t lose money in this model. We have always said this model is not designed to capture the tops or highs. We always allow ourselves room to let winners run, though, we look to cut losers before they become problematic. Had the past 3 weeks mirrored that of December, we’d be sitting in exponentially more cash and gold but able to sleep, while the rest of the world would likely be sleepless. That time will come, I don’t know exactly when, but when it does we’ll be prepared. In the interim, we will manage our risk and be opportunistic when we feel it’s the right time and opportunity.
As much as we don’t like being down, this isn’t anything we haven’t prepared all investors for. We will continue to be extremely vigilant and mindful of your capital. As you’ll see below, we’ve put a very well detailed and researched report together in an attempt help you see what we’re seeing and why prudence remains key even with what appears to be a relatively clear view of the road and what lies ahead…
“2018 will more than likely bring us “fireworks” – increased volatility – higher highs with an “outside” chance of lower lows.” OSAM 2017Q4 note
“higher borrowing rates will more than likely be the spark that sets this house of match sticks ablaze.”OSAM 2017Q4 note
The Fed: 650… 535(+400)…250(+?)…
Unless you’ve been living under a rock, most investors know that the FOMC (Federal Reserve Open Market Committee) increased the benchmark Fed funds rate four times in 2018, the final .25bp (basis points) coming on December 19th, pushing the Federal Funds rate to 2.5% with forward looking guidance about as clear as mud; quite possibly pointing to an additional 2-3 hikes in 2019, maybe, but maybe not?!
If you’ve read anything that we’ve written over the past 2 years, you’re likely aware that we don’t believe the economy has the ability to handle higher rates for multiple reasons, in this note, we break down WHY in its most simplistic form.
As critical as we have been of the Federal Reserve, we don’t believe current Fed officials are completely oblivious to this either; however, their predecessors have painted them into a corner… To understand where we are today, you must have a brief understanding of what got us here.
650…
The Federal Funds rate is the interest rate at which depository institutions (banks) lend reserve balances to other banks on an overnight basis. Controlling this interest rate allows the Fed to increase or decrease liquidity in the financial system. Lower rates tend to prompt more borrowing, while higher rates pull liquidity out of the system (less borrowing). Lower rates are akin to stepping on the gas pedal in your car, more gas equals more speed; while higher rates would equate to you lightening up on that gas pedal, slowing your car (the economy) down. Unfortunately, the Fed’s track record resembles that, which looks a little more like taking your foot off the gas while cruising along at 75-mph and slamming both feet on the brake… (Head snaps, smoking, screeching tires, uncontrollable steering wheel, etc.)
In December of 2000 the Federal funds rate sat at 6.50%, meaning the FOMC had 650-basis points of “stimulus” (or gas) at their disposal to fuel a sputtering economy in the event of a slow down, recession or crises. As described above, interest rate policy, is the Fed’s primary tool used to ward off danger by lowering rates, which should encourage more borrowing, and in turn, more investment and spending. When the “Technology bubble” burst in 2001, the FOMC lowered this benchmark-lending rate to 1.00% (100-basis points), a 5.5% or (550-bp) reduction, this done within a relatively short few years.
525(+400)…
The stimuli provided by the Fed in the early 2000’s was enough to stabilize the economy (markets), prompting the Fed to begin the “tightening” process in mid-2004 (the process of taking their foot off the gas). By mid-2006 the benchmark Fed Funds rate sat at 5.25% (525-basis points). Just in time for cracks in the housing markets to appear (to a select few in 2005/2006). Come mid-2007, the Fed Funds rate remained at 5.25%; however, these minor cracks in the “proverbial dam” began to explode at the seams.
In the midst of arguably the worst financial crises in modern history, the FOMC, once again, attempted to stimulate the economy by means of Interest Rate Policy, once again cutting the bench mark Fed Funds rate from 5.25% to 0.00%, in an effort to support what appeared to be a virtual collapse of the financial system.
By 2008, the carnage in the mortgage/CDO (Collateralized Debt Obligation) market was visible to all and had reached its peak. With the bankruptcy of Lehman brothers, disappearance of Bear Sterns and countless more; Counter-party risk (the risk of the firm you are doing business with today, being gone or unable to satisfy their previous day’s obligation tomorrow) became very real.
In a scenario unlike any seen in modern history, the 525-basis points the FOMC had at its disposal in an effort to stimulate and calm financial markets simply wasn’t enough. So what do you do when your traditional short-term rate mechanism is no longer available? The Federal Reserve instituted what became known as their Quantitative Easing program (dubbed QE by the media).
As we wrote in our 2nd quarter note, from the mouth of former Fed Chair, Ben Bernanke June 2018 in an interview with Desmond Lachman of the AEI (American Enterprise Institute),
“We (the FOMC) didn’t know where the bottom was going to be and we were seriously concerned we were facing a new depression type situation – The staff was telling us that we needed 400 basis points more of stimulus, we had zero to give… because interest rates had been at zero since the previous November. So we needed to do something, and all members of the FOMC from the most dovish to the most hawkish were very strongly agreed with this (QE) was the best option we had.”
The Fed, having already embarked on one unknown, ZIRP (Zero Interest Rate Policy), now attempted to provide MORE GAS to the economy with yet another unkonwn; Quantitative easing (QE) was born, a program designed to inject liquidity into the financial system via buying government bonds or other securities; this policy remained in place for over 6-years and while the Federal Reserve enacted this policy here in the U.S., Central banks around the globe followed in suit. The ECB went as far as buying the debt of sub-prime (junk) borrowers. This created an artificially low, even negative interest rate environment in many parts of the world for an unprecedented time frame. (still today)
250(+?)…
So where does that leave us today? On a macro level, it leaves us largely where we thought we’d be, give or take some “timing” discrepancies.
With inflation nearing the Fed’s arbitrary target of 2%, the Fed fund’s rate having raised rates from 0% to now at 2.5%, both debt and equity markets began screaming “NO MAS” in the month of December.
- It left us with the worst December for markets since the Great Depression
- It left us with not a single high yield bond being priced during the month of December
- It left us with the CLO (Collateralized Loan Obligation) market freezing up
- It left us with financial institutions walking away from billion dollar agreements in principal (Acsent Capital (Monotonics) 8-k).
- It still leaves us with record amounts of Student and Consumer debt.
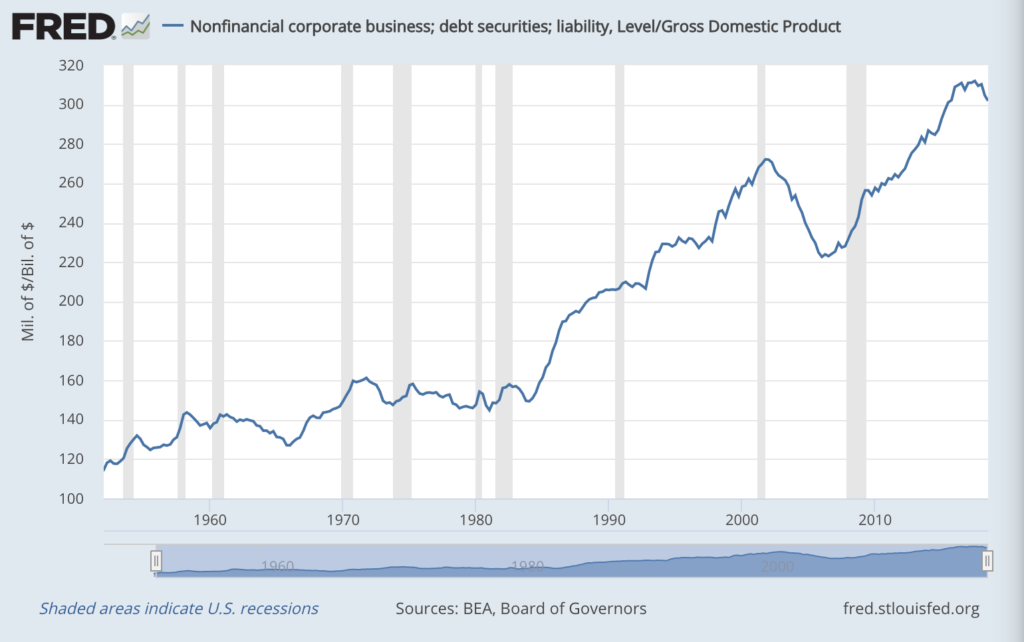
- It still leaves us with the largest amount of corporate debt to GDP on record:
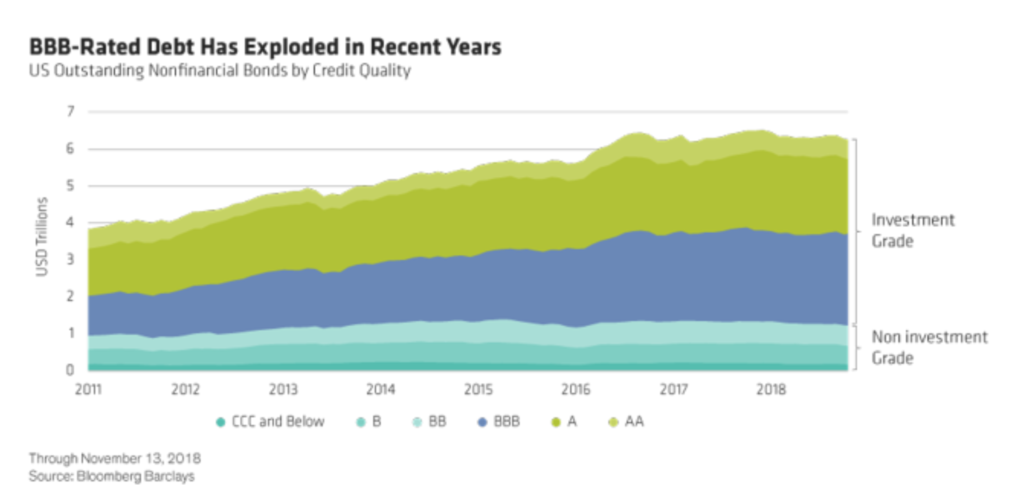
- It still leaves us with the largest amount of Bank Investment Grade corporate debt a single downgrade away from becoming junk as credit quality has severely deteriorated; from Seeking Alpha:
The below image allow you to visualize how the FOMC’s actions over the last 20 years has impacted and correlated with equity markets.
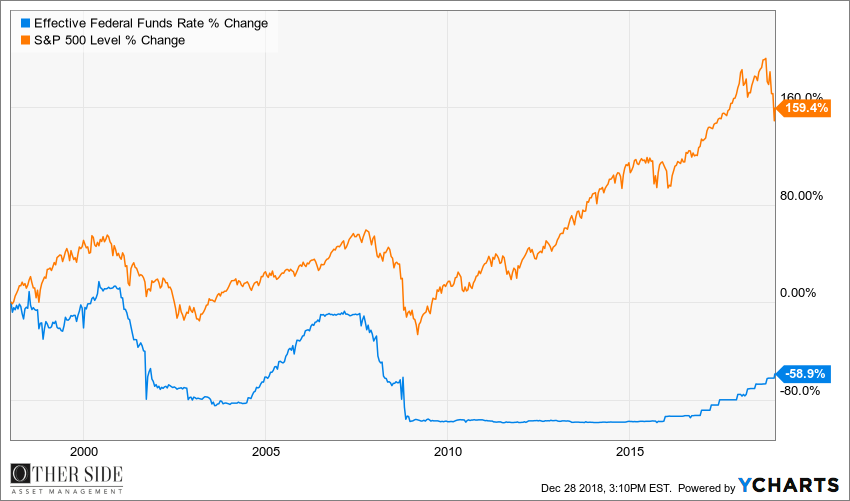
With the current Fed Funds rate now sitting at 2.5% (250-basis points), a far cry from the 6.5% Fed Funds rate of 2000 or the 5.25% the FOMC had to work with in 2008, the FOMC has far fewer tools at their disposal to counter a recession then at any point in the last 50-plus years.
Our second quarter note was highly critical of Ben Bernanke’s discussion with Mr. Lachman of AEI for this very reason. Bernanke’s tone towards those who anticipated “costs” of the Fed’s actions was smug at best.
”while we certainly have not existed yet, the exit process has begun, asset purchases ended in October of 2014; now we’re at a process of where the balance sheet is actually beginning to run off and of course, it hasn’t finished, but that also has not shown itself to be a big problem so far”
We beg the question, what happens when “not shown itself to be a big problem so far” becomes “is now showing itself to be an enormous problem”?
No less than 6-months after Bernanke spoke those words “markets” are exposing the Fed’s previous actions to be a significant problem, below we’ll explain why.
We continue to acknowledge the importance of debt and its integral role in fostering an economy’s growth, though, we have stressed the importance of how that debt is used, as well as the length of time this debt has been available to access. Our opinion is the time variable will ultimately prove to magnify future negative outcomes. Below we explain with a simple analogy easy for anyone with a credit card to understand, but first…
Understanding the game…
In June of 1981 the Federal Funds rate peaked at 19.10%, in September of the same year the 30-year treasury rate peaked at 15.14% and ever since, Wall Street has been riding the re-finance wave all the way to shore. That’s nearly 40-years. There have been ups and downs in equity markets, but every recession or hiccup has been met with a Fed “response”, easing their precious fed funds rate.
The list of adjectives I could use to describe high-level Wall Street executives is long, but the word “stupid” wouldn’t be one of them. The majority are extremely intelligent, shrewd businessmen; very in tune with their bottom line… This note could turn into a book discussing my years on the institutional side (but that’s not the point of this section) However, what is tremendously important for you to have an understanding of is why 40-years of steadily decreasing interest rates have made Wall Street firms copious amounts of money, but more so, why the last 8 years has basically placed a printing press inside their walls. Let me attempt to summarize…
The best way to understand the first aspect can be simply likened to constantly refinancing your home in a decreasing interest rate environment. As mortgage rates decrease, you go back to your bank for a cheaper rate. Everyone wins right? You leave agreeing to another 30 years of lower payments and sign a few documents, the financial institution wins as you just agreed to pay them for an extended period of time, but since you never cut a check out of your pocket it was painless, right –a win, win! SMH! In a decreasing interest rate environment, sometimes, you can “buy more house”, borrow more but maintain the same monthly payment (more on this later).
Investment banks do the same thing with their clients on a much larger scale. For example, Investment Banks will raise hundreds of millions to billions of dollars for a client via a bond offering. The client can use this money per the prospectus to run or grow their business. Prior to that bond maturing (or if interest rates are significantly lower), the investment bank will raise more capital to refund a maturing bond or replace the current bond at a new, lower yield (providing the company with a lower interest rate and, in turn, lower cost to carry). This system has been in place for well more than 40 years but your not going to refinance your mortgage at a higher rate unless you have an adjustable rate mortgage and you think rates are going exponentially higher. Lower interest rates equals refinancing BOOM.
ZIRP has afforded businesses to raise record amounts of debt (due to their ability to afford it – due to this lower cost of carry); which has made these investment banks record profits based upon to the absurdly high fees charged on capital raised.
What do you think the companies have done with this newly raised capital? While this ties into responsible use of capital, I’ll attempt to be brief. Many of you have heard me use some of these phrases, “bought back copious amounts of stock at ridiculously high valuations”, who do you think gets paid to execute these trades? Many of you have heard me say “overpay for an acquisition”, who do you think gets paid to “advise” these companies on their acquisitions? Many of you have heard me say “refinance debt”, who do you think gets paid to raise this new capital?
Raise capital (get paid), immediately spend capital on buybacks and acquisitions (get paid), need more capital (get paid) rinse, repeat. Who do you think gets their cut every step along the way? The more capital raised, the larger the acquisition, the more shares bought back the larger the revenue stream is for the Investment bank (the so called advisor). Now what do you think happens to the revenue stream of those investment banks when interest rates go higher, debt has multiplied, companies haven’t reserved for the new higher cost to carry and capital isn’t so easy to come by? You guessed it, the hamster wheel stops turning…
Under normal circumstances, raising the benchmark lending rate 250 (to 300) basis points shouldn’t be that big of a deal, after all, from 2004-2006 rates were increased from 1% to 5.25% without issue (though, if you believe it came without issue I have a bridge to sell you), it’s important to note rates were artificially suppressed for a mere few years (2002-2004) raised from 2004-2006; even still was it coincidence the 2007-2009 crash followed so quickly?
Now, if I could paint you a mental picture, 8-years of Zero Interest Rate Policy (ZIRP) has allowed just about everyone on the planet to max out their credit cards, continually consolidating their debt to that new card with a zero interest teaser rate; and with every consecutive rollover, they have borrowed exponentially more and more.
Assume for a moment you have credit cards with an outstanding balance totaling $20,000 of debt at a 5% interest rate; your “interest expense” or “cost to carry” this debt is $1,000; simple enough example to understand, right? Now stay with me…
Let’s assume over time interest rates drop to 4%, and while some would think responsibly and pay down principal the MAJORITY of people, unfortunately think differently. They immediately believe they can now afford to borrow more; in this instance, another $5k while still maintaining the same cost to carry ($25,000 * .04 = $1,000). As rates drop further to 3% they can now borrow a little more ($33,333); at 2% even more ($50k) and finally, if rates were hypothetically dropped to oh, I don’t know, between 0.00% – 1.00%, in the mind of most, they have the ability to afford to borrow $100,000. After all, $100,000 (borrowed) * .01(1% interest rate) = $1,000 (cost to carry per year)
That’s right ladies and gentlemen, borrowing $100,000 at an interest rate of 1% has the exact same cost to carry as the original $20,000 of debt you had at 5%. (One-Thousand Dollars)
What has happened over an 8-year ZIRP economy is rather than continuing to pay the $1,000 per year you were accustomed to paying in an effort to pay down principal and retire the debt, over time, as interest rates dropped, the majority of this world has decided to borrow more and more and more – many, exponentially more (in some instances, 3-5-plus times more) than the amount of the original $20k of debt in this example. Borrowing 5 times more is $100,000.
The reason time (access to this debt for an abnormally long, prolonged period) is such an important factor is it has given everyone (every government, corporation, consumer, student, car buyer, etc.) with a pulse, the opportunity to lower his or her interest rate. After all, with interest rates this low you can afford “more house”, “more car”, “more expensive education”, “bigger boat”, “more cloths”, “name brands”, “flat screen”, “$1k iPhone”, “larger acquisition”, “larger corporate repurchase plan”, you get the point (I hope). If only a small percentage of “borrowers” were accustomed to low rates, their refinancing of debt at higher levels wouldn’t be such a big deal, the world could handle incremental increases, but when it’s the masses, it’s just like yelling fire in a movie theater.
In this example, had the additional $80k borrowed gone to a good use, such as organic expansion, buying shares back at a discounted valuation to book value or invested in equipment which generated efficiencies (i.e. invested in technologies that may streamline manufacturing, possibly hire revenue-producing personnel) while that money may have been spent, it was invested in opportunities which would have likely built value or increased cash flows to offset higher future income or interest expenses as rates began to rise.
However, if those borrowed funds went towards an $80k new truck to replace last years model, it merely leaves you saddled with $100k of debt and no added cash flows or efficiencies to show for it. The premise holds true for spending the $80k on a competitor that’s worth ¼ of the intrinsic value paid or buying shares back from a partner at 3-4 times their worth.
While artificially depressed interest rates on the $100k of debt has the same initial “cost” as the original $20k, WHEN interest rates are increased from 0% to 2.5% (or higher) your interest expense (cost to carry) now becomes 250%-plus GREATER…
If you want to ignore this concept as it relates to a government with nearly $22-TRILLION worth of debt when that number wasn’t quite $5-trillion in early 2000, because it can print a fiat paper currency, I guess we’ll agree to share differing opinions… But you can’t ignore it when it applies to a corporate entity, which can’t print its own money… So now apply the concept to a company with $190,000,000,000 (that’s billion) of debt on the books with a total of $250,000,000,000 billion including “off the books” likely under-funded pension liabilities? This of course being AT&T (T)
How many people do you think are looking at T’s current debt to equity ratio and will say, but it’s AT&T, they’ve been around forever and pay a 7% dividend yield! The problem most forget is all markets are priced off of FUTURE earnings. So for now, T is ok, until they are forced to refinance copious amounts of debt at a rate 250-300% greater than where their debt is currently priced (just imagine where their debt should be priced if true price discovery were allowed to take place without manipulation from the Fed). When investors demand more interest for the risk they are taking what do you think happens to companies who borrowed, overspent and over-levered in a raising rate environment? Sprint with roughly $38-billion of debt and no real earnings over the last 12-years? What about Frontier Communication or Ford? Or, or, or, the list goes on… See GE… See GM…
As credit markets tighten and easy money dries up, it will continue to create cash flow issues for companies who rely more heavily on the sub-prime borrower and those who sell bigger ticket items… (See GM laying off 14,000 employees and shutting down factories). GM (and the rest of the world) can attempt to place blame on tariffs all they want, the reality is this should have been expected as subprime credit began to tighten years ago.
As I wrote over 2 year ago – per my January of 2017 note:
Debt, in and of itself, doesn’t create an end of the world scenario… However, when those who have borrowed can no longer pay back what they’ve borrowed, and the underlying asset held as collateral has little to no value… “Houston, we have a problem”
We specifically called out GM’s CFO in our 2Q2017 note:
GM’s latest sales revisions take the company’s production levels back to those not seen since… 2015; yet, the company still remains positive…
GM had previously announced it expected 2017 new vehicle sales in the “mid-17 million” unit range. Stevens told analysts that sales could fall by 200,000 to 300,000 units this year but that the automaker had “somewhat insulated” itself from a downturn by reducing fleet sales, which lower vehicles’ residual values.
However, GM’s CFO, Chuck Stevens, admits the company has a supply of 110 days sitting on dealer lots right now compared with the historical averages of all major U.S Automakers of a typical 65 day supply dating back to 1960.
Making things worse, our above examples assume no adjustment to “credit risk” – it simply assumes these companies refinance debt with a marginal spread over treasuries as they now enjoy the luxury of being Investment Grade debt. Part 2 to our 1Q2018 note specifically spoke to how investment grade credits have been getting off easy with debt being priced assuming no chance of bankruptcy exists. However, should IG credits get downgraded to junk where spreads widen significantly, good night Irene!
October of 2018, 5 months after Goodyear tire (GT) announced plans to drop American Tire Distributer (ATD) as a supplier, ATD announced chapter 11 bankruptcy proceedings. Upon Goodyear’s announcement, ATD’s bonds lost nearly 60% of their value in a single day. After a relatively short reorganization ATD re-emerged having shed $1.1-billion in debt while adding an additional $250mm in funding… For those who aren’t following, “having shed $1.1-billion in debt” means – bondholders LOST $1.1-billion dollars (60% overnight) – when bondholders lose money – equity (or stockholders) are typically wiped out completely. They lose just about everything. In ATD’s case, bondholders received 95% of the new equity in the recapitalized company, while existing equity holders received 5% of the new equity (I would call that wiped out).
Additionally, just this week ratings agencies have downgraded California utility, Pacific Gas & Electric (PCG) to junk status. It’s common stock traded as high as $49.42 on November 8th 2018, it currently trades around $7.00. While some would suggest these are “situational”, higher interest rates will begin to accelerate these scenarios.
Perspective
As I write, our government has been shut down for over 3 weeks now, quarrelling over a $5-billion dollar allocation to fund a border wall… I don’t care what your politics are – don’t care if you want a wall or don’t, I think it’s important to put things into perspective…
As mentioned earlier, our national debt is well in excess of $21,000,000,000,000… That’s TRILLION. Every 100-basis point increase on interest rates equates to more than $210,000,000,000-billion in our cost to carry that debt.
- On Dec. 25, 2017, the federal debt was 20,492,874,492,282.58, according to the Treasury.
- According to the latest numbers published by the Treasury, which show where the debt stood on Dec. 20, 2018, the federal debt was $21,863,635,176,724.12.
- The federal government has added another $1,370,760,684,441.54 to the debt since last December 25, according to numbers published by the U.S. Treasury.
Politicians are quarrelling over a $5-billion dollar wall and not a $1.37-Trillion dollar addition to our national debt over the course of a single year, bearing with it an interest expense of roughly $13,707,607,844.41 with every 100-basis point increase?
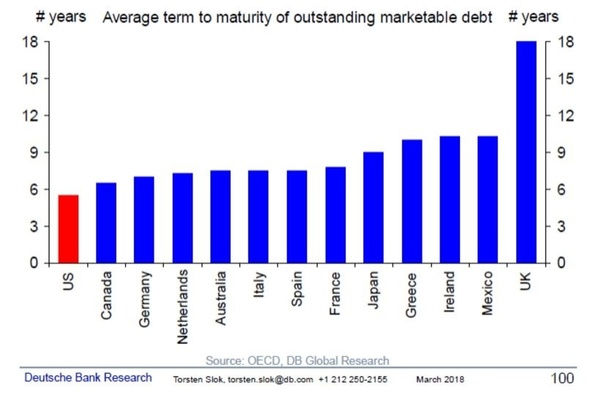
Earlier this year, Deutsche Bank estimated the average maturity on U.S Treasury debt to be less than 6 years. That’s quite a bit of debt that needs to be refinanced, should the bulk of it be done in a rising interest rate environment, it will be crippling.
Our opinion has been the same for years now, we have held the line; given the absurdly high debt levels from government to corporate, consumer all the way down to student, we do NOT believe that we have the capacity to absorb higher interest rates. As stated earlier, it is exactly what markets have told Fed chair Powell, the FOMC and the rest of the world in Q4, specifically in December immediately following the final 25-bp raise of the Fed Funds rate.
The great recession needed an equivalent of 9.25% in stimulus (the 525-basis points the Fed had at it’s disposal coupled with another 400-basis points in the form of Quantitative easing (QE). Currently we have 250-basis points of interest rate policy in hand.
Powell has to know this, but must also be keenly aware that a Federal Funds rate of 2.50% gives him a less than a nominal market impact when the FOMC will once again need to add fuel to an already fragile economy.
I’ve been speaking to a credit default cycle for a few years now, and while I’d love to be saying something else, on December 26th, 2018 Bridgewater Associates founder, Ray Dalio penned a must read regarding his views on the economy, it largely echo’s what we’ve beaten to death for years now.
For those unfamiliar with Ray Dalio, he is one of, if not the most well respected Hedge Fund managers around. Dalio’s Bridgewater Associates, is the largest hedge fund in the world with nearly $160-billion under management. Dalio published a brilliantly written piece on the current state of the economy and where he feels we are in the economic cycle… You can see the original LinkedIn post by clicking here. Should you not have a LinkedIn account, you can view a re-post, in its entirety, from financial media source Zero Hedge by clicking here. This should be required reading for all investors…
Dalio speaks to short-term debt cycles (5-10 years), long-term debt cycles (50-75 years) and how the two seem to be coming to an end at the same time. An excerpt from the piece below:
“So, it appears to me that we are in the late stages of both the short-term and long-term debt cycles. In other words, a) we are in the late-cycle phase of the short-term debt cycle when profit and earnings growth are still strong and the tightening of credit is causing asset prices to decline, and b) we are in the late-cycle phase of the long-term debt cycle when asset prices and economies are sensitive to tightenings and when central banks don’t have much power to ease credit.”
More from Dalio:
“In other words, as I see it there are a number of analogous timeless and universal cause-effect relationships that are driving things now that drove things in the 1935-40 period and in a number of times in history, which we should be mindful of. That doesn’t mean that the future is destined to play out the way it did in the 1940s. There are certainly levers that can be moved to produce good outcomes. What matters most is whether there are skilled and wise people who have their hands on those levers.” Ray Dalio, Bridgewater Associates; December 26, 2018
Dalio has also created a sketch art video in an effort to educate individuals on “How the Economic Machine Functions” which you can watch by clicking here…
No sooner had Dalio published his piece, 4 days later, on December 30th 2018, well-respected industry veteran Doug Kass authored an article that should ring true to all those who have followed our writing over that past few years.
Kass’s resume is as impressive as they get; from lecturing at Yale University’s Graduate School of Management on the subject of short selling to being a Sr. Portfolio manager for Omega Advisors (a $6-billion dollar investment partnership), his insights are more than noteworthy.
In his piece, Kass, too largely echoes what we’ve been saying for years now (with a few respectful, notable differences, as minor as they might be – they are important).
Some highlighted quotes from the piece:
- Over time, the U.S. economy has becomehorribly addicted to lower rates.
- It is a function ofpolicy mistakes, both monetary and fiscal over a protracted period of time.
- Recessions are a normal part of a business cycle in a capitalistic economy…
- This has been about the worst expansion on record. After massive stimulus we get about one quarter of 4% GDP growth, and then a decent chance of rolling right back over with rates at all of 2.5% and not much in the way of monetary or fiscal dry powder.
- Contrary to the view of many, this is not Fed Chairman Powell’s fault. There is about 30 years of blame to lay at the feet of a lot of people, both sides of the aisle, and at the Fed as well.
- Cleansing may deliver short-term pain, but it provides long-term gain.
In the past, we have written at length on virtually every bullet point above. We couldn’t agree with his statements more… But there’s more:
- Powell should continue doing the right thing, but slowly and carefully.A garden-variety recession is fine. A move down in equities is fine. Those things are normal and part of a functioning capitalistic economy. It is amazing and unhealthy that market participants seem to forget this cleansing role.
- The challenge to the Fed chairman is how exactly to do the right thing, to thread the needle.
- This is not Powell’s fault. It is the fault of his predecessors at the Fed, and in the government. It started with Alan Greenspan and the Greenspan put, and continued with Ben Bernanke and Janet Yellen, who did not rein in stimulus fast enough. (Sound familiar?)
- …But in reality, it may be a no-win situation for Powell, unless you want to be another person kicking the can down the road, setting things up for a bigger disaster at some point.
- The Fed has never embarked on an easing cycle from levels as low as they are today. The prior worst may have been about 3.5% in the 1950s — In the last cycle, the fed funds rate was already up to 5.25% before easing began. Now we can’t even get back to half that level?
“Markets are never wrong, only opinions are” ~ Jesse Livermore
Having read the above, one might think there is little to no chance of seeing the “melt-up”, we’ve previously described to occur. And while the risks and “traps” in equity markets have grown exponentially, the odds (in my opinion) of a melt-up, of sorts to take place, have too, ballooned with these risks.
As noted many times in the past, none more poignant than in our 2Q2018 piece when pointing specifically to “Bernanke and his “ilk” (Dimon, Buffet and Yellen)”:
“For the life of me, I can’t figure out if Bernanke and his ilk (Dimon, Buffett, Yellen (as you’ll see below)) convince themselves that what they are saying is factual?
My leading theory remains; they are all just terrified of the likely outcome, should they be the one who tell the truth, which sets the house of matchsticks ablaze.” OSAM 2Q2018
We would include current Federal Reserve Chair Powell as part of the Bernanke/Yellen “ilk”.
There are a few nuances where we may differ from Kass’s well-written piece:
The first is likely the most obvious, as we don’t believe the Fed has ever executed a “soft landing” or “Unicorn” as the media has labeled it in the past, as it’s “rarely if ever seen”. While we completely agree with Kass’s assessment that a cleansing is needed (and had it not been for the Fed, a natural, garden-variety cleansing would have occurred decades ago). Even should Powell “tread carefully and methodically”, given the sheer volume of artificially low yielding debt in our system, coupled with deteriorating credit quality (specifically in the BBB names a single downgrade away from “junk” status), along with the lack of interest rate stimulus currently at the FOMC’s disposal; we find it highly unlikely that the next credit default cycle or recession of sorts would be that of a “garden-variety”.
Kass keenly points out, the lowest level in which the Fed has embarked on an easing cycle was about 3.5% in the 1950’s, noting “now we can’t even get back to half that level?” As we mentioned above, current levels are paltry when compared with the 525-basis points the Fed had to work with during the last recession. Additionally, let us not forget an additional 400-basis points of stimulus was needed (which is why, per Bernanke, the FOMC implemented QE).
Dalio notes the typical central bank easing cycle is roughly 5% or 500-basis points (again, which we don’t have)
“After central banks ease by several percent (typically about 5%), that changes the expected returns of stocks and bonds to make stocks cheap and it provides stimulation to the economy, which causes stock and other asset prices to rise.” Ray Dalio, Founder Bridgewater Associates 12/26/2018
Forest fires are a natural and necessary part of the ecosystem, thinning trees promotes growth; pruning fruit trees and bushes provide us with a larger future yield. Credit default cycles are normal; they are as natural for the investing ecosystem as is a forest fire’s ashes returning nutrients to the soil rather than being trapped remaining in old, dead vegetation.
The Fed’s actions have artificially suppressed the truest of price measures our economy has; INTEREST RATES… Having done so for such an extended time frame, it’s nearly impossible to have honest price discovery in any asset class when THE asset just about everything else is priced off of (i.e. a spread off of these rates) is an artificially low manipulated disaster.
Kass, again correctly points out that Powell is NOT responsible for 30-plus years of botched monetary history. He points to a recent quote from TV personality Jim Cramer being critical of Powell and the Fed.
“I need the Fed to shut up. I don’t trust the Fed at all. I don’t trust Jay Powell at all. Jay said everything that caused a tremendous selloff. You have to got to start recognizing how powerful his words are.” Jim Cramer 12/27/2018
Arguably, more fault lay at the feet of the financial media, as they are the ones who shoulder the responsibility of holding the Fed’s feet to the fire. They have failed miserably at doing so, welcoming the Fed’s easing monetary policy for decades.
Sadly, and it pains me to say this… We feel as if the Jim Cramer’s of the world are far more likely to get their way in the short run than those like Doug Kass and myself. I’ve been yelling the aforementioned for years, and can still be wrong, but now, very recently, some heavy hitters are standing in my dugout.
Melt-Up Chances Increase?
So how could we believe the odds of a Markets “Melt-Up” have increased?
As we’ve said in the past, we don’t believe Powell or any other Fed president has the stomach to see this through?
“they are all just terrified of the likely outcome, should they be the one who tell the truth, which sets the house of matchsticks ablaze” OSAM – 2Q2018 note
And right on queue, we give you Federal Reserve Chair Powell and his previous 2 predecessors… January 4th, 2019, current Fed Chair Powell and former Chairs Yellen and Bernanke spoke together in a roundtable discussion at the American Economic Association’s annual meeting in Atlanta.
Powell and the FOMC are already on the cusp of caving to equity markets, stating its willingness to reverse course and use all tools in their respective toolbox “if necessary”.
Some poignant quotes which set the stage for a healthy dose of back peddling:
“There is no “pre-set” path for policy”…
“But we’re always prepared to shift the stance of policy and to shift it significantly if necessary in order to promote our statutory goals of maximum employment and stable prices.”
“We will be prepared to adjust policy quickly and flexibly and to use all of our tools to support the economy should that be appropriate to keep the expansion on track to keep the labor markets strong and to keep inflation near 2%.”
When speaking about the balance sheet roll-offs
“Rate policy is the active “tool” and the balance sheet would be allowed to shrink gradually and predictably in the background and it was supposed to be as interesting as watching paint dry.”
“We would be prepared to adjust our normalization plans as appropriate to achieve our goals so if we ever came to the conclusion that any aspect of our normalization plans was somehow interfering with our achievement of our statutory goals we wouldn’t hesitate to change it and that would include the balance sheet certainly.”
Coupled with Dallas Fed president Kaplan’s statement to Bloomberg reporter Michael Mckee a day earlier (Thursday, January 3rd 2019)
“We should not take any further action on interest rates until these issues are resolved, for better, for worse”
“So I would be an advocate of taking no action and — for example — in the first couple of quarters this year, if you asked me my base case, my base case would be take no action at all.”
As you read this, just about all Fed officials have now publically parroted this same “dovish” rhetoric no more than 4 weeks after their hawkish testimony and December rate increase.
We have beaten the proverbial dead horse on excessive debt and our inability to afford higher interest rates; the market voiced their opinion to the Fed in December. An ultimatum, either reverse course and use all tools at your disposal or forever be the face and name associated with what could very well be one of the most prolonged, troubling, painful recessions in history; which again, “is the blood nobody wants on their hands”.
Since then, FOMC double speak has been in overdrive. On one hand, Powell and other FOMC officials continue to preach how strong the current economy is as measured by their “data” and indicators, but have also struck this incredibly dovish tone, stating the Fed would also be listening to the message markets are sending:
“We’re listening sensitively to the message that markets are sending and we’re going to be taking those downside risks into account as we make policy going forward.” Jay Powell, January 4th 2019 roundtable discussion
So which is it? Are they listening to markets or their data? Additionally if the economy is so strong, why has the Fed taken a dovish tone? At the end of the day, the Fed is “data dependent”, just because a few conversations suggest they can and will “act if necessary”, “necessary” has an extremely ambiguous definition.
What does “if necessary” mean? Is it a further equity market sell-off? Is it their warped sense of what inflation is? Is it their data? Does their data include the tightening of credit markets as visible by the aforementioned lenders backing away from agreed upon deals, banks portfolio’ing CLOs, the lack of willingness to lend in the high-yield markets, the disappearance of sub-prime auto buyers or the warnings from world dominating monsters Fed Ex, Apple, Samsung, Macy’s and numerous others of what seems to be a Global slowdown?
The FOMC hasn’t done anything but talk yet. If a global slowdown has begun, how quickly and to what degree, with a mere 250-bp, can the FOMC re-inject liquidity back into markets and how affective will it be? What does it say about the fragility of the global economy?
Fed officials may have temporarily provided the necessary language markets yearned for to temporarily ease fears, though rest assured, at the same time the Fed is talking, they will be taking every opportunity to buy themselves as much ammunition as possible to prepare for a looming global slowdown which is likely to trigger a serious credit default cycle. Our feeling is the FOMC will likely pause on raising rates (as they have stated) but will continue to quietly “roll-off” their current balance sheet as this aspect of monetary policy has far less visibility upon it, making it much less scrutinized by the masses. Though with the Fed funds rate at 250-bp, the bulk of their ammo next go around will likely come from incredible balance sheet expansion.
They will make as much room as possible on both the Interest Rate and Monetary policy side, until their data (or markets), force them to act (i.e. cut rates again); and when the 250-basis points of interest rate policy fails to add enough liquidity into the fragile system, with what force will the QE return with? Our guess is substantial; our question will continue to be with what impact will it have as confidence contracts?
So yes, we do believe the liquidity floods back into the system, allowing the “Melt-up” to continue, however, I’m not convinced we’re out of the woods just yet… I would be very surprised that mere dovish talk from the Fed is enough to erase warranted market jitters. Our current prevailing thought is continued market volatility is far more likely to force the hand of the Fed; requiring that they back up their talk with action before blindly giving them a pass. I will be surprised if talk is enough, but stranger things have happened? Markets could very well head into March, a deal with China could be struck sending markets to new highs, allowing the fed to continue gathering ammo until larger cracks appear circa 2007? We’ll be ready for either scenario.
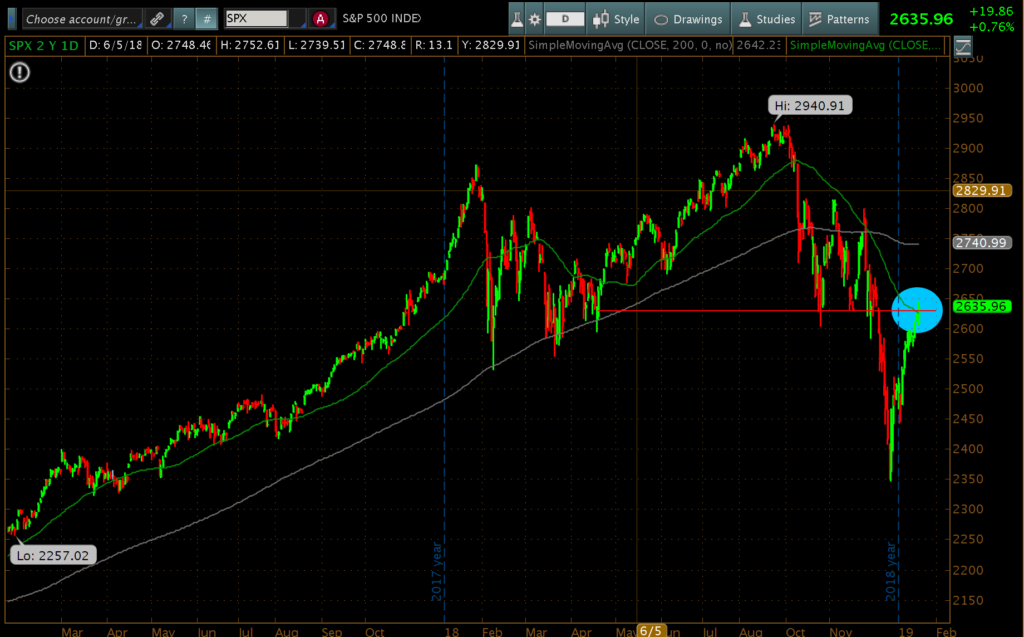
For this reason, we are hesitant to be “all in” at this moment in time. As we release this note, equity markets sit at critical resistance levels. Additionally, we’ve said history doesn’t always repeat itself but it often rhymes.
A 2-year chart of the S&P 500 as it currently sits in 2019 – please note highs, lows and patterns.

A 2-year chart of the S&P500 in 2007-2008 – please note highs, lows and patterns.
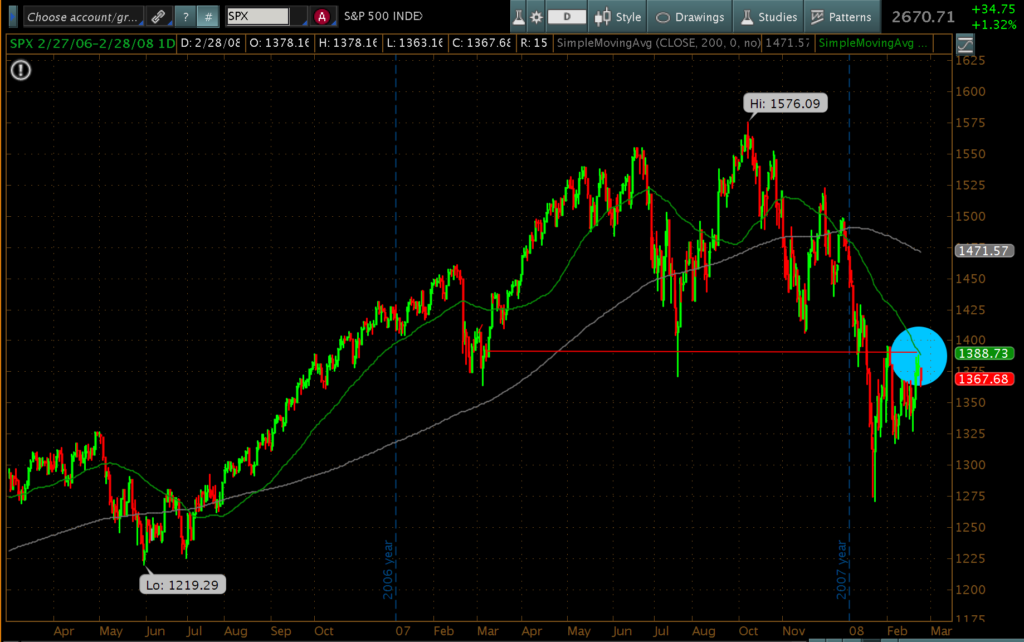
I have no idea what the ultimate outcome will be, we are in too similar a situation to be reckless now.
While we’re borrowing information from 1Q2019, just this week, bellwether financial companies JP Morgan (JPM) and Citigroup (C) the first and third largest U.S lenders, followed by Wells Fargo (WFC) all recently reported earnings missing top line revenue growth numbers. JP Morgan’s fixed income trading revenue fell to lowest levels since the financial crises nearly a decade ago. In the case of JPM and C, both CEO’s spoke to the current strength of the economy, but at the same time, both companies reported increases in their loan-loss provisions and credit costs… So in typical do as I say, not as I do fashion, while Jamie Dimon is publically preaching one thing, they are positioning their balance sheets for a downturn in credit markets… even if they won’t publically admit it.
Having said this, understanding January is often seasonally strong based upon contributions to 401k plans and rebalancing of pension fund rumored to be in the hundreds of billions to equities, we feel as if this recent strength is likely to subside and lows are likely to be re-tested before Fed officials actually ACT. (Christmas eve’s lows could very well prove to be the lows set in place prior to the next leg higher, though again, we would be surprised not to see a re-test of these lows forcing the Fed to act vs. talk).
Nothing says things will pay out as described, it’s just the way we see things based upon the Macro environment. Should they play out with the Fed as described, it of course, doesn’t fix the larger problem it only exacerbates it. Our macro views have been fairly accurate since we began writing in July of 2015. We remain cautiously optimistic into 2019, though stress cautious. We likely become more aggressive with our holdings should the Fed truly “ACT”, by cutting rates and beginning another round of QE, though we will tighten our capital preservation strategies, as the Fed cutting will be an admission of a few very important issues. 1. We’re in deeper s**t than most originally thought 2. The global slowdown is very real and 3. The global economy is much more fragile than believed.
It may also lead to more questions than answers… such as: regardless of what the Fed does, will institutional bond managers begin to insist on greater interest rates (spreads over the treasury) for the risk they are accepting for the clients they represent? For if the Fed does decrease rates, this confirms companies are more sensitive to interest rate hikes and weaker than originally thought; investors should be compensated as such. With nearly $4-trillion of corporate debt either being due or up for refinancing over the next 4-years, the government expected to run over $1-trillion per year in deficits for the foreseeable future and the largest treasury bond buyer over the past decade running off it’s balance sheet (The Fed), even a reinstated QE program may not be strong enough to stop or support the next credit default cycle?
Finally, should it become another coordinated global central bank effort to support things, how long can it go on given how highly leverages global central banks are? For insight:
Alex J. Pollock is a distinguished senior fellow at the R street institute in Washington. He was president and CEO of the Federal Home Loan Bank of Chicago from 1991-2004. On January 10th 2019 he penned an article in the American Banker titled, The Fed is technically insolvent, Should anybody care? For what it’s worth, I do… I would think you should be, too; if so, enjoy the read it’s eye-opening perspective.
Shoshin:
Is a term used by Zen Buddists to describe an attitude of openness, eagerness and lack of preconception when studying a subject; even when studying at an advanced level. Just as a beginner would, this is also known as “beginners mind”.
As most of you know by now, we make a concerted effort, trying to get people to think a little differently, or rethink beliefs we believe to be truths, approaching them from a different angle or view point, a Zen Buddhists “beginners mind” or “Shoshin” approach. We remind people that thinking “different”, doesn’t always mean it’s better, though, as with many things in life, there are times we do things simply because it’s how we’ve been taught, often assuming those doing the teaching are correct, but what if they’re not?
The illusory truth effect is the tendency to believe information to be correct after repeated exposure; i.e. because you keep hearing the same thing over and over, it must be true.
Though, what happens if and when a narrative is controlled? Robert N Proctor of Stanford University’s History Department published a paper on “The shameful past: the history of the discovery of the cigarette -lung cancer link”. Proctor writes:
“As late as 1960 only one-third of all US doctors believed that the case against cigarettes had been established.”
It’s important to note that many doctors were paid spokespeople for the tobacco industry. We’ve quoted Upton Sinclair before but it’s worth revisiting:
“It is difficult to get a man to understand something, when his salary depends on his not understanding it.”
Proctor’s 37th reference: “Everyone knew but no one had proof”: Tobacco industry use of medical history expertise in US courts, 1990-2002. Tob Control 2006;15:iv117-25
Even with countless peer reviewed studies published in medical journals (once deemed prestigious) such as JAMA; including animal experiments dating back to the 1930’s and 40’s, the tobacco industry drove their narrative “cigarettes are safe and don’t cause cancer” for decades – and they did so, large in part, by using a trusted party (a doctor) to promote the product doing the harm.
The term “propaganda” has a negative connotation, but is a powerful marketing machine with a self serving agenda all that different? Hundreds of billions to trillions of dollars of commissions and fees (i.e. revenue) are up for grabs in the financial industry, is their any chance the narrative is driven by those who benefit most? (While making it appear as if you, the client, always comes first?)
With this in mind, I wrote many of you asking a relatively simple question. I asked for a knee jerk reaction to an open-ended question.
What are you investing for? Phrased differently, why do you invest?
Simple enough question and the answers were as diverse as my client base; I’ve taken the liberty of consolidating and providing an abridged list below:
- Current Return
- Asset preservation/appreciation
- Fun/entertainment
- Future security
- Financial independence (with a humorous mic drop)
- Inheritance to heirs
- Future retirement & expenses
- College tuition
- Mortgage
I even got a picture…

The most common and obvious answer, as anticipated, was, “retirement”.
However, there was a more specific answer I was hoping for, with only a handful mentioning it…
When the time comes for you to retire what should now become priority number 1?
The more specific answer I was looking for was INCOME. For when the time comes to leave your PRIMARY source of INCOME, you now NEED a NEW PRIMARY source of INCOME.
The #1 question all investors remotely close to retiring should be asking…
Where is that income going to come from? What is the most predictable source to generate this income? What is the most reliable way to achieve this without having to hope and pray equity markets go up so you don’t outlive your money? Or think you can run your company until the last day of life?
Outliving your money is not only the number one fear of soon to be retirees; it’s the number one fear of their financial planners as well. In a study done by Insurance behemoth Allianz, 92% of respondents believe “somewhat or absolutely”, that the United States is facing a retirement crisis, with 47% fearing not being able to cover basic living expenses in retirement. And while this study is from 2010, more recent studies suggest the same with 43% of those surveyed suggesting their greatest fear about retirement was outliving their savings and investments. A study released from the American Institute of CPAs found 57% of financial planners surveyed placed clients running out of money in retirement was their #1 fear.
The financial industry is failing miserably. So what can you do about it?
“I suppose it is tempting, if the only tool you have is a hammer, to treat everything as if it were a nail” ~ unknown
While often attributed to sources ranging from Buddha to Mark Twain (even the bible), the origin of the above quote is questionable. It’s been stated differently many times throughout history, however, the world of psychology attributes “The Law of the Instrument”, to psychologists Abraham Kaplan and Abraham Maslow (Maslow being best known for creating “Maslow’s hierarchy of needs”).
The law of the Instrument is a cognitive bias that involves an over-reliance on a familiar tool (also known as “Maslow’s Hammer” or “Law of the Hammer).
All too often, we allow “the law of the instrument”, our “learned” biases, coupled with outside influences, i.e. the cognitive bias’s of trusted friends, advisors and plain bad advice, to get in the way of a properly constructed, sound retirement plan that includes a balanced mixture of financial vehicles; crossing industry borders in an effort to address the most feared aspects of retirement.
What can you do about it?
Ask yourself some extremely simple, but important questions…
- When would I like to retire?
- AT WHAT PREDICTABLE INCOME do I want to retire with?
- What solutions are truly best to achieve my goals?
Do you sincerely understand the benefits and challenges of all investments available to you or are you dismissing certain investments due to your cognitive bias or that of your advisor? Or could approaching the scenario with a Shoshin (beginners mind) approach, be beneficial?
Is a diversified portfolio of equities and/or bonds right for you? Possibly a FIA (fixed indexed annuity) with a 6% yearly rollup and company backed guaranteed predictable income for the rest of your life? Have you explored a Life Insurance Retirement Plan (LIRP)? Maybe it’s cash or gold coins under your pillow or buried in a couch in some random storage unit? Does it have to be all or nothing? Could it be a combination of all of the above?
“The Law of the Instrument” suggests your traditional Wall Street financial advisor will favor listed financial market instruments (mutual funds, ETFs, stocks, or bonds), while the annuity professional, would favor the FIA and the Insurance broker, the LIRP. It also suggests the advice you get from your friends, accountant, family members will favor their own personal bias based upon what they have been sold over the years, so the advice you’re getting from them is that which those advising them are most familiar.
Yet more people are scared of outliving their money than death itself…
This doesn’t have to be you…
A bird in the hand is worth more than two in a bush…
In its most simplistic form, our view attempts to take as much “guess work” out of the equation.
We believe there is a mathematically correct solution for each of us based upon our own individual wants and needs. A properly designed, well-executed plan implementing the best of breed solutions from each segment of the financial industry takes the pressure off any single one to perform.
In its most simplistic of form, our definition of a “mathematically correct solution” is one, which provides a predictable replacement income stream for life that has the ability to increase over time with inflation; one that addresses immediate emergency needs, while also providing growth throughout your retirement years.
Top priority is addressing your every want and need with predictability and safety, utilizing the proper tool for the right job within the plan. The tools characteristics dictate its use, NOT a cognitive bias.
Based upon ones desired income requirement and current nest egg, plans can get quite complex, but the basic foundation as to which the plan is built remains constant, during the initial design. A common mistake is many holdings are overlooked, branded as “untouchable”. This is a mistake, all should be evaluated (even if you don’t think they can be used at a particular moment in time).
For instance, three-quarters of Americans either don’t believe they pay any fees on their 401k plan or have no idea what they pay in fees. Did you know that 401k plans have some of the highest fees in the industry, so high, even companies who offer 401k plan services like Fidelity and Blackrock have been sued by their own employees? In his book, Money: Master the game, Tony Robbins research team suggest 401k fees (included hidden fees) average well over 3%.
Assuming three individuals, all age 35, earning the exact same return of (8%) on the same amount of money ($100,000) over the same time frame (30-years). The only difference being the annual fee they pay. Assume investor A pays a 1% fee, investor B pays 2%, while investor C pays 3% in fees. In the end, the difference is staggering, with the investor A ($761,225) earning $329,031 MORE than investor C ($432,194) a difference of over 75% due to fees. How do your fees stack up? Click here for a free 401k-fee analyzer!
What if you could unlock the power of your 401k and reduce fees at the same time? Did you know that more than 70% of all 401k plans allow for what is called an In-service rollover? This is way to roll your 401k assets to an IRA, taking advantage of all investment vehicles rather than a limited choice.
What about taxes? Do you really think you’ll be paying less in taxes when you retire? We are more than $21-trillion in debt as a country, newly elected Congresswoman Alexandria Ocasio-Cortez has floated a “70% Wealth Tax” on earned dollars over $10-million.
“Tax experts consulted by the Washington Post say that a 70% on income over $10-million could theoretically bring in an additional $72-billion per year in taxes, or $720-billion over a decade” Money – 1-7-2019
Money points out it would be enough to pay for Bernie Sanders plan to provide tuition-free college, estimated cost $800-billion over 10 years. Politicians are floating ideas like this in an effort to raise money to PAY for further spending plans, not cut deficits and current debt. What in the name of all that’s holy do you think will eventually pay down the national debt? Higher taxes & inflated, devalued currency top my list as suggestions.
So have you considered executing a Roth IRA conversion? Even if you’re making less in future years, based upon the spending habits and demographics of our current and future politicians, I find it difficult to draft a case for lower future taxes. What about a partial Roth conversion spreading the tax burden out over a few years, yet allowing your money to grow on a TAX FREE basis?
These strategies can save you years off your retirement if properly executed, you should be exploring all of these strategies and more. Unfortunately, both history and experience suggest many will likely continue with their respective biases and beliefs suggesting, “Market history shows”…
A conversation might still be worthwhile? In the interim I’ll finish with a few salient points.
First: there is nothing “equity/bond market related” that provides assurances of a contractual, predictable income stream years into the future, let alone for life.
Second: How many investors or investment professionals will be attempting to “buy the dip” or suggest “holding on” when an inevitable downturn becomes a full-blown disaster rather than a mere correction within a continuing bull market? I don’t know if this one is “it”, but I know our debt is unsustainable at these levels, even less so in an increased rate environment.
Third and final point (for now): “Sequencing of Returns”- if you’re unfamiliar, two investors, both retiring on the same lump sum of money can experience the exact same “average annual returns”, yet based upon the order or “sequence” in which each investor earns their respective returns (while attempting to draw an income from these investment), can yield vastly different retirement outcomes.
The two tables below allow you to visualize this easily. Example 1 takes Market Returns as measured by the S&P 500 from 1929 – 1949. Each investor begins with $2,000,000
| Year | Annual Return | Investor A | Reversed sequence of returns | Investor B |
|
|
| $2,000,000.00 |
| $2,000,000.00 |
|
|
|
|
|
|
| 1929 | -8.30% | $1,834,000.00 | 18.30% | $2,366,000.00 |
| 1930 | -25.12% | $1,373,299.20 | 5.70% | $2,500,862.00 |
| 1931 | -43.84% | $771,244.83 | 5.20% | $2,630,906.82 |
| 1932 | -8.64% | $704,609.28 | -8.43% | $2,409,121.38 |
| 1933 | 49.98% | $1,056,772.99 | 35.82% | $3,272,068.66 |
| 1934 | -1.19% | $1,044,197.40 | 19.03% | $3,894,743.32 |
| 1935 | 46.74% | $1,532,255.26 | 25.06% | $4,870,766.00 |
| 1936 | 31.94% | $2,021,657.59 | 19.17% | $5,804,491.84 |
| 1937 | -35.34% | $1,307,203.80 | -12.77% | $5,063,258.23 |
| 1938 | 29.28% | $1,689,953.07 | -10.67% | $4,523,008.58 |
| 1939 | -1.10% | $1,671,363.58 | -1.10% | $4,473,255.48 |
| 1940 | -10.67% | $1,493,029.09 | 29.28% | $5,783,024.69 |
| 1941 | -12.77% | $1,302,369.27 | -35.34% | $3,739,303.76 |
| 1942 | 19.17% | $1,552,033.46 | 31.94% | $4,933,637.39 |
| 1943 | 25.06% | $1,940,973.05 | 46.74% | $7,239,619.50 |
| 1944 | 19.03% | $2,310,340.22 | -1.19% | $7,153,468.03 |
| 1945 | 35.82% | $3,137,904.09 | 49.98% | $10,728,771.35 |
| 1946 | -8.43% | $2,873,378.78 | -8.64% | $9,801,805.51 |
| 1947 | 5.20% | $3,022,794.47 | -43.84% | $5,504,693.97 |
| 1948 | 5.70% | $3,195,093.76 | -25.12% | $4,121,914.85 |
| 1949 | 18.30% | $3,779,795.91 | -8.30% | $3,779,795.91 |
After 21 years, regardless of sequence, both investors ended with the same amount of money. However, if you are retired, and attempting to withdraw an income from your lump sum investment account to fund your retirement, “sequence of returns” has the ability to significantly impact your future retirement.
The below example utilizes the same time frame 1929-1949 as well as the same lump sum retirement amount of $2,000,000. The only difference in the below example is each “hypothetical investor” is now withdrawing $100,000 per year to fund their retirement.
| Year | Annual Return | Investor A | Reversed sequence of returns | Investor B |
|
|
| $2,000,000.00 |
| $2,000,000.00 |
|
|
|
|
|
|
| 1929 | -8.30% | $1,734,000.00 | 18.30% | $2,266,000.00 |
| 1930 | -25.12% | $1,198,419.20 | 5.70% | $2,295,162.00 |
| 1931 | -43.84% | $573,032.22 | 5.20% | $2,314,510.42 |
| 1932 | -8.64% | $423,522.24 | -8.43% | $2,019,397.20 |
| 1933 | 49.98% | $535,198.65 | 35.82% | $2,642,745.27 |
| 1934 | -1.19% | $428,829.79 | 19.03% | $3,045,659.70 |
| 1935 | 46.74% | $529,264.83 | 25.06% | $3,708,902.02 |
| 1936 | 31.94% | $598,312.02 | 19.17% | $4,319,898.53 |
| 1937 | -35.34% | $286,868.55 | -12.77% | $3,668,247.49 |
| 1938 | 29.28% | $270,863.67 | -10.67% | $3,176,845.48 |
| 1939 | -1.10% | $167,884.16 | -1.10% | $3,041,900.18 |
| 1940 | -10.67% | $49,970.92 | 29.28% | $3,832,568.55 |
| 1941 | -12.77% | -$56,410.36 | -35.34% | $2,378,138.83 |
| 1942 | 19.17% |
| 31.94% | $3,037,716.37 |
| 1943 | 25.06% |
| 46.74% | $4,357,545.00 |
| 1944 | 19.03% |
| -1.19% | $4,205,690.21 |
| 1945 | 35.82% |
| 49.98% | $6,207,694.18 |
| 1946 | -8.43% |
| -8.64% | $5,571,349.41 |
| 1947 | 5.20% |
| -43.84% | $3,028,869.83 |
| 1948 | 5.70% |
| -25.12% | $2,168,017.73 |
| 1949 | 18.30% |
| -8.30% | $1,888,072.25 |
Investor A’s returns mirrored market returns from 1929-1949, running out of money in just over 11 years while Investor B – whose returns were simply Investor A’s returns in reverse order, had nearly $1.9mm at the end of the 21 year period of time. Again, each investor withdrew $100k per year (for as long as they could).
I felt the time frame apropos, based upon Ray Dalio’s thoughts in his previously referenced note, if you haven’t read it, I would highly recommend the read.
Those looking to draw income from investments exposed to market fluctuations are subjected to what boils down to “luck of the draw”. We would advise against using hope as the strategy of choice when predictability and prudence is necessary, as is the case when it comes to retirement. Additionally, we would advise against allowing someone else’s Law of the Instrument dictate what the right instrument is for you.
As always, we’re happy to discuss our market thoughts along with these strategies and more, never hesitate to reach out with any questions or concerns.
Good Investing!
Mitchel
Mitchel C. Krause
Managing Principal & CCO
4141 Banks Stone Dr.
Raleigh, NC. 27603
phone: 919-249-9650
toll free: 844-300-7344
mitchel.krause@othersideam.com
www.othersideam.com
** We continue to work on getting our flagship model’s numbers audited from a performance standpoint. In opening our new firm (OSAM), performance will only be able to be officially audited as far back as the complete sets of statements we receive from clients. This may remove data points from our official numbers upon audit completion affecting 2016’s reportable performance number.
Disclosure: The commentary, analysis, references to, and performance information contained herein, except where explicitly noted, reflects that of Other Side Asset Management, LLC, a registered investment adviser. Opinions expressed are as of the current date and subject to change without notice. Other Side Asset Management, LLC shall not be responsible for any trading decisions, damages, or other losses resulting from, or related to, the information, data, analyses or opinions contained herein or their use, which do not constitute investment advice, are provided as of the date written, are provided solely for informational purposes and therefore are not an offer to buy or sell a security. This commentary is for informational purposes only and has not been tailored to suit any individual. References to specific securities or investment options should not be considered an offer to purchase or sell that specific investment. Other Side Asset Management, LLC does not guarantee the results of its advice or recommendations, or that the objectives of a strategy will be achieved. Performance shown herein should in no way be considered indicative of, or a guarantee of the actual or future performance of, or viewed as a substitute for any portfolio invested in a similar strategy. Performance data shown represents past performance, which does not guarantee future results. Investments in securities are subject to investment risk, including possible loss of principal. Prices of securities may fluctuate from time to time and may even become valueless. Securities in this report are not FDIC-insured, may lose value, and are not guaranteed by a bank or other financial institution. Before making any investment decision, investors should read and consider all the relevant investment product information. Investors should seriously consider if the investment is suitable for them by referencing their own financial position, investment objectives, and risk profile before making any investment decision. There can be no assurance that any financial strategy will be successful. All data presented is based on the most recent information available to Other Side Asset Management, LLC as of the date indicated and may not be an accurate reflection of current data. There is no assurance that the data will remain the same. This commentary contains certain forward-looking statements. Forward-looking statements involve known and unknown risks, uncertainties and other factors, which may cause the actual results to differ materially, and/or substantially from any future results, performance or achievements expressed or implied by those projected in the forward-looking statements for any reason. No graph, chart, or formula in this presentation can be used in and of itself to determine which securities to buy or sell, when to buy or sell securities, whether to invest using this investment strategy, or whether to engage Other Side Asset Management’s investment advisory services. In addition to the Other Side Asset Management’s advisory fee, overall returns may be reduced by expenses that an investor may incur in the management of the investor’s account, such as for custody or trading services, which will vary by investor and may exceed the trading costs reflected herein.

