
In This Article

We’re still working on dialing in our quarterly, though, for now we’re going to stick to last quarter’s formatting:
- Announcements
- Observations
- What every investor should learn from billionaire Paul Tudor Jones
- Let’s play a game
- Millionaire vs. Billionaire
- X Marks the Spot
- A look back at the previous quarter.
- We dissect the model; specifically, why we own what we own?
- Forward-looking thoughts.
- Lessons from Hurricane Florence.
We highlight the importance of our discipline throughout, while adding educational insights along the way…
Announcements…
With 2018 a few months from coming to a close, the progress we’ve made since opening our doors in February is astonishing. We are evolving by the day, largely in part with your help. When multiple clients voice similar questions or concerns, we do our best to listen. Having said that, we have two items we’d like mention.
1. Some of you may have heard me discuss our performance reporting software company, Black Diamond. Within the next month or so, each of you will receive an email allowing you to log into the Black Diamond Wealth Platform, via your desktop as well as mobile devices (Apple or Android systems). We are pleased to release this feature to our clients. While the TD system allows you to view your accounts, the Black Diamond platform is exponentially more robust, visually appealing and user friendly. Please keep an eye out for an email discussing this.
2. We will be creating additional models to add to our lineup, each intended to serve a different purpose. All models will stick to our core disciplines in implementing capital preservation strategies. Our current, model implements more of a “total return” strategy – for those willing to stomach a little more volatility we’re looking to add both a “capital appreciation” model focused more on growth. We’ll also be introducing an even “more concentrated portfolio” geared towards emerging technology leaders; these companies are focused on disrupting technologies. Finally, we’re exploring the possibility of building an “Income” portfolio.
These models should be ready over the next month or so, prior to 2019. (Excluding the Income portfolio as this is currently conceptual)
Some clients are willing (asking) to accept more risk, stomaching an increased volatility vs. our current offerings. Many clients have decades before leaving their current primary income streams while others are much closer to retirement, requiring more stability and less volatility. Please call for further conversation or should you have any questions or concerns.
I want to be very clear –
If the market volatility these last few weeks of October have kept you up at night, it’s a definite sign that you are taking on more risk then you should be. Moves like this would not be considered extreme; they are historically typical and should be expected when investing in equities. Should this be you, CALL ME IMMEDIATELY, we will address this.
Now, let’s get into the numbers, make our observations and then talk outlook:
2018 YTD for the S&P
8.09% Total Return
2018 YTD for the DJIA
6.58% Total Return
2018 YTD for our Equity Solutions Model
0.38% **Total Return
Observations:
The previous 2 years and 5 months brought us outperformance with significantly less risk; we’ve talked about this before. Many reading these notes have experienced being up over 15% and 21% in 2016 & 2017, respectively, while holding between 10-36% in cash at any given time. There are others, however, who have joined us more recently that may currently be flat to slightly down. The manager hasn’t changed, nor investment parameters or style, merely entry points and “timing” (both time in markets and timing of entry into a specific model).
If you have read any of these notes, you are aware that I constantly worry… I’d like to think that I worry enough for all of us, but I’ve been in the industry long enough to know the vast majorities of individual investors begin to get uneasy when they see flat to underperformance vs. traditional benchmarks.
Those who have experienced significant gain over the past 2 years often “bank” what one might call “goodwill” – they’ve experienced the good, so while still paying close attention, they are often far less concerned about the short term than those who have not experienced the same (previous) outcomes (much more on this later).
If your focus is solely performance vs. standard benchmarks, yes, the gap has slightly widened a bit more from the previous quarter. One thing we will never do at OSAM is hide, while we ended Q3 year to date (YTD) on the positive side of the equation, we are currently down vs. traditional benchmarks. these last 4 months have been plagued with stocks triggering capital preservation strategies contributing to the underperformance against the traditional measure, but that is far from where the story ends. We urge you to keep reading as we dissect our holdings, and take a deep dive into our thesis, discussing at great length what drives many of our investment decisions.
At one point during Q3 nearly 60% of the DOW and roughly 50% of the S&P was trading outside of their average 3-year volatility ranges, with even more companies dangerously close to falling into the “red” category. Based upon this fact, along with countless other indicators, we remained prudent, holding a larger percent in cash, waiting to reinvest money generated from sales due to capital preservation strategies triggering; knowing full well and good that upon a rebound, we would not rebound as much.
We believe there are times to go full throttle, putting the gas pedal to the floor – there are also times to show caution (You may survive making a hairpin turn at 120-mph but it might not be the best idea to try it?) Given the health of the market at the time, we chose prudence and will do it again if presented with a similar scenario (we happen to be in very good company as described in detal below). During this stretch of market turbulence, the Russell 2000 (small cap stocks) was the index which appeared “most healthy”, yet in true “reversion to the mean” fashion, Octobers early snapback hit the Russell the hardest as it lost -12.11% peak to trough from October 3rd – October 10th.
As mentioned above, 2016 & 17 brought with it compounding outperformance while taking significantly less risk than “markets”. At any given point over that time frame we held between 10-36% in cash. We accomplished this by following a specific plan or map, maintaining a strict discipline of cutting losers before becoming problematic, while allowing winners to “run”, many of which produced outsized gains allowing us to remain prudent in delivering extremely solid returns.
So – what gives in 2018? Did we forget how to do it? Were we lucky 2 years in a row?
We touched upon this briefly in our Q2 note, though I think it’s important to take a deeper look into the entire portfolio, its construct and more importantly, our Q3 sales to fully understand the importance of what we do. Please find our Q3 sales listed below:
| Ticker | Exit Price | Current Price | Further $ Loss | % Change Since Sold |
|
|
|
|
|
|
| CAF | $21.89 | $17.73 | ($4.16) | -19.00% |
| TCEHY | $46.17 | $35.01 | ($11.16) | -24.17% |
| GDS | $27.30 | $25.55 | ($1.75) | -6.41% |
| ZTO | $19.67 | $15.38 | ($4.29) | -21.81% |
| USCI | $41.75 | $41.71 | ($0.04) | -0.10% |
| SQM | $44.55 | $41.21 | ($3.34) | -7.50% |
| SAND | $3.66 | $4.10 | $0.44 | 12.02% |
| BABA | $162.93 | $142.02 | ($20.91) | -12.83% |
| BIDU | $215.19 | $191.88 | ($23.31) | -10.83% |
| FB | $162.27 | $154.92 | ($7.35) | -4.53% |
| NPSNY | $41.39 | $37.34 | ($4.05) | -9.78% |
| SWKS | $92.73 | $86.23 | ($6.50) | -7.01% |
| GLNCY | $7.91 | $7.98 | $0.07 | 0.87% |
| MKTX | $190.74 | $194.72 | $3.98 | 2.09% |
| MLM | $192.82 | $162.75 | ($30.07) | -15.59% |
**** Prices as of close of business 10/18/2018
We sold 15 names out of the portfolio in following our capital preservation strategies; of which 80% of the names currently remain below where we sold them (the very right column representing the % gain or loss SINCE the date we sold them. As you can see these numbers range anywhere from “slightly” negative to down an additional -24%)
These numbers are self-explanatory; think about what performance would have been had we not defended our downside? One notable difference being SAND, SAND is up roughly 12% and was part of our gold hedges (more on Gold later).
In Tony Robbins book, “Money Master the Game”, Robbins interviews legendary billionaire investor Paul Tudor Jones. This interview is where the true value of this book lies, for me anyway… Paul Tudor Jones does not speak publically often; with an estimated net worth of $4.5 billion built from his investing successes, when he does talk ALL investors should take note. Below, please find some extremely pertinent highlights from Robbins’s interview with PTJ. We can point to countless pertinent parallels in what I’m attempting to convey over the course of this note based upon our most recent quarter… (TR-Tony Robbins, PTJ-Paul Tudor Jones) Bold emphasis mine:
PTJ: So the turtle wins the race, right? I think the single most important thing that you can do is diversify your portfolio. Diversification is key, playing defense is key, and, again, just staying in the game for as long as you can.
TR: Following up on diversification, how do you think about asset allocation in terms of playing defense?
PTJ: There’s never going to be a time where you can say with certainty that this is the mix I should have for the next five or ten years. The world changes so fast. If you go and look right now, the valuations of both stocks and bonds in the US are both ridiculously overvalued. And cash is worthless, so what do you do with your money? Well, there’s a time when to hold em and a time when to fold em. You’re not going to necessarily always be in situation to make a lot of money, where the opportunities are great.
TR: Okay, any specific strategies for protecting your portfolio?
PTJ: I teach an undergrad class at the University of Virginia, and I tell my students, I’m going to save you from going to business school. Here, you’re getting a $100k class, and I’m going to give it to you in two thoughts, okay? You don’t need to go to business school; you’ve only got to remember two things. The first is, you always want to be with whatever the predominant trend is.
TR: So my next question is, how do you determine the trend?
PFJ: My metric for everything I look at is the 200-day moving average of closing prices. I’ve seen too many things go to zero, stocks and commodities. The whole trick in investing is: “How do I keep from losing everything?” If you use the 200-day moving average rule, then you get out. You play defense, and you get out.
TR: That is considered one of the top three trades of all time, in all history (1987 Crash)! Did your theory about the 200-day moving average alert you to that one?
PTJ: You got it. It had done under the 200-day moving target. At the very top of the crash, I was flat.
TR: What’s the second thought for students?
PTJ: 5:1 (risk /reward). Five to one means I’m risking one dollar to make five. What five to one does is allow you to have a hit ratio of 20%. I can actually be a complete imbecile. I can be wrong 80% of the time, and I’m still not going to lose.
TR: Since asset allocation is so important, let me ask you: If you couldn’t pass on any of your money to your kids but only a specific portfolio and a set of principles to guide them, what would it be?
PTJ: I get very nervous about the retail investor, the average investor, because it’s really, really hard. If this was easy, if there was one formula, one way to do it, we’d all be zillionaires. One principle for sure would (be to) get out of anything that falls below the 200-day moving average.
Please allow these thoughts to sink in…
- The whole trick in investing is: How do “I keep from losing everything?”…. “You play defense and you get out”
- “Well, there’s a time when to hold em and a time when to fold em. You’re not going to necessarily always be in situation to make a lot of money, where the opportunities are great”
- The first (thought to pass on) is you always want to be with whatever the predominant trend is.
He’s nervous about the retail investor (for good reason), most retail investors are either tremendously emotional, or follow a broker who is equally so (we stress the importance of being rules based). But most importantly Tony Robbins asks Paul Tudor Jones if you could pass on a specific set of principles to guide his own children, what would it be?)
And I quote:
- “Our principle for sure would get out of anything that falls below the 200-day moving average”
The specific set of principles PTJ would like to pass down to his children, his own flesh and blood is to sell anything that falls below the 200-day moving average!!!
Why? Because he knows that there will be plenty of winners that will come his way over time, there will be plenty of situations where the opportunities to make money will be great, he’ll catch his fair share of trends setting him apart from those closet indexers; but losers…. Losers will cripple him and are significantly more difficult to recover from. Losers take you out of the game.
The illustration below shows you the math… Simply put, the more money you lose, it becomes exponential in terms of the percentage you need to make up simply to break even.
| Starting Value | Dollar Loss | Dollar value remaining | % lost | % Required to break even |
|
|
|
|
|
|
| $1.00 | $0.10 | $0.90 | 10% | 11.11% |
| $1.00 | $0.20 | $0.80 | 20% | 25.00% |
| $1.00 | $0.30 | $0.70 | 30% | 42.86% |
| $1.00 | $0.40 | $0.60 | 40% | 66.67% |
| $1.00 | $0.50 | $0.50 | 50% | 100.00% |
| $1.00 | $0.60 | $0.40 | 60% | 150.00% |
| $1.00 | $0.70 | $0.30 | 70% | 233.33% |
| $1.00 | $0.80 | $0.20 | 80% | 400.00% |
| $1.00 | $0.90 | $0.10 | 90% | 900.00% |
Simply stated, the 200-day moving average is Paul Tudor Jones’s Capital Preservation Strategy! It’s his protection against catastrophe and carnage. It’s what will allow him to make more by losing less…
In the book “Reminiscences of a Stock Operator”, Jones leaves further gems of brilliance (his commentary starting on page 399). A constant theme and focus of PTJ is the importance of protecting assets, yet here he speaks to investor psyche and emotion.
“But back to Wall Street: The game is the same though the actors have changed. And the content is essentially the same although it’s taken on some new forms. Specialists and floor traders who used to be well-paid gatekeepers of short –term liquidity for customer orders have been supplanted by high-frequency trading programs that provide moment-to-moment liquidity and harvest billions annually from the markets…”
PTJ continues…
“But at the end of the day, markets will always be driven by greed and fear, valuations will always swing from too cheap to too dear, and there will always be a new generation to rationalize why this time is different. But I guarantee that for as long as I live I will always be able to find a chart that will look like another chart from another era, showing once again how Mr. Market rand the full gamut of emotions…” PTJ page 403; Reminiscences of a Stock Operator
He’s telling us that while the names of businesses have changed over time, human nature and emotions play a tremendous role in the elasticity of equity markets. Prices will move further to both the upside and downside of what fundamentals can support based upon investors emotions, fear of missing out, greed, euphoria, etc.
The last 4 months we have been playing good defense, the question should then be, why does it seem as if we been playing a bit more defense then the overall benchmarks?
There are many answers to this question; the answer lies partially in a handful of names, representing a larger percentage of the indices moving more than other names. The answer also partly ties into PTJ’s thoughts on investor psyche, overreaction to what fundamentals support and investing with the predominant trend.
Our China thesis began as an obscure thought to many; it quickly became a predominant trend in 2017 and into 2018, along with U.S tech (FAANG stocks). When we entered our China positions in 2016 we were a little early (most thought we were crazy) yet the thesis was spot on; incredible alpha was generated over the next year and a quarter. It’s largely in part to what allowed us to maintain outperformance with such a high percentage of cash in hand.
There are times where markets are not efficient, where perception and reality don’t always match up. We feel as if that’s the case currently going on right now with our China thesis. The fear and uncertainty of tariffs and “trade wars” has captivated investors. Couple this with an already warped sense of what China is (highly, technologically advanced society) vs. what we believe it to be (emerging third world country) and you have the recipe for our current environment. Rather than remaining staunch in our beliefs that our “thesis” IS correct, we remained firm in our disciplines, defending our capital and protecting our downside from additional 10-25% declines from where we exited the names.
Our thesis was right, it worked for a period of time and served its purpose; discipline told us it was time to “bench” the China thesis. There will likely come a time in the near future we’ll revisit many of the names we sold out of, plus some… Money flow into China local A shares will continue and grow, MSCI continues to increase their percentages while other indices have now begun to piggyback MSCI, FTSE Russell is just another recent example. Chinese pension funds will buy equities; and with great likelihood, the Chinese government will eventually place a floor in markets (a 30% decline triggered their last major intervention, we’re right at 30% as of today). However, I am not willing to sacrifice your capital to prove myself correct. Had we not played defense, our performance would be lower than it currently is (on a YTD measuring stick). Defending our capital takes work, discipline and at times, patience.
I think it’s important to note, in the last 5 months, trade and tariff rhetoric, derailed our China thesis, we are early on our newest commodity trades, our gold and precious metal portfolio has been dismantled from the strength of the dollar and cash earns very little; yet, from a total return perspective, our YTD number is positive, trailing nominally to “traditional” benchmarks (and we’ll show you below, many of the best, at times, have been in significantly worse positions)…
We have defended our downside and will continue to do so, we are following a proven treasure map (explanation below), continue to position ourselves for the next predominant trend; and we’ll show you how we expect to take advantage of it as we move forward.
Talking Quality
I want to talk quality for a moment…
Some have suggested poor performance of some names we have recently sold is a direct result of the quality of business we are investing in… I would challenge this premise with all of my being. The quality of the businesses our capital preservation strategies have triggered this quarter is nothing short of pristine. A great company doesn’t always equal positive movement in equity prices. This would mean markets are always efficient; I assure you, they are NOT. You can always revisit quality names when an uptrend returns, though we follow process, performance will follow…
In the interest of time, I will not go through every single name we’ve sold, though I will use Naspers (NPSNY) to illustrate my point. Naspers is a 100 year old company listed on the Johannesburg Stock Exchange (JSE), currently with a market cap of over $100-billion. Among other things, Naspers owns a 30% stake in Tencent (which until its recent fall from grace) was the 5th largest company by market cap in the world (likely headed for number 1 over the next few of years).
Naspers operates in more than 120 countries across the globe, over 1/5 of the worlds population uses the products and services of companies they have built, acquired or invested in. This past year, Naspers revenues were north of $20.1- billion USD (US dollars) reporting $2.5–billion in core headline earnings (USD).
They focus on “ecosystems” or technologies that deal with large scale “societal needs” in the fastest growing markets around the globe, as their head of Strategy Sebastian Vaessn recently stated in a recent presentation to investors. They own stakes in PayU (a transformative mobile payment business which processed nearly $25.5-bn in value FY2018 – a 53% increase), iFood (leading food delivery service in over 40 markets growing at nearly 65% Year over Year (YOY)), Mail.ru (Russia’s Facebook), South Africa’s leading media business, Africa’s leading entertainment business and the leading classified businesses around the world (US $628-million in revenues) to mention a mere few.
Naspers Venture Investments attracts nearly 130-Million unique monthly users in 190 different countries.
While mobile payment adoption is growing in the United States, China’s mobile payments are 50 times greater than that of the US. Naspers estimates by 2021 the global ecommerce market will be nearly $3-trillion dollars with a meager 15% penetration. By 2026 the global payment market could reach $50-trillion (with a T) and by 2027 – India will add another 400m Internet users and be the 3rd largest economy in the world with an ecommerce market estimated at over $200-billion dollars. By 2030 the global middle-class market is anticipated to move from 2-billion to 5-billion people, driven solely from emerging markets, with Asia’s share of global spending anticipated to surge from 25% to 60% by 2030. Additionally, by that time, Latin America is expected to be the 3rd largest region by population.
Should you add the sum of Naspers parts (all of their collective businesses together) – you’d reach a value of nearly $160-billion dollars (USD) from an initial investment of roughly $10-billion dollars (a 16x increase). Naspers is a multinational conglomerate, which often brings some form of discount to its “sum of the parts” valuation – its current discount of 41% is absolutely mind numbingly crazy.
Naspers has some issues, which they are addressing. Their success brings with it challenges. They have grown in size so rapidly; they have become nearly 25% of the Johannesburg Stock Exchange (JSE). This poses a unique problem for as their investments like Tencent, Upay, ifood and many other businesses continue to grow, local pension funds MUST sell their stock based upon percentage ownership restrictions. They are working on solutions to address this issue. This doesn’t make the company less valuable, it merely means at some point the discount to assessed value should narrow; the price of the stock should be reflective as this occurs. As more foreign investors learn and understand the story.
Finally, Naspers just sold their stake in Flipkart to Walmart which now gives them nearly $10-billion in cash on their balance sheet to invest in future initiatives (Reminder: $10-billion is what was initially invested to create the company currently valued at $160-billion).
Naspers reeks of quality! There is a high likelihood we will own Naspers again, and it could be soon… Though one of their major investments is a Chinese technology company (Tencent), regardless of how cheap Tencent is vs. peers, a dark cloud hangs over Chinese stocks. Warranted or not, Chinese stocks are currently “cheap and hated”. Our contrarian thesis suggests valuation might be there, but the inflection point is not currently. Cheap and hated is something we actively look for, though cheap and hated can get cheaper and more hated (which it has)… The missing ingredient, and this is key, is an uptrend(Dr. Steve Sjuggerud of Stansberry Research – is holding a webinar on October 24th @ 8:00pm. If you are not familiar with his work, you should be – you can sign up for his webinar by clicking here).
Quality isn’t the issue, “Sentiment” is. Currently, it makes more sense to wait for a confirming uptrend before we return to NPSNY. The likelihood is high this can happen very quickly, our shopping list of names we’ll want to own is ready, until then, we’ll play good defense.
Our belief is that we are setting our portfolios up to greatly exceed market returns over a full market cycle (this includes both Bull and Bear markets). Billionaires like Paul Tudor Jones and Warren Buffet have given us all a brilliant “map” to follow, the challenge lies in being disciplined enough to stay the course, we will be, the question is will you? Even the likes of Buffet have strayed at times from what has made them great investors.
This quarterly will focus on the map we have been following and how our current portfolio reflects this. We’ll also speak to the major trends we believe will allow us to not only catch up with markets, but also exceed expectations with less risk over full market cycles. Finally, we’ll further highlight what we’re doing to protect ourselves should we be wrong along the way.
Let’s play a little game!
We’ll call it… What type of investor are you?
Having the choice between the two investments listed below, which one would choose to invest your money in? Investment A or Investment B? (Hint: it’s a loaded question)…
| Investment A | $100,000.00 | Investment B | $100,000.00 | Yearly Variance (A) |
|
|
|
|
|
|
| -4.60% | $95,400.00 | 3.90% | $103,900.00 | -8.50% |
| 80.50% | $172,197.00 | 14.60% | $119,069.40 | 65.90% |
| 8.10% | $186,144.96 | 18.90% | $141,573.52 | -10.80% |
| -2.50% | $181,491.33 | -14.80% | $120,620.64 | 12.30% |
| -48.70% | $93,105.05 | -26.40% | $88,776.79 | -22.30% |
| 2.50% | $95,432.68 | 37.20% | $121,801.75 | -34.70% |
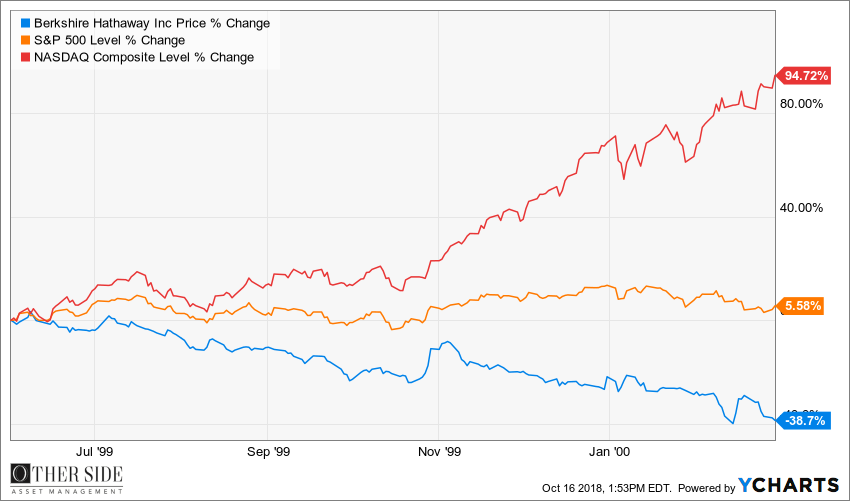
What do you think? Coin toss? Investment A, had a negative return over a 6 year period, “Investment B” appears to be a little more steady, outperforming “Investment A” 4 out of the 6 years – finishing the illustration $26,369.07 ahead of “Investment A” and $21,801.75 in the green.
What if I told you the decision was the difference between being a millionaire vs. billionaire? You’d think really long and hard, wouldn’t you?
I’ve written in great detil about a “snapshot in time” and while some may consider this example to be an extreme, I’d suggest fear (self-doubt) and discipline are the primary determining factors between a variation of this being a reality vs. pipe dream… Below we expand the illustration:
| Year | Berkshire | $100,000.00 | S&P 500 | $100,000.00 | Yearly Variance Berkshire vs. S&P 500 | Berkshire (1970) | S&P 500 (1970) |
|
|
|
|
|
|
|
|
|
| 1965 | 49.50% | $149,500.00 | 10.00% | $110,000.00 | 39.50% |
|
|
| 1966 | -3.40% | $144,417.00 | -11.70% | $97,130.00 | 8.30% |
|
|
| 1967 | 13.30% | $163,624.46 | 30.90% | $127,143.17 | -17.60% |
|
|
| 1968 | 77.80% | $290,924.29 | 11.00% | $141,128.92 | 66.80% |
|
|
| 1969 | 19.40% | $347,363.60 | -8.40% | $129,274.09 | 27.80% | $100,000.00 | $100,000.00 |
| 1970 | -4.60% | $331,384.88 | 3.90% | $134,315.78 | -8.50% | $95,400.00 | $103,900.00 |
| 1971 | 80.50% | $598,149.71 | 14.60% | $153,925.88 | 65.90% | $172,197.00 | $119,069.40 |
| 1972 | 8.10% | $646,599.83 | 18.90% | $183,017.87 | -10.80% | $186,144.96 | $141,573.52 |
| 1973 | -2.50% | $630,434.84 | -14.80% | $155,931.23 | 12.30% | $181,491.33 | $120,620.64 |
| 1974 | -48.70% | $323,413.07 | -26.40% | $114,765.38 | -22.30% | $93,105.05 | $88,776.79 |
| 1975 | 2.50% | $331,498.40 | 37.20% | $157,458.11 | -34.70% | $95,432.68 | $121,801.75 |
| 1976 | 129.30% | $760,125.83 | 23.60% | $194,618.22 | 105.70% | $218,827.14 | $150,546.97 |
| 1977 | 46.80% | $1,115,864.71 | -7.40% | $180,216.47 | 54.20% | $321,238.24 | $139,406.49 |
| 1978 | 14.50% | $1,277,665.10 | 6.40% | $191,750.33 | 8.10% | $367,817.78 | $148,328.51 |
| 1979 | 102.50% | $2,587,271.82 | 18.20% | $226,648.89 | 84.30% | $744,831.00 | $175,324.30 |
| 1980 | 32.80% | $3,435,896.97 | 32.30% | $299,856.48 | 0.50% | $989,135.57 | $231,954.04 |
| 1981 | 31.80% | $4,528,512.21 | -5.00% | $284,863.65 | 36.80% | $1,303,680.68 | $220,356.34 |
| 1982 | 38.40% | $6,267,460.90 | 21.40% | $345,824.47 | 17.00% | $1,804,294.07 | $267,512.60 |
| 1983 | 69.00% | $10,592,008.92 | 22.40% | $423,289.16 | 46.60% | $3,049,256.97 | $327,435.42 |
| 1984 | -2.70% | $10,306,024.68 | 6.10% | $449,109.80 | -8.80% | $2,966,927.03 | $347,408.98 |
| 1985 | 93.70% | $19,962,769.81 | 31.60% | $591,028.49 | 62.10% | $5,746,937.67 | $457,190.22 |
| 1986 | 14.20% | $22,797,483.13 | 18.60% | $700,959.79 | -4.40% | $6,563,002.82 | $542,227.60 |
| 1987 | 4.60% | $23,846,167.35 | 5.10% | $736,708.74 | -0.50% | $6,864,900.94 | $569,881.21 |
| 1988 | 59.30% | $37,986,944.59 | 16.60% | $859,002.39 | 42.70% | $10,935,787.21 | $664,481.49 |
| 1989 | 84.60% | $70,123,899.71 | 31.70% | $1,131,306.15 | 52.90% | $20,187,463.18 | $875,122.12 |
| 1990 | -23.10% | $53,925,278.88 | -3.10% | $1,096,235.66 | -20.00% | $15,524,159.19 | $847,993.33 |
| 1991 | 35.60% | $73,122,678.16 | 30.50% | $1,430,587.53 | 5.10% | $21,050,759.86 | $1,106,631.30 |
| 1992 | 29.80% | $94,913,236.25 | 7.60% | $1,539,312.19 | 22.20% | $27,323,886.29 | $1,190,735.28 |
| 1993 | 38.90% | $131,834,485.15 | 10.10% | $1,694,782.72 | 28.80% | $37,952,878.06 | $1,310,999.54 |
| 1994 | 25.00% | $164,793,106.43 | 1.30% | $1,716,814.89 | 23.70% | $47,441,097.58 | $1,328,042.53 |
| 1995 | 57.40% | $259,384,349.53 | 37.60% | $2,362,337.29 | 19.80% | $74,672,287.59 | $1,827,386.53 |
| 1996 | 6.20% | $275,466,179.20 | 23.00% | $2,905,674.87 | -16.80% | $79,301,969.42 | $2,247,685.43 |
| 1997 | 34.90% | $371,603,875.74 | 33.40% | $3,876,170.28 | 1.50% | $106,978,356.74 | $2,998,412.36 |
| 1998 | 52.20% | $565,581,098.87 | 28.60% | $4,984,754.98 | 23.60% | $162,821,058.96 | $3,855,958.29 |
| 1999 | -19.90% | $453,030,460.20 | 21.00% | $6,031,553.52 | -40.90% | $130,419,668.23 | $4,665,709.53 |
| 2000 | 26.60% | $573,536,562.61 | -9.10% | $5,482,682.15 | 35.70% | $165,111,299.98 | $4,241,129.97 |
| 2001 | 6.50% | $610,816,439.18 | -11.90% | $4,830,242.97 | 18.40% | $175,843,534.48 | $3,736,435.50 |
| 2002 | -3.80% | $587,605,414.49 | -22.10% | $3,762,759.28 | 18.30% | $169,161,480.17 | $2,910,683.25 |
| 2003 | 15.80% | $680,447,069.98 | 28.70% | $4,842,671.19 | -12.90% | $195,888,994.03 | $3,746,049.35 |
| 2004 | 4.30% | $709,706,293.99 | 10.90% | $5,370,522.35 | -6.60% | $204,312,220.78 | $4,154,368.73 |
| 2005 | 0.80% | $715,383,944.34 | 4.90% | $5,633,677.94 | -4.10% | $205,946,718.54 | $4,357,932.80 |
| 2006 | 24.10% | $887,791,474.93 | 15.80% | $6,523,799.06 | 8.30% | $255,579,877.71 | $5,046,486.18 |
| 2007 | 28.70% | $1,142,587,628.23 | 5.50% | $6,882,608.01 | 23.20% | $328,931,302.61 | $5,324,042.92 |
| 2008 | -31.80% | $779,244,762.46 | -37.00% | $4,336,043.04 | 5.20% | $224,331,148.38 | $3,354,147.04 |
| 2009 | 2.70% | $800,284,371.04 | 26.50% | $5,485,094.45 | -23.80% | $230,388,089.39 | $4,242,996.00 |
| 2010 | 21.40% | $971,545,226.44 | 15.10% | $6,313,343.71 | 6.30% | $279,691,140.52 | $4,883,688.40 |
| 2011 | -4.70% | $925,882,600.80 | 2.10% | $6,445,923.93 | -6.80% | $266,545,656.91 | $4,986,245.86 |
| 2012 | 16.80% | $1,081,430,877.74 | 16.00% | $7,477,271.76 | 0.80% | $311,325,327.28 | $5,784,045.19 |
| 2013 | 32.70% | $1,435,058,774.76 | 32.40% | $9,899,907.81 | 0.30% | $413,128,709.29 | $7,658,075.83 |
| 2014 | 27.00% | $1,822,524,643.94 | 13.70% | $11,256,195.18 | 13.30% | $524,673,460.80 | $8,707,232.22 |
| 2015 | -12.50% | $1,594,709,063.45 | 1.40% | $11,413,781.91 | -13.90% | $459,089,278.20 | $8,829,133.48 |
| 2016 | 23.40% | $1,967,870,984.29 | 12.00% | $12,783,435.74 | 11.40% | $566,516,169.30 | $9,888,629.49 |
| 2017 | 21.90% | $2,398,834,729.85 | 21.80% | $15,570,224.74 | 0.10% | $690,583,210.38 | $12,044,350.72 |
| 20181 | ??? |
|
|
|
|
|
|
As you can see, $100,000 invested in “Investment A” (Berkshire Hathaway) in 1970 would have yielded you $690,583,210.38 at the end of 2017, while $100,000 invested in “Investment B” (S&P 500) at the same time would have yielded you $12,044,350.72. Making investment decisions based upon this particular snapshot in time would have been the difference between you being a “rounding error” or worth hundreds of millions to billions. Short-term thinking is how most people invest (both individuals as well as professionals).
Combining emotions with the glorification of television personalities like Jim Cramer and shows like “Fast Money” makes it challenging for individual investors to maintain faith in a manager and discipline. We would urge investors to step away from the shorter term myopic mindset and look to those managers who focus on growing value over full market cycles.
**Note: Last quarter we noted Buffet’s drastic departure from his historical style of investing in capital light (efficient) businesses is likely to drag significantly on Berkshire’s forward earnings potential. While it’s nice to see Buffet significantly increasing Berkshire’s position in AAPL, reminiscent of his proven, old school model, only time will tell how their large investment in regulated utilities as well as BNSF will affect future returns. Our guess is until those albatrosses are lifter; a strong headwind will exist? When the facts change, we’ll revisit our opinion, until then, our opinion will have to wait on father time.
X marks the spot…
Just follow the map.
Imagine for a moment you knew a treasure map existed, you knew it was old, but in pretty good condition. Parts of the map were rubbed out, but there were plenty of clues allowing you to fill in the missing pieces. You could follow this map alone, or you bring a guide along with you? The guide may have a little more experience reading a map like this. There may be value in a guide who points out that a new bridge was built from the time this map was created allowing you to reach the same destination, yet possibly avoid potentially catastrophic terrain. The only “catch” required to reach the treasure was the DISCIPLINE to stay the course over a period of time… You and your guide will keep each other honest along the way – making sure you stay the course.
Now imagine this map was in your grasp… and you could start following it today.
Exploiting an industry…
Anyone who receives a paycheck from a payroll company likely understands what “float” is. It’s the length of time between when a company funds a payroll company (say ADP) vs. when ADP funds your personal bank account. As you wait for your money to clear your bank account, ADP is “floating” your money, earning interest on it. Given the recent rise in interest rates, some estimate it could generate hundreds of millions of dollars for a payroll company like ADP’s bottom line. “Float” is a powerful concept.
In 1967 Warren Buffet bought National Indemnity for roughly $10,000,000 and instantly had nearly $20,000,000 to invest due to the “float” the Property & Casualty (P&C) Insurance Company had at its disposal. In the property and casualty world, “float” is the difference between the premiums clients pay vs. the money that’s paid out in damages. A well-run P&C insurance company can generate absurd amounts of float – ladies and gentlemen, Warren Buffet had found “cheap leverage” and he’s exploited this industry for decades.
Warren Buffet’s brilliance is in his simplicity and discipline. Start with buying high quality Property and Casualty insurance companies (National Indemnity was his first) to gain access to their “float” providing him with tremendous level of cheap leverage. He then sought out businesses, which required very little capital to maintain and further grow their businesses. He then used float or subscription based businesses that provided him up front capital to run day-to-day operations (which was less he needed to borrow), companies such as American Express or The New York Times (think pre-internet). He also focused on businesses with absurd amounts of goodwill (not in “economic” terms), but think increased value based upon people either willing to come back over and over again or pay more for a product or service (a brand name that people flock to like Disney or Coca-Cola). Finally, he stuck with his convictions…
He often took concentrated positions like in 1964 when he placed nearly 25% of his investable dollars into a struggling American Express (AXP) after a “vegetable oil” scandal cost AXP nearly $60 million dollars due to a $150 million dollar fraud at a subsidiary company (Allied Crude Vegetable Oil Refining in Bayonne, NJ). Buffet continued to add to his partnerships position over that year making it (and a failing textile company, Berkshire Hathaway) at the time, nearly 50% of his holdings. You can read about it in the book, Buffett, The Making of an American Capitalist by Roger Lowenstein; Chapter 5.
Larger concentrated positions are not foreign to Buffet, for in 1987/1988 he placed roughly 25% of Berkshires book value into Coca-Cola, while later, AXP, KO and Gillette accounted for nearly 50% of his public portfolio (though he owned significantly more separate business entities at the time). What do you think would happen if your manager placed 50% of your assets in 3 names?
Learning from others shortcomings…
For as brilliant as they are, there are things that both Buffet and partner, Munger have admittedly wished they’d done differently. Buffet is on record as saying, “Never invest in a business you cannot understand”. This was the primary reason he had kept Berkshire from investing in technology companies. In 2017 they talked about these mistakes and having all the opportunity to ask as many questions as they could to understand companies like Google or Amazon, but they didn’t.
“I had plenty of ways to ask questions or anything of the sort and educate myself, but I blew it,” Buffett said of Google at the 2017 Berkshire meeting.
Munger followed up by saying:
“I think we were smart enough to figure out Google—those ads worked so much better in the early days than anything else—so I would say that we failed you there,” Munger said. “We were smart enough to do it, and we didn’t do it.”
Could they not understand or did they choose to not even try? They were poor at recognizing and capitalizing on massive societal shifts (Naspers (NPSNY) is excellent at it) or trends from a technological standpoint, and while you’ve read the quotes above, you needn’t look any further than their investment in a dying technology in IBM coming out of the financial crisis of 2007-2009, passing up on an emerging technology in an already established AAPL (which took them until 2016 to buy).
No one is going to recognize every trend; my point is less about them failing to understand a single new technology or trend, but failing to try. It’s also an example as to how a value trap can “trap” even the best of investors. IBM was cheap; it was a “value”, with good reason. We understand; having been caught with a dying GE (we thought their new technologies would carry them, we were clearly wrong). Here’s the difference; in an effort to learn from other greats like Paul Tudor Jones, our capital preservation strategies protected us from what has turned into a debacle for GE shareholders who have held their positions on the recommendations of much of mainstream Wall Street – we lost roughly 10% – those who have hung on are down over 60%. We need to make up a rough 11% on that position, those who held on need to make up over 150% simply to break even.
Additionally, and more importantly, for a guy who’s been quoted as saying, “Rule #1 – Don’t lose money. Rule #2 – Don’t forget rule #1” – Buffet has had his fair share of significant drawdowns and underperformance (33% of the time he has lagged the S&P (17 out of 53 years) with 11 negative years). Did you know there was a time in the last 20 years Berkshire underperformed both the Nasdaq and S&P 500 by over 133% and 44% respectively (over a span of 9-months)?
AND STILL, HE HAS CRUSHED THE S&P OVER DECADES!
At the time, Buffet didn’t flinch, he understands reversion to the mean and the power of free cash flow, though, he could have easily had a percentage of his public holdings in innovative and emerging technologies; attaching capital preservation strategies to each “publicly traded, liquid” name. He could have done this with a nominal percentage of his capital, protected his downside and shifted the cash raised from sales his capital preservation strategies triggered into the next predominant trend (as Paul Tudor Jones speaks of).
The most successful people this world has ever seen have all failed at some point in their lives. Wilt Chamberlain couldn’t shoot free throws if his life depended on it (with the exception of one specific year – and we will talk about this at great length in a different note – one of my favorite stories of all time). Lawrence Taylor, Tiger Woods, Steve Jobs, Walt Disney, Dr. Suess, Einstein and Edison, all greats in their own respective fields; they all had shortcomings of sorts – they all failed countless times before becoming great. Additionally, once considered innovators by the masses, they by no means were perfect, they still made questionable decisions at times.
I grew up in the school of football. There is a stigma around football that those who play may not be as intelligent as other individuals; I would disagree. The biggest, fastest, strongest team isn’t always the team that wins. It’s often the most disciplined team who can outthink and adjust quickly on their feet. Lombardi, Parcells, Belichick, Ditka didn’t game plan their Super bowls as they did the first game of the season. They would extensively study film on every player that could possibly be on the field. They knew the capabilities, strengths and weaknesses of both the opposing team as well as their own. They studied the sidelines, hand signals, weight disbursement of an offensive lineman, how much pressure a lineman placed on his knuckles, was a “tell” for whether he was going to explode off the ball (run block) or kick slide into a pass block. They studied every single possible angle looking to exploit a weakness or gain an edge somewhere, somehow…
When evaluating myself, I attempt to be as objective and critical as I possibly can; I will be more harsh a critic of myself than anyone else will be. I will always do my best to understand and acknowledge my strengths and more importantly, my weaknesses in an effort to not replicate previous mistakes. If I am studying someone like Mr. Buffet, I am going to do the same exact thing. It’s not done in a derogatory manner, it’s more so a sign of respect. This brilliant man has given anyone willing to study him a treasure map to succeed. While we can’t buy P&C insurance companies outright, we can look to invest in the best P&C companies trading at a discount to their float; we can look to emulate his successes while utilizing strategies he didn’t use; emulating other billionaire investors who have built their careers off of protecting their capital like Paul Tudor Jones (and his sell strategies, said differently, his capital preservation strategy)
Our Homage to Mr. Buffet…
Our model is anchored with 4 pristine P&C insurance companies, and while we may have to deal with some irrational price movement during hurricane season, these are some of the very best businesses in the world providing us with cash to plow back into the model via fantastic dividend growth; American Financial, Axis, Travelers & W.R. Berkley.
We then turn to what we would consider to be tremendously well-run businesses. Some would be considered Capital Efficient, others you might call World Dominators (many are both). Businesses like Apple, American Express, Boeing, Blackstone, Disney, 3-M, and Microsoft. Two of our more recent purchases, Coke and Starbucks come to us at extremely reasonable valuations having recently sold off.
Defense spending is currently an astronomical portion of the US governments budget and projected to be even greater over the next decade, enter the best of breed (Northrop Grumman, Lockheed Martin and Raytheon (Boeing would overlap this category as commercial airplanes are only a fraction of their business)).
The aforementioned names are some of the absolute best businesses in the world – yet have lagged over the past four months as small cap names had been leading markets higher. These companies are not of poor quality, they are pristine, high quality, steady growers.
So where do we go from there? Can we learning from Buffet’s shortcomings?
Innovative Technologies:
What new technologies or innovations are going to change the world? What about the speed at which we communicate? 5G technology is coming whether we like it or not and Qualcomm (QCOM) has quickly become the emerging leader in this space.
It seems as if we’re hearing about a major computer hack or data breach weekly these days. Big time hackers aren’t focused on mom & pop anymore; it’s estimated ransomware software cost corporations nearly $9-billion dollars across 150 countries in 2016 &17. Hacking is serious business and major corporations are now fearful of HACKERS. Hackers shut down shipping giant Maersk in June of 2017 costing them an estimated $300-million dollar. The solution? Splunk – the emerging leader in Internet security offering the full gambit of services in this space. SPLK technology could have prevented Maersk’s hack. My bet is more companies will be seeking out the services of SPLK, the possibility also exists for a larger company, either already involved in the Internet security space or one looking to enter the space to acquire them.
As mentioned earlier, military spending is drastically increasing and much of this money will go to the most technologically advanced products being developed. The most advanced stealth bomber on earth is nearly completed. The very same company completing the newest, most sophisticated B21 stealth bomber, recently purchased a smaller satellite technology company Orbital/ATK, which now gives this company a revenue stream from satellite launch technology in addition to the new B21 stealth bomber.
We believe the B21 is in the “critical design review” stage. The US air force can’t place a buy order of any product while still in review, however, as soon as the engineering passes “critical design review” our belief is the air force would like to order 224 aircraft at $664,000,000 each. Northrop Grumman is the owner of both of these cutting edge technologies and with no current orders from the air force – none of this revenue exists on NOC’s books or in their backlog.
We believe the B21 needs to pass a single engineering test, which could potentially make NOC as big as LMT and BA? Given NOC’s recent sell off, we don’t believe many are paying attention; Additionally, NOC has been paid nearly $3-billion to design this plane – you don’t scrap a project after shelling out $3-billion, if there is a delay, you foster it.
We own these innovative companies, the P&C companies, the Capital Efficient companies, the World dominators; these are our core holdings. They are pristine and yet, we are underperforming… Many of them gush Free Cash Flow (FCF); those in growth phases like SPLK are growing exponentially Year over Year (YOY)…
So what else do we own and why?
There isn’t a person out there who read these who isn’t aware of my belief that we are in the late stages of a bull market. We have detailed characteristics of late stage bull markets for well over a year along with two of the primary traits being EXTREME VOLATILITY and a BLOW OFF TOP. I think it would be fair to say we warned of the volatility well before it arrived and while some may not want to hear this, my belief is what we are witnessing today is mild in comparison to what the foreseeable future will likely bring; this volatility is to be expected.
Though, there are some sectors, which tend to reap more benefits than others during late stage bull markets, those being where the major innovation typically occurs. I’m speaking of technology and biotechnology. From a Biotechnology standpoint, many of these names are difficult to pick individually; thus we have bought two equity ETFs dialed in on the most prominent Biotech and Healthcare names (BIB and RXL). We are currently technology “light” at this moment in time, largely in part to our China thesis as you know our feelings on Chinese technology names relative to US tech and as you know, we have closed many of these positions based upon sticking with our capital preservation strategies. We continue to gain exposure to the tech space via our ownership stakes in Apple, MercadoLibre and Shopify. Both, Splunk and Qualcomm would fall into the communications/technology space, which overlaps above with emerging innovations. We’ll continue to add to this space as opportunities present themselves.
Income:
Our core P&C insurance companies provide solid dividends along with a few additional holdings, though we hold 3 names specifically which pay us a yield in excess of 10%, those being CenturyLink (CTL) (which overlaps in the communication/technology sector) CSI Compressco (CCLP) (which we’ll discuss further below) and Blackstone Mortgage (BXMT). While our goal is not “income” the 10-12% dividend yields plus some growth have been welcome additions to the portfolio.
Special Situations:
We maintain a relatively small position in sports apparel company, Under Armor (UA). We feel as if their fall from grace has simply been too far too fast, an unwarranted and elevated short position. Their growth mirrors that of Nike in their infancy, that’s not bad company to be in.
Now, this is where it gets really interesting…
We have additional holdings in the portfolio I have yet to mention. These are names that revolve around large thematic trends we believe have the potential to provide significant alpha to the portfolio… These investments are at times, considered “contrarian”, meaning against conventional wisdom or mainstream beliefs. We briefly touched on this above; however, these are investments in individual companies or sectors that are often CHEAP & HATED.
Though as discussed above, when making a contrarian investment, in simply looking at a company that’s sold off 50% +, suggesting it’ a buy because it’s cheap without looking at the underlying business is reckless… I was lucky enough to watch a recent presentation by a well renowned value investor, Whitney Tilson of Kase learning… He briefly mentioned four common mistakes value investors often fall victim to:
The first being so focused on finding “cheap” names, this, at times, led him to invest in low quality businesses whose fundamentals were in decline (hence, why they were cheap to begin with – the quintessential “value trap”). Number 2, he failed to buy high-quality businesses whose stocks were “more expensive”, (again, these companies trade as they do for a reason – they are high quality steady deliverers of earnings and dividend growth (a Hershey’s may fall into this category – great Free Cash Flow, very capital efficient and constantly increasing their dividend). Tilson then mentioned selling tremendous companies way too early because they no longer looked “cheap” from a valuation standpoint and finally, similar to Buffet (as discussed above) in Tilson’s own words, “failing to understand/appreciate powerful new technologies/trends”.
We’d like to think our methodology and model attacks these mistakes at their core, I’d like to dedicate the majority of this section to number 1 so let’s clear 2-4 out of the way first. While we’re not infallible, we actively and aggressively look for high-quality businesses that steadily increase revenue, free cash flow and dividends. These are core companies of our model. If we have the ability to pick them up more cheaply as we feel we’ve recently done with Starbucks (SBUX) and Coke (KO), it’s a bonus. Our sell strategy is based around our capital preservations strategies. Our primary goal is to allow winners to run further than we think while cutting losers before becoming problematic.
“But at the end of the day, markets will always be driven by greed and fear, valuations will always swing from too cheap to too dear” Paul Tudor Jones, page 403
Whether we want to believe it or not, markets are often driven by emotions… Euphoria sends stocks higher than fundamentals support, while pessimism and fear will send stocks and sectors well below what the fundamentals support. Our strategy allows capturing much of the euphoria and mitigating the extreme loss.
Tilson’s 4th point was something we addressed above, as with many value investors, Buffet included, they are often very poor at identifying large tectonic shifts in new technologies or trends. We’ve carved out a portion of our portfolios to focus on companies which have a high probability of becoming the leading innovator, primary beneficiary or game changer of a respective technology or sector; this could be in the field of robots performing heart surgery, AI learning, 5G technology, gaming (Tencent), VC (Naspers), etc…
I would like to speak to Tilson’s first point in a little greater depth, but first I think it’s important to make this point. We’ve been running our primary portfolio for nearly 2 ½ years and as mentioned, until the last 4 months, we’ve outperformed with significantly less volatility and tremendous amounts of cash on hand. We’ve taken the best of Buffet (P&C insurance companies, World Dominators gushing free cash flow, while having significant good will), we’ve looked to avoid his shortcomings (we actively look for innovation). We’ve pulled gems from Paul Tudor Jones (as protecting and defending our downside is our life’s blood). Most importantly, we’ve stuck to our discipline, maintaining process over performance, as we know everything moves in cycles.
After detailing the 4 most common mistakes “Value investors” make, Tilson detailed the 4 most common mistakes “Growth investors” often make. He made it clear, while he’s not abandoning the aspects of being a value guy; he now combines the best aspects of Value and Growth investing to maximize his returns as a “MAKE MONEY” investor.
It’s what we’ve done from the onset of our discretionary models.
He highlights the key to buying value is finding, what he calls, “the inflection point” where a company sells off more than it should and a catalyst exists to get the stock price moving higher again (which sounds borderline “contrarian” gasp – cheap, hated, UPTREND)
What I didn’t hear him say… Is anything about preservation of capital? I didn’t hear him discuss protecting and defending downside. He’s a tremendously intelligent man, and just because I didn’t hear him say anything about it, doesn’t mean he doesn’t use capital preservation strategies, but very few do…
Our goal is to make money, not just mirror indices, whether value – growth – contrarian – trend – capital preservation – we use a disciplined combination of all of the above to make money and mitigate loss…
Commodities:
Dr. Steve Sjuggerud is a terrific investor, he’s earned nearly 18% per year for the last 20 years; nearly double the S&P 500 average return over the same timeframe. I have never seen anyone better at spotting long-term thematic trends than Dr. Sjuggerud. He bases his contrarian calls on 3 rules – Cheap, Hated & in an Uptrend (the uptrend being most important in my opinion, no one wants to catch a falling knife). Placing history on his side, as well as utilizing numerous sentiment readings including but not limited to the Commitment of Traders report (COT report), his work is read by many of the top hedge fund managers, though is priced reasonably enough for individual investors to afford. I suggest those interested in investing become familiar with Sjugg… click the link above and watch his webinar on the 24th, you won’t be let down.
Those of you in our model know we had entered a handful of commodity names back in September of 2017, adding more to the portfolio this June and most recently, September 2018. Recently, Steve released a very bullish call on commodities; it feels good to know our thoughts are aligned. As I mentioned in our Q2 note – we were likely a little early, but I believe we’re on the right side of this trade and we’re in very good company with Dr. Steve Sjuggerud.
But why commodities, why now?
There aren’t many things you can purchase TODAY at 1990’s prices. The high on the DOW back in 1990 was 3,000, the median price of a house was around $149,800.00 (today it’s more than $300k), a gallon of milk was around $2.78, regular gas was roughly $1.16, a dozen eggs was $1.00.
Prices are up in nearly every asset class… Art has skyrocketed, wine, stamps, the S&P was around 400.
There is, however, one asset class that is currently trading at 1990’s prices, commodities. Commodities are typically cyclical investments, generally boom or bust, when they boom, they really boom – and when they bust, it can get ugly. Previous commodity booms, have minted wealth for those invested in many of the best of breed companies that have soared by 800%, 1,000% even 1,500%.
There’s a catch… As mentioned above – while these cycles often bring with them tremendous returns, the busts can wipe out fortunes faster then you can blink. The last commodity cycle topped in 2008 falling 80% plus over the following 8 years. You can’t “marry” these companies – they should be considered rentals… That’s not to say you can’t rent them for the for an extended stay, but if you invest in these companies without a well designed, thought out sell strategy – your portfolio is likely to feel the painful effects.
At this moment in time, commodities, without question, would fall into that “cheap and hated” category we often look for. But remember, there is an additional characteristic we want to see before we take a position, and that my friend is an “Uptrend”. While an uptrend doesn’t guarantee our success, history has proven time and time again that it greatly increases our chances at success.
After falling for 8 years, commodities began a stealthy uptrend in 2016 that has gone largely un-noticed by the masses. Even with their recent decline, commodities currently remain in an uptrend, having just held long term support. Most fund managers have yet to return to the space, but our guess is they will… and we’re positioning ourselves for this move.
A simple Google search defines Contrarian as “a person who opposes or rejects popular opinion, especially in stock exchange dealings” or “opposing or rejecting popular opinion; going against current practice”… This is where we were back in 4Q2016 buying Chinese local A shares while the majority were saying no way. Admittedly, we were a little early then; we may be early again, but this is where our focus turns to position sizing and asymmetrical investments.
Those investments, which represent a smaller portion of assets, yet have the ability to bring outsized returns. Our commodity portfolio holds companies like EOG resources who has one of the lowest costs in the oil and gas industry in price it costs to produce a barrel. Cheniere energy who is the first exporter of LNG from the United States, Viper Energy Partners (VNOM), set up to capture a lion share of business from the Texas shale play (expected to bring us to #2 behind the Saudi’s from an oil production stance in the next few years). Masters of the Universe (as coined by Steve Sjuggerud) like Freeport McMoRan, Rio Tinto and Range Resources.
We have outlined our core holdings above; you can see where we’ve positioned the majority of our assets. This is the difference between buying what everyone else is buying in following the herd and stepping away from the crowd (with capital preservation strategies in place).
These are some of the cheapest assets available to invest in at this moment in time and while not the “predominant trend” it’s an uptrend that until a recent pullback was outperforming the FAANG stocks. Think about that for a second. An uptrend that virtually no one is speaking about, in arguably the cheapest sector in the investing space at this moment in time, trading at 1990 prices and by money flows, you can see most asset managers haven’t returned to the sector.
We’ve said it before, cheap and hated are likely to become cheaper and more hated. I believe we are at an extreme, an inflection point, if you will. We are cheap, hated but at the same time, in a steady uptrend and have been for nearly two years. I don’t think we’ve seen anything just yet. Fireworks will come to this sector before it’s all said and done. If you’re building out infrastructure, you need iron, steel, copper, concrete, metals, ferroalloys and the list goes on, you need these commodities.
Gold/Precious metals:
Gold and precious metals are of course commodities, though they fall into their own category. For centuries, gold and silver have been a storage of “Value” (another form of catastrophe insurance). We have always owned some form of gold in the portfolio – we had reduced our exposure to the sector over the past 6-8 months given the strength of the dollar vs. that of other currencies. Trade war and tariff talk have been bullish for the dollar, as China has been weakening the Yuan to remain competitive. This has brought weakness to these metals, but we believe that’s been changing as of late.
As interest rates rise and inflation threatens, gold is becoming more appealing. Additionally, like many other commodities, gold hasn’t been this “hated” in nearly 17-years – it’s cheap and recently bounced off long-term support (uptrend) and we currently own a basket of 5 of the best names in the industry (including royalty companies which take less risk as they aren’t mining).
One way to take advantage of the next Credit Default Cycle:
You’ve heard me talk about the next credit default cycle – ad nauseam. I wrote a special note in Q1 regarding my thoughts as to how it is likely to happen, with both the carnage and opportunity laying in the BBB tranches as a greater than anticipated number of fallen angels cross the dreaded “Bank Investment Grade/Junk (High-yield)” barrier. While my belief is we will have an opportunity to reap the benefits in being prepared for a scenario as described above, there is one manager on Wall Street who is arguably the best and that’s Howard Marks, Founder of Oaktree Capital. As equities were getting hammered during the financial crisis of 2007-2009, Howard Marks was raising and deploying capital in distressed debt. His ability to navigate distressed debt is unparalleled. We don’t know when this will happen, though current credit quality suggests it’s likely to, it makes sense to own OAK, for now…
Hurricane Florence…
I’m going to finish up telling you a recent personal story I experienced during Hurricane Florence. While I’ve made this the last section of the quarterly, its message may be the most important for investors to understand.
Raleigh, NC is where we call home. In my mere mention of this you understand our communities along with surrounding areas were recently adversely affected by Hurricane Florence (some areas fared MUCH worse than others), though, for days, the massive storm system crossed the Atlantic giving residents time to prepare.
Before moving on – I wanted to say Thank You… To each and every one of you who reached out to make sure we were safe. The outpouring of concern was overwhelming. We have a tremendously kind client base… It does not go unnoticed.
So, with the sun shining and temperatures in the high 80’s to low 90’s, residents inland (here in the Raleigh area) cleared grocery store shelves of water, bread, milk and other necessities; while every Home Depot, Lowes and electrical supply within miles (I visited many) were out of generators, breakers, supply lines, etc.
I’m a fairly OCD guy. The same guy who has preached to you all like a broken record:
“You don’t buy hurricane insurance while you’re staring down a category 5 storm – you buy it when seas are calm and skies are blue”
How’s this for irony?! If I’ve said it once, I’ve used the analogy 1,000 times in describing ways to protect and preserve capital.
For as often as I talk about this, one would think that I would have been completely prepared for this storm, I wasn’t…
I ran my generator nearly a week in advance, purchased over 35-gallons of drinking water; my bathtubs and “water-bricks” were filled with additional water for cooking and flushing toilets (just in case). We had over 30-gallons of gas (much of it non-ethanol as it’s better for generator engines and carburetors) and “sea-foam” fuel stabilizer on hand for the ethanol gas that would be running through my generator in case of the possible emergency.
Given what I know I had on hand, followed by a few days of preparing I thought I had everything under control, until… I carried the oversized extension cord necessary to run power from the generator to our home, from the utility closet to my generator… My heart sank; I knew I was in a tough spot.
Sparing you a long dissertation on how to backfeed an electrical panel with power from a generator, just know, there are a few ways to skin this cat… The method I used in the past was to run the long extension cord from the generator directly into my electrical sub-panel, back feeding our system via hard-wiring breakers; this requires you to be familiar with wiring, installing and grounding properly sized breakers into your subpanel without electrocuting yourself; you need the proper tools on hand as you are often doing this in the dark (headlamp if you were curious). In the past, this was an easy solution for me; I would run my generator outside on the back patio, snaking the power cable through a slightly cracked window it was easy to feed into the sub-panel by passing the long cord through unfinished walls.
And there it was… During all of my preparation, it hadn’t even crossed my mind. In bringing Other Side Asset Management to life, we recently renovated nearly 1,000 square feet. Having just finished the new office, walls which were once “unfinished” are now finished, making the journey to the subpanel an additional 30’ away; which would require about 20’ of additional cord (which I didn’t have). This is not a simple extension cord; the gauge of this wire is either a 6 or 8 gauge vs. the typical 16 or 12 gauge extension cords.
The easiest solution to our now dilemma would be to backfeed the subpanel via our electrical dryer plug, problem solved, right? (While this may sound complicated, it’s nothing more than making a connection from the running generator to the dryer plug in the wall via a very large, thick-gauged extension cord). This extension cord would have a 4-prong male (twist-lock) on one end (the twist lock preventing the cord from vibrating out of the running generator); the other end of the extension cord would require a 4-prong male dryer plug with an L blade.
Herein was my problem.
Since back-feeding a subpanel via the dryer plug is the easiest solution to powering a home that has lost power, everyone who was unprepared now made acquiring this plug a priority – and since I didn’t recognize my deficiency until Tuesday (two days before the storm was to make landfall), I was in essence, caught with my pants down, being 2-3 days behind in searching for this now, highly sought after part, that the rest of all North Carolinians with a generator (or who was lucky enough to just buy a generator) was looking for. I searched high and low – visited countless stores, calling nearly a dozen locations to no avail – every local Home Depot, Lowes and electrical supply was out.
In an effort to think a little outside of the box, I called some friends in NJ thinking they wouldn’t have the demand for this piece in a location not affected by the storm, and I was right, my father-in-law found the part on his first stop and was kind enough to find the part I was looking for. Roughly $25.00 for the part and $71.00 in priority overnight shipping expense; peace of mind was on its way…
Problem solved, right? Wrong… UPS failed to deliver the item as promised citing “weather in the area” as their reasoning.
Again, this is NOT an expensive part; it’s maybe $20.00 – $30.00 depending on where you find it and yet, this single part was the difference of what could have been thousands of dollars of damage or losses had this storm hit us as initially forecasted. After hours of driving and countless calls outside of the Raleigh area, I was lucky enough to acquire the elusive dryer plug.
While Florence hit Raleigh with significant wind gusts, rain, flooding and power outages, the damage we felt pales in comparison to North Carolina’s coastal communities. As luck would have it, the tremendously large storm system, which at one point was expected to be a direct hit to the heart of Raleigh, literally circled around us. Outside of a few trees, which snapped in half in the wooded lot behind our home, coupled with some flickering lights, our power never cut out completely – our generator was never needed.
I began writing this as Hurricane Florence hovered over our home. While sparing most of Raleigh, it left a wake of devastation and destruction through coastal Carolina.
I can’t help but to draw numerous parallels and analogies to our current investing environment and where we sit without current models.
I was not as prepared for this storm, as I should have been. Yes, I was able to secure my family drinking water – at 6:00am. The Harris Teeter delivery truck has just dropped 10 pallets of bottled water and I got some of the very last cases… again, at 6:00am, not your typical peak shopping time, I was lucky. I was prepared with 10-gallons of gas, but the additional 20-gallons came while waiting in a 45 minute line after visiting 4 gas stations which were all entirely out of gas.
Then came my wild goose chase in an effort to find a $26.00 male plug. Please, if you remember anything from this section it’s this; finding this plug, under normal circumstances is tremendously easy. It wasn’t until the system became stressed; this plug became one of the most highly sought after, coveted items to those in the path of the storm.
Do you get it? Do you now understand how this story correlates to investing?
When people have the ability to accomplish ordinary tasks on their own time, all markets tend to function as we’re accustom to. In developed countries like ours we’ve become accustomed to retailers, supply houses and supermarkets having shelved stocked in abundance. We’ve become spoiled with next day deliveries guaranteed by 10:00am. Amazon now has led us to believe we could have items on our doorstep within hours…
This is our new societal “normal” or “business as usual”.
Though, what most seem to forget is that there is NOTHING “normal” about a crisis! NOTHING…
While devastating to some areas, Florence was a relatively weak storm for the Raleigh area and yet, shelves were barren, essential supplies were tremendously limited. The supply chain failed, as logistics experts couldn’t get ordinarily simple deliveries fulfilled.
Similar rules apply in all financial markets, (stocks, bonds, currency, options, futures, real estate markets – you pick the market). When these markets are functioning “normally”, buying and selling all aforementioned (less real estate) is a relatively simple task, with a few mouse clicks or call to your broker, buying and selling millions to billions of dollars in securities can typically be accomplished within seconds (predicated upon historical volatilities). When credit markets are working properly, confidence exists in our banking system giving businesses access to capital required and necessary to operate as “usual”.
However, as mentioned above, during times of crisis, nothing functions “normally”. Bids shrink and drop precipitously as spreads widen and markets become extremely inefficient.
Think about this question for a minute – what bond dealer wants to buy a bond for their inventory as prices are plummeting? What bond trader wants to see their P&L (Profit & Loss statement) to look like it’s hemorrhaging capital? (Hint: None that want to keep their job)
One of the many challenges presented in a time of crisis is most investment firms go into self-preservation mode. They become more concerned with protecting themselves than those whom they pretend to represent. They thin their inventories, selling what is arguably worthless paper to unsuspecting investors while propping up prices as much as possible until they are flat.
From 2007-2009, confidence was shaken; “counter-party risk” became a mainstream phrase and real fear. Financial institutions didn’t feel comfortable doing business with each other. When firms like Goldman and JP Morgan didn’t feel comfortable doing business with Lehman brothers or Bear Sterns, shockwaves were sent through the entire financial system.
There is part of this story I haven’t told you, and it’s an extremely important to this entire discussion… There were two things I mentioned above personal in nature; you may have picked up on them, maybe not? 1. I stated, there are a few ways to skin this cat and more importantly, 2. I am fairly OCD… Let me explain…
While each and every store I visited and called was out of the individual part to properly execute on creating the long extension cord I’ve described (the easy solution), EVERY store and supply house I visited had plenty of extra “dryer cords” in stock. This is simply a replacement cord AND PLUG should anything ever go wrong with your dryer cord. This replacement cord along with some electrical tape (which was available in abundance everywhere I went) would have given anyone the necessary parts to create an extremely viable solution to not having the individual “plug” out of stock.
However, in this time of crisis (and necessity for many), the solution of simply splicing two power cords literally eluded the masses. Virtually no one – and I mean no one thought to look for a simple outside the box, easy solution.
It’s not that viable solutions don’t exist in times of crisis, though, more frequently than not, people become paralyzed during times of stress, either defaulting to the obvious solution or simply do nothing.
This is often what happens to investors in difficult and challenging markets. Emotions take control of the decision making process, even when relatively simple solutions exist. Here’s the thing, though, if you’ve never been introduced to or educated on an alternative, your mind will never just default to something you’ve never done before. “Fight” kicks in for some while “Flight” is traditionally the answer for the majority – most are paralyzed like a deer in headlights.
While I was lucky enough to secure both the proper plug as well as a replacement dryer cord, at the end of the day, had I not been able to come up with either of these parts, a solution was at my fingertips. I would have achieved the same result by simply splicing my current dryer cord with the newly constructed extension cord that was to attach to my generator. My worst-case scenario would have been to run multiple 120v extension cords into different sides of the panel through traditional outlets (less than an ideal scenario, but it would have worked).
I chose to buy one of the “replacement dryer plugs” described above while hunting for the ideal part (just in case I couldn’t secure it); I gave myself as many fail-safes as possible. I did this with the understanding that the more fail-safes and insurances I added, the more it cost me, in both money and time.
I am comfortable with the trade off.
We speak to the importance of capital preservation strategies, having cash on hand to be opportunistic, the troubles with and dangers of benchmarking and Indexing, as well as challenges with certain ETFs and funds. We do our best to educate of the importance of true risk management. We speak to the importance of understanding why we’re doing what we’re doing.
In times of crisis, there is a high likelihood that your mind will not default to alternative solutions if you’ve never been educated on them… It’s important to understand what your alternatives might be as I’ve mentioned before, some accounts won’t be able to participate in certain solutions… It’s time to discuss what alternatives you should begin to explore so we’re ready for when the next financial hurricane (credit default cycle) comes our way. It’s not a function of if, but more so when, I can’t tell you when it will be, but we can all be more prepared.
Quick safety note: if you’re not familiar with electrical work, find an electrical professional to help you – do NOT try any of the above yourself… If you ever do backfeed your home, NEVER do this without turning your main breaker OFF. Pushing power back to the main grid can be extremely dangerous, not only to those working on restoring power to the masses, but to you.
Final Thoughts…
For over 2 ½ years we’ve been following the treasure map penned by legendary investor Warren Buffet (a protégée of Value great Benjamin Graham) while blending together the best attributes of those willing to stray a bit from being a staunch religious zealot (Value ONLY). Investors like Whitney Tilson, Wesley Gray of Alpha Architect and Erez Kalir of Stansberry Asset Management, who grew up in the school of Graham, Buffet & Munger, who have been open minded enough to step back and view their thesis from 10,000 feet.
We’ve blended ideas from traders like Stanley Druckenmiller and, in my opinion, the most important characteristic of all – we’ve adopted the single most invaluable principle Paul Tudor Jones would want passed to his children, which is to have the discipline of downside protection (“sell anything below the 200-day moving average”), very similar to our Capital Preservation Strategies approach, many (but not all) of the aforementioned have lacked.
I highlight the discipline of PTJ and our capital preservation strategies for it’s important to understand even the best businesses in the world have tremendously drastic drawdowns in times of crisis. For example, over the last 20-years behemoths like Facebook have fallen by more than 50%; peak to trough, Disney has fallen by nearly 70%; Microsoft, McDonald’s and Home Depot have all fallen in EXCESS of 70%, while Apple and Starbucks both have fallen by more than 80%, finally, the nearly $1-trillion dollar in market cap, Amazon.com has sold off by more than 90%. While the aforementioned have all grown substantially over the last decade, other “bellwethers” took years to return to breakeven or have yet to even come close, examples of this would be (CSCO (Cisco), INTL (Intel), C (Citibank), BAC (Bank of America) even GS (Goldman Sachs).
The most quality businesses in the world bring with them volatility of extremes, especially in times of crisis (and not all of them make it through the crisis). A final reference to Mr. Buffet (and reiteration of), in the earlier chart, from 1965-2017, Berkshire underperformed the S&P 500 17 out of 53-years, with multiple declines of 20% or more (48.7% being the worst in 1974). The best businesses in the world
My belief is that while markets are likely to move higher from here, I am also staunch in my belief that the next credit default cycle will be extremely ugly as discussed in my Q1 note. A benefit that we have over many of these multi-billion dollar managers is the flexibility of liquidity and discipline to our process. We continue to search for likeminded individuals to partner with.
As always, never hesitate to reach out with any questions or concerns.
Good Investing!
Mitchel
Mitchel C. Krause
Managing Principal & CCO
4141 Banks Stone Dr.
Raleigh, NC. 27603
phone: 919-249-9650
toll free: 844-300-7344
mitchel.krause@othersideam.com
www.othersideam.com
** We continue to work on getting our flagship model’s numbers audited from a performance standpoint. In opening our new firm (OSAM), performance will only be able to be officially audited as far back as the complete sets of statements we receive from clients. This may remove data points from our official numbers upon audit completion affecting 2016’s reportable performance number.
Disclosure: The commentary, analysis, references to, and performance information contained herein, except where explicitly noted, reflects that of Other Side Asset Management, LLC, a registered investment adviser. Opinions expressed are as of the current date and subject to change without notice. Other Side Asset Management, LLC shall not be responsible for any trading decisions, damages, or other losses resulting from, or related to, the information, data, analyses or opinions contained herein or their use, which do not constitute investment advice, are provided as of the date written, are provided solely for informational purposes and therefore are not an offer to buy or sell a security. This commentary is for informational purposes only and has not been tailored to suit any individual. References to specific securities or investment options should not be considered an offer to purchase or sell that specific investment. Other Side Asset Management, LLC does not guarantee the results of its advice or recommendations, or that the objectives of a strategy will be achieved. Performance shown herein should in no way be considered indicative of, or a guarantee of the actual or future performance of, or viewed as a substitute for any portfolio invested in a similar strategy.
Performance data shown represents past performance, which does not guarantee future results. Investments in securities are subject to investment risk, including possible loss of principal. Prices of securities may fluctuate from time to time and may even become valueless. Securities in this report are not FDIC-insured, may lose value, and are not guaranteed by a bank or other financial institution. Before making any investment decision, investors should read and consider all the relevant investment product information. Investors should seriously consider if the investment is suitable for them by referencing their own financial position, investment objectives, and risk profile before making any investment decision. There can be no assurance that any financial strategy will be successful.
All data presented is based on the most recent information available to Other Side Asset Management, LLC as of the date indicated and may not be an accurate reflection of current data. There is no assurance that the data will remain the same. This commentary contains certain forward-looking statements. Forward-looking statements involve known and unknown risks, uncertainties and other factors, which may cause the actual results to differ materially, and/or substantially from any future results, performance or achievements expressed or implied by those projected in the forward-looking statements for any reason. No graph, chart, or formula in this presentation can be used in and of itself to determine which securities to buy or sell, when to buy or sell securities, whether to invest using this investment strategy, or whether to engage Other Side Asset Management’s investment advisory services. In addition to the Other Side Asset Management’s advisory fee, overall returns may be reduced by expenses that an investor may incur in the management of the investor’s account, such as for custody or trading services, which will vary by investor and may exceed the trading costs reflected herein.

