
In This Article

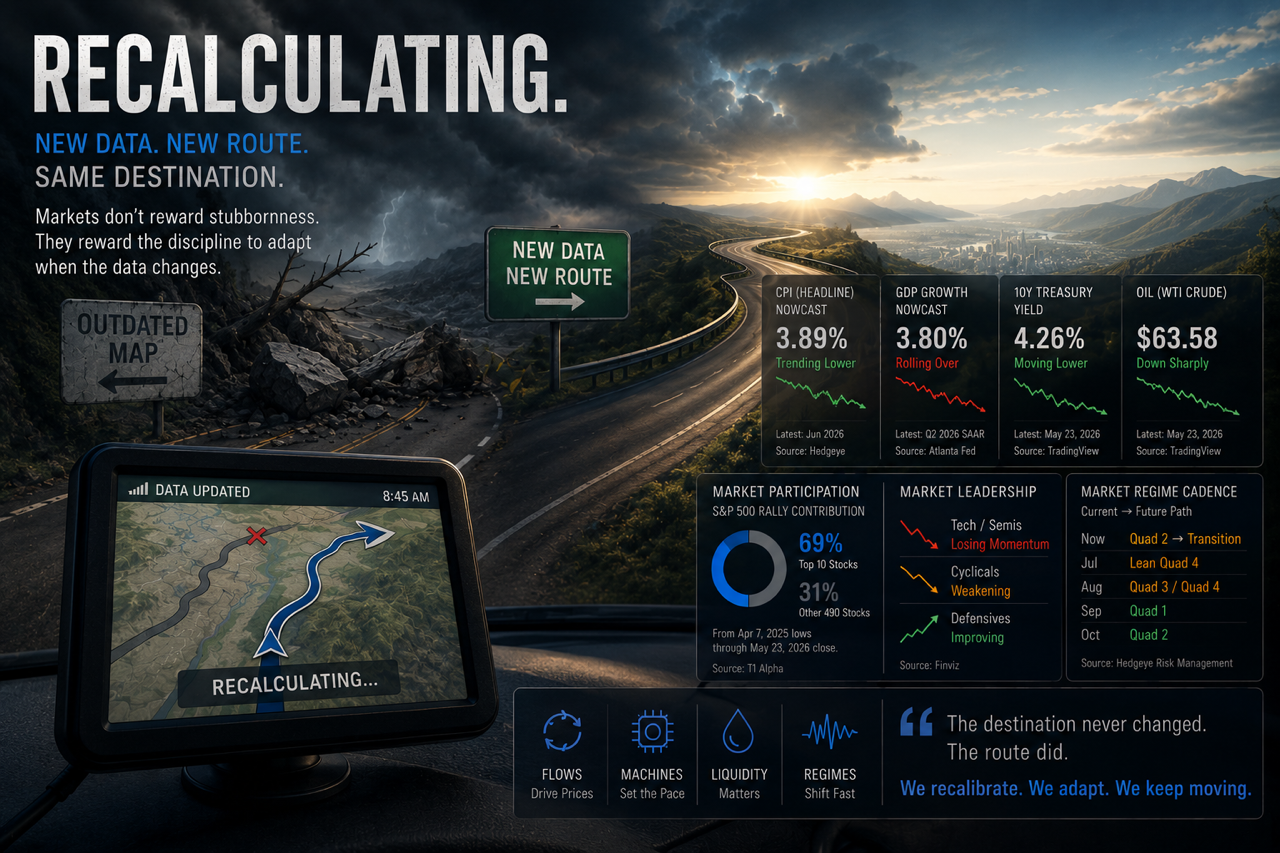
Recalculating
If you’ve driven anywhere unfamiliar in the last decade, you’ve probably had the same experience. You enter a destination into your GPS, pull out of the driveway, and begin following the route.
A few miles later, traffic builds unexpectedly … construction appears … an accident closes a lane … or maybe you simply miss a turn.
Almost instantly, the GPS responds with a single word: “Recalculating.”
What’s remarkable is what happens next … the GPS doesn’t become emotionally attached to the original route.
It doesn’t insist that the first set of directions was correct. It doesn’t argue with reality.
It processes the new information, updates the route, and provides the best path forward based on the latest conditions available.
Investing works much the same way.
Last month, we discussed the dangers of relying on outdated maps. The economic data at the time suggested a fairly straightforward path. Growth was expected to slow while inflation continued accelerating following one of the strongest CPI readings in years. That combination pointed toward a monthly Quad 3, or stagflationary, environment as we moved into July and August.
That was the route … then new information arrived … growth continued slowing largely as expected … inflation didn’t.
Oil prices rolled over … commodity pressures eased … inflation nowcasts began falling … the destination never changed.
The July and August inflection point we discussed last month appears to be arriving largely on schedule.
The route, however, has changed.
And just like a GPS, successful investors don’t get paid for stubbornly defending the original route … they get rewarded for recognizing when conditions change … and recalculating.
Right On Schedule
One of the reasons we spend so much time focusing on rate of change rather than absolute levels is because economic inflection points rarely announce themselves in advance.
They emerge gradually … then suddenly.
Last month, we outlined a roadmap that pointed toward a potential July and August inflection period. The data at the time suggested that the reflationary backdrop supporting markets throughout much of the spring was likely beginning to change.
Inflation was accelerating … growth was expected to slow.
And several of the tailwinds supporting economic activity earlier in the year were beginning to fade.
The evidence supporting that view was substantial:
On June 10th, Headline CPI was reported at +4.25% year over year, accelerating +44 basis points from April’s +3.81% reading. On a month over month basis, CPI increased +0.47%, marking one of the strongest inflation readings of the current cycle.
Energy Commodities were the primary driver, accelerating to +23.54% year over year from +17.87% the month prior as geopolitical tensions surrounding Iran and the Strait of Hormuz pushed energy prices higher.
At the same time, several areas of the economy were already beginning to show signs of moderation beneath the surface:
- Housing activity remained weak.
- Income growth was slowing.
- GDP estimates were beginning to roll over on a rate of change basis.
The result was a fairly straightforward expectation:
- Growth ↓
- Inflation ↑
A transition toward a more stagflationary Quad 3 environment during July and August.
In fact, as recently as early June, July’s conditional probabilities favored a stagflationary outcome over one of disinflation/deflation.
And then the data changed … NOT growth … growth has continued to slow largely as expected, but inflation changed.
The July and August inflection point appears to be arriving largely on schedule. What changed was not the timing, but the inflation data … and as we’ll discuss next, that change began with inflation.
What Actually Changed?
The simplest explanation is often the correct one.
The growth slowdown we anticipated largely arrived … the inflation acceleration we anticipated did not.
This distinction matters … because while most investors focus on the level of inflation, markets tend to focus on the direction of inflation.
And over the last several weeks, that direction changed materially.
Consider where we stood just one month ago:
On June 10th, Headline CPI was reported at +4.25% year over year and +0.47% month over month. That represented a +44-basis point acceleration from April’s +3.81% year over year reading and marked the strongest inflation print since April 2023.
The acceleration was broad enough to support concerns that inflationary pressures were re-emerging:
- Energy Commodities accelerated from +17.87% year over year to +23.54%.
- Core CPI increased from +2.75% year over year to +2.85%.
- Shelter accelerated from +3.30% to +3.37%.
- Rent accelerated from +2.79% to +2.92%.
- Owners’ Equivalent Rent increased from +3.29% to +3.30%.
Virtually every major component was either accelerating or remaining stubbornly elevated.
Viewed through that lens, a Quad 3 outlook made perfect sense.
Growth was expected to slow … inflation was accelerating … the route was clear … then:
- A storm blew through
- A massive tree uprooted and blocked the road
- A multi-car pile-up came
- A deal with Iran was struck, the strait of Hormuz re-opened, oil/tankers began to move, and the world’s anxiety fell
Whether it was the geopolitical equivalent of traffic clearing, a roadblock being removed, or simply the market receiving new information, the bottom line is the same: the data changed.
Within days of that CPI report, inflation nowcasts began moving in the opposite direction:
- June CPI estimates fell from approximately +4.01% year over year to +3.94%.
- Subsequent revisions pushed estimates even lower toward +3.89%.
Think about the speed of that shift:
- Inflation accelerated +44 basis points into May.
- Then immediately began decelerating approximately 31 basis points into June.
Not because economists changed their minds … but because the underlying data changed.
The most obvious shift occurred in energy.
Only weeks ago, markets were pricing in a meaningful geopolitical risk premium associated with Iran and the Strait of Hormuz … today, much of that premium has disappeared … oil prices have rolled over … fertilizer prices have fallen sharply.
Several industrial commodities that were contributing to inflationary pressures earlier in the quarter have begun moving in the opposite direction.
And because energy tends to flow through inflation data relatively quickly, those changes are already beginning to appear in the nowcasts.
Housing continues telling a similar story. While Shelter CPI remains elevated at +3.37% year over year, the underlying housing market remains considerably weaker:
- New Home Sales have fallen from +3.3% year over year to -11.3%.
- Single Family Starts remain down approximately -10% year over year.
- Single Family Permits have now declined for four consecutive months.
- Homes Under Construction have declined in eighteen of the last nineteen months.
- Builder Sentiment remains below 50.
- Meanwhile, Apartment List rents remain negative on a year over year basis.
As we’ve discussed many times before, shelter inflation tends to lag real-time housing data by roughly 12 to 18 months.
The lag doesn’t eliminate inflation … it may delay it on the surface, but markets price it in.
When we combine weaker housing data with falling commodity prices and rapidly declining inflation nowcasts, a very different picture begins to emerge.
The economic slowdown we anticipated remains intact, but the inflation backdrop no longer looks the same.
A month ago, the data suggested slowing growth with accelerating inflation … today the growth trajectory is the same, with inflation now rolling over.
The destination remains unchanged … July and August still represent an important inflection point … But the route investors are likely to travel getting there has been recalculated.
Growth Is Slowing Too
While inflation may have altered the route, the original destination remains intact.
The July and August inflection point we discussed last month was never solely an inflation story … economic investing regimes are always a two-sided coin focused on the rate of change in both Inflation AND growth.
And on that front, the data continues to move largely as anticipated.
One of the biggest mistakes investors make is confusing strong growth with accelerating growth.
They are related, but they are not the same.
Growth can remain positive while simultaneously slowing on a rate of change basis … which is what appears to be exactly what is occurring today.
Atlanta Fed GDPNow estimates peaked near 4.3% before declining to 4.0% and subsequently 3.8%.
A 3.8% growth estimate remains healthy in absolute terms, but rate of change investors aren’t asking whether growth is positive, they’re asking whether growth is accelerating or decelerating.
The answer is increasingly clear … growth is decelerating.
Housing continues to provide some of the strongest evidence.
New Home Sales have gone from +3.3% year over year in March to -11.3% year over year in April, falling -6.2% month over month to 622,000 units while months’ supply increased from 8.5 to 9.4 months.
Single Family Starts remain under pressure, down approximately -10% year over year and recently falling to their lowest level in more than a year.
Building Permits declined -2.0% month over month and -1.0% year over year. More importantly, Single Family Permits fell -2.7% month over month and have now declined for four consecutive months.
Meanwhile, Homes Under Construction have declined in eighteen of the last nineteen months and Builder Sentiment remains below 50 for the twenty-sixth consecutive month.
Approximately 38% of builders continue reporting price cuts, the highest percentage since 2022.
Housing remains one of the most interest-rate-sensitive sectors of the economy and it continues to point toward slower growth ahead.
The consumer remains resilient, but income growth is beginning to tell a different story:
- Personal Income growth slowed from +3.27% year over year to +2.54%.
- Disposable Personal Income growth slowed from +3.47% year over year to +2.62%.
- At the same time, Personal Spending accelerated from +5.73% year over year to +5.94%.
Consumers continue spending … the question is whether they can continue spending at the same pace if income growth continues slowing.
Labor market data remains mixed.
- Continuing Claims recently reached approximately 1.96 million, a cycle high.
- The four-week average accelerated from +5.5% year over year to +6.6% year over year.
- Private Construction Spending remains down approximately -5.4% year over year.
- Hiring sentiment has fallen toward cycle lows.
Yet labor is not breaking.
Initial Claims remain relatively contained … Job Openings recently posted their largest monthly increase in five years.
Rather than collapsing, the labor market appears to be cooling.
Manufacturing and industrial activity continue creating the greatest amount of confusion.
On one hand, the data remains strong:
- ISM Manufacturing accelerated to 54.0, its highest reading in forty-nine months.
- New Orders improved to 56.8.
- ISM Services reached 54.5.
- Services New Orders accelerated to 57.3.
- Industrial Production continued improving.
- Bank Lending accelerated to +7.4% year over year.
- Redbook Retail Sales accelerated to +8.9% year over year.
Viewed in isolation, these data points suggest an economy that remains considerably stronger than consensus expectations … however, context matters.
Many of these improvements occurred during a period characterized by tariff uncertainty, inventory rebuilding, supply chain concerns, and elevated geopolitical tensions. Businesses had strong incentives to pull activity forward, build inventories, and secure supply before potential disruptions occurred.
The question is no longer whether growth accelerated during the spring … the data clearly shows that it did.
The more important question is whether that acceleration can be sustained.
When we step back and evaluate the broader mosaic, the answer becomes clearer:
- Housing is slowing.
- Income growth is slowing.
- Labor is cooling.
- GDP estimates are moderating.
Yet several cyclical indicators remain positive.
That is not a recessionary backdrop … it is a decelerating growth backdrop.
And that distinction becomes critically important when viewed alongside an inflation outlook that is now beginning to slow as well.
Markets Take Note
Economic data and market behavior rarely move in perfect lockstep … in fact, one of the more frustrating realities for investors is that markets often begin adjusting to economic changes long before those changes become obvious in the headline data.
That appears to be the environment we find ourselves in today.
For much of the spring, markets behaved exactly as one would expect during a “reflationary” Quad 2 environment.
- Growth was accelerating.
- Inflation was accelerating.
Semiconductors led … artificial Intelligence led … tech outperformed … credit spreads remained contained … economic surprises generally exceeded expectations.
Markets were rewarding growth, and the data supported that behavior. Today, the conversation is becoming more nuanced.
Over the last several weeks, shorter-term momentum across broader indices has deteriorated from positive to neutral and, in some cases, outright negative.
Importantly, longer term trend remains intact … for now!
Markets have not officially broken … the signal has not failed … but short-term momentum has clearly weakened … which points to caution (for now).
The market is no longer confirming this springs Quad 2 … it’s suggesting phase transition.
Several previously dominant areas of the market have begun struggling to make new highs with the same consistency that characterized much of the spring advance. Larger tech names that led the charge have quietly broken both momentum and longer-term trend support.
Markets don’t wait for economic reports … markets attempt to discount where economic reports are heading.
A month ago, investors were pricing a world characterized by accelerating growth and inflation … today, they are attempting to determine whether slowing growth and slowing inflation will ultimately prove to be the more likely outcome over slowing growth and accelerating inflation.
This distinction matters.
Historically, markets have tended to respond very differently to those two environments.
One tends to favor commodities and inflation beneficiaries … while the other often rewards more defensive positioning.
To be clear, we are not suggesting that markets have already decided the outcome.
The recent deterioration in momentum could prove temporary … trend could reassert itself … growth could stabilize … inflation could reaccelerate.
Yet, the market remains at an important crossroads.
But when viewed alongside the recent changes in inflation data, the market’s behavior becomes considerably easier to understand.
The destination remains uncertain … the market, however, appears to be recalculating the route … and as investors, that is often where we find our earliest clues regarding what may come next … as such … our positioning will follow the data our levels and process.
Final Thoughts
When a GPS recalculates, it isn’t admitting it was wrong … it’s responding to new information.
As investors, this is important to understand.
The July and August inflection point we’ve discussed for several months appears to be arriving largely on schedule … the destination never changed …. what changed was the route.
A month ago, the data suggested slowing growth and accelerating inflation. Today, the data suggests slowing growth and slowing inflation. That single change has meaningful implications for markets, sector leadership, and portfolio positioning heading into the second half of the year.
The next several weeks should provide additional clarity.
- Will oil continue to fall?
- Will housing continue leading shelter inflation lower?
- Will growth stabilize following its recent moderation?
- Will markets regain momentum and confirm the prevailing uptrend?
- Or will investors continue adjusting expectations toward a more disinflationary environment?
Those are the questions that matter now.
Not what inflation did last month … not what GDP did last quarter.
What matters is where the data is going next … for the data drives the flows … that’s why we spend so much time focusing on rate of change.
The level of economic data tells us where we’ve been … the direction of economic data often tells us where we’re going.
As investors, our responsibility isn’t to defend yesterday’s forecast … it’s to objectively evaluate today’s evidence and adjust when conditions change.
A GPS that refuses to update eventually becomes useless … investors who refuse to update often suffer the same fate.
Helping families navigate retirement with confidence remains the goal.
The route, however, will occasionally change as new information becomes available.
When that happens, our job isn’t to defend the old route … our job is to recalculate.
If you’d like to discuss how these changing economic conditions may impact your retirement income plan, investment strategy, tax planning, or long-term financial goals, we’d be happy to help.
Our process begins with a complimentary retirement income and financial review designed to help families understand where they stand today and what roadblocks in retirement lie ahead.
Schedule your free consultation today.
As always … Good investing!!

Mitchel C. Krause
Managing Principal & CCO

4141 Banks Stone Dr.
Raleigh, NC. 27603
phone: 919-249-9650
toll free: 844-300-7344
mitchel.krause@othersideam.com
Please click here for all disclosures.

