
In This Article

The Return of Volatility… Remembering the “Bigger Picture”. Death by, water? TRU; too small to care? Let’s talk China, Tariffs and Trade wars. We see you.
Our flagship model is coming off a strong 2017 up 21.11% following a solid **2016 as well, **15.1%; each respective year we’ve either beaten or being “in-line” with the S&P, achieving these numbers with significantly less risk than markets holding a strong cash position. Some of you have been with us from early on in 2016, while others have come on board as recently as this week; the majority, however, spread out somewhere in- between. Please keep in mind that each individual investor will have a bit of a different experience based upon their respective “starting point” and total dollars invested, as we don’t by fractional shares.
Those reading this who have yet to join us, we hope you give our below thoughts some serious consideration. Please feel free to reach out with any questions or concerns, we’d love to have a more thought provoking conversation.
For those with us from the start of 1Q2018 there is one word which best describes the quarter:
whip·saw ˈ(h)wipˌsô/ noun
- a saw with a narrow blade and a handle at both ends, used typically by two people.
- to subject to two opposing forces at the same time.
Borrowed from the vigorous pushing and pulling motion used by lumberjacks of yesteryear as they handled the two handled saw, those in the financial industry use the term “Whipsawed” to describe a severe reversal in price action of a particular investment or market.
Whipsaw describes the movement of a security when, at a certain time, the security’s price is moving in one direction but then quickly pivots to move in the opposite direction. There are two types of whipsaw patterns. The first involves an upward movement in a share price, which is then followed by a drastic downward move causing the share’s price to fall relative to its original position. The second type occurs when a share price drops in value for a short time and then suddenly surges upward to a positive gain relative to the stock’s original position.
Let’s get into the numbers, get some housekeeping behind us and then make our observations and outlook:
2018 YTD for the S&P
(-2.04%) Total Return 2018 YTD for the DJIA (-2.68%) Total Return
2018 YTD for our Equity Solutions Model (-2.68%)** Total Return
A brief “housekeeping” note before we get into the guts of our thoughts:
Given the extreme volatility of the quarter, there are some very important points to discuss. In an effort to keep as many engaged as possible, I thought it best to split this quarter’s discussion be broken up into two parts. Part 2 needs your attention and focus; it will be one of the most important concepts for you to you read and understand this year.
This was a quarter filled with quite a bit of emotion for someone who manages assets, primarily, from an emotionless stance. The outpouring of support from clients joining us here at OSAM has been overwhelming. The majority of clients have matched or exceeded our own enthusiasm, which is fairly high. Admittedly, a very small minority voiced their distaste for the “change”, and we understand. As we have conveyed to ALL involved through this transition (both those who have come and the very few who have not), change is not easy; I was with the same firm for nearly 22 years – I’m not a fan of change either, though, after months of reflection on our core values and vision, it was a necessity.
Some of the most successful companies in the world are those who have been able to recognize trends in markets that may require change; followed by their ability to adapt and execute. The “Apple” you know today is not the Apple Steve Jobs dreamt up in his garage, the PC launched Apple while the iPhone revolutionized them. Blockbuster video rental had the ability to buy Netflix for $60 million yet scoffed at the offer; I think you all know how that one ended?! Managing risk and preserving capital cannot be done effectively by crossing your fingers and hoping stocks always go higher.
Frustration is the next emotion that overwhelms me. I fought for the ability to add certain investments to my model in an effort to manage risk for years. Hitting roadblocks at every turn, there came a point where I had to come to grips with reality; no matter how “sound” my position, “firm policy” would always be the prevailing decision. Many of my clients know and understand this was a driving force behind Other Side Asset Management (OSAM). The small hedges I fought to own (unsuccessfully) were up nearly 300% in mere days as the Volatility Index (VIX) spiked from $10 to north of $50 just weeks following my resignation; I kick myself as I didn’t find some “back door” way to own these – I just didn’t.
Given all of the challenges of opening the firm, moving clients to our new platform, physically moving the assets, reconciling the model, adding some new names to the portfolio, we ended the quarter “dead on” with the DJIA and a hair behind the S&P. We have nearly 15/16% in cash and are diligently watching the high-yield bond market via the HYG, a good indicator of the mindset of “high-yield credit investors”. Early readers
know I’ve written on the HYG/SPX correlation for nearly 2 years now. One of my first notes written June of 2015 discussed this just before that August’s 8% sell off (more on this below). Our analysis of this, coupled with many other indicators, will dictate whether we become more aggressive or defensive moving forward (more on this below).
There is still a lot of work to be done. For those who want the ability to short some names, we likely need some paperwork? IRA’s can’t short as I’ve mentioned many times, we can accomplish minor hedges via out of the money puts (when volatility subsides a bit), again, we will likely need some paperwork here, too (call and we’ll handled a.s.a.p.). In the meantime, we will be reaching out as well to talk over the next few weeks to discuss all of our options and current opportunities.
Thank you just doesn’t convey how I feel, but it’s all I got at this moment in time.
Observations:
2018 began with a “business as usual feel”. The 3 major indices moved higher daily (or what seemed to be), corporate earnings came in better than “expected” (for the most part), Whitehouse staff rotated out more frequently then the length of an average “shift” in a playoff hockey game (sarcasm), then came February, bringing with it…
The Return of Volatility…
In our 4Q2017 note we wrote:
“We’re in a “similar” camp to Gundlach (speaking of Jeffrey Gundlach), though, we disagree on timing… 2018 will more than likely bring us fireworks – increased volatility(as seen today) – higher highs with less likelihood of lower lows (there is still a chance though so don’t discount it to zero).”
These words were written just a few weeks before the first 10% decline markets had seen in nearly 2 years. The volatility index (VIX) hovered in the high 8’s to low 9’s for much of December; volatility had nearly evaporated, hitting a low of 8.56 November 2017.
Investors had been lulled into “complacency” believing every time there was the slightest of sell-offs, an imminent rebound was looming; and for quite sometime, their had been.
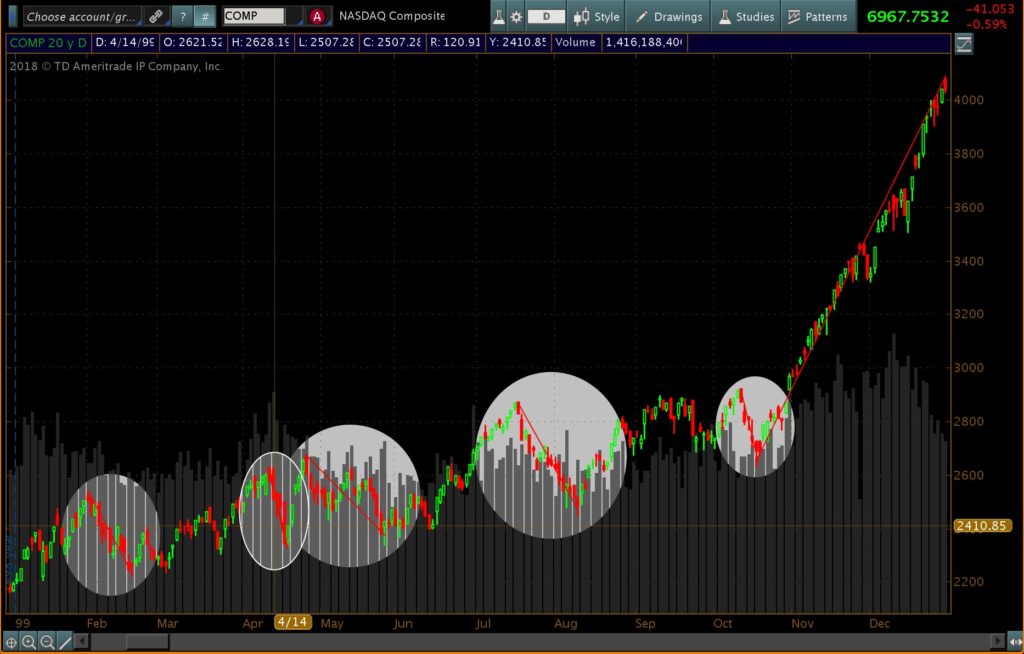
Increased volatility (“fireworks”) would be considered a “normal” character trait of a “late stage” bull market. Please take a look at the chart below showing the final year of the Nasdaq “tech bubble” which produced five, 10% corrections while on its way to returning nearly 90% to investors. Many individual technology and biotech names were up 200-300% in the same time frame.
Bull and Bear markets tend to have certain defining characteristics. For example, bull markets often last longer then bear markets. Bull markets, can be likened to taking the steps up to the observation deck of the Empire State Building; slow, steady, with some modest pauses needed along the way. Bear markets, on the other hand, are often very swift and aggressive; like jumping off the Empire State Building from the observation tower. History tells us that very few jump with a parachute or safety device, allowing the ground to stop their fall. Regardless of how much “upside” investors capture of the bull market, most fail to preserve these gains, more often then not leading to significant loss.
Markets tend to give us the ability to observe microcosms of both bull and bear traits within the current secular trend. From November 2016 through early January 2018, the DJIA had moved nearly 8,000 points, the final 3 months adding 3,000 of those points; October 17, 2017 through January 16, 2018 the DJIA moved from 23,000 to 26,000 with no notable correction to speak of. This was the fastest 3,000 point move in history, as we’ve discussed before, nothing goes straight parabolic without feeling the affects of gravity.
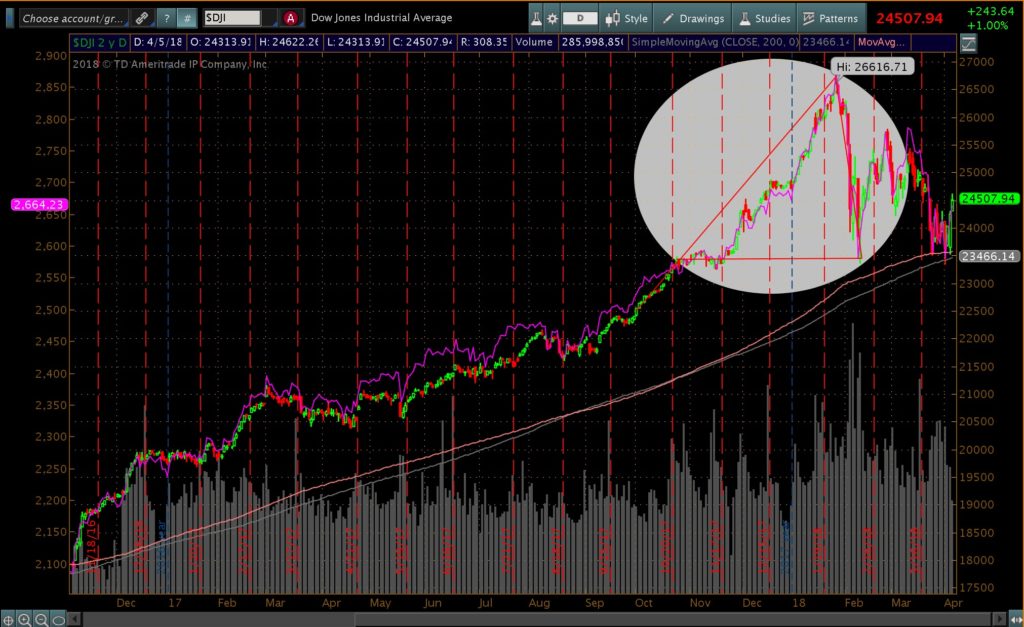
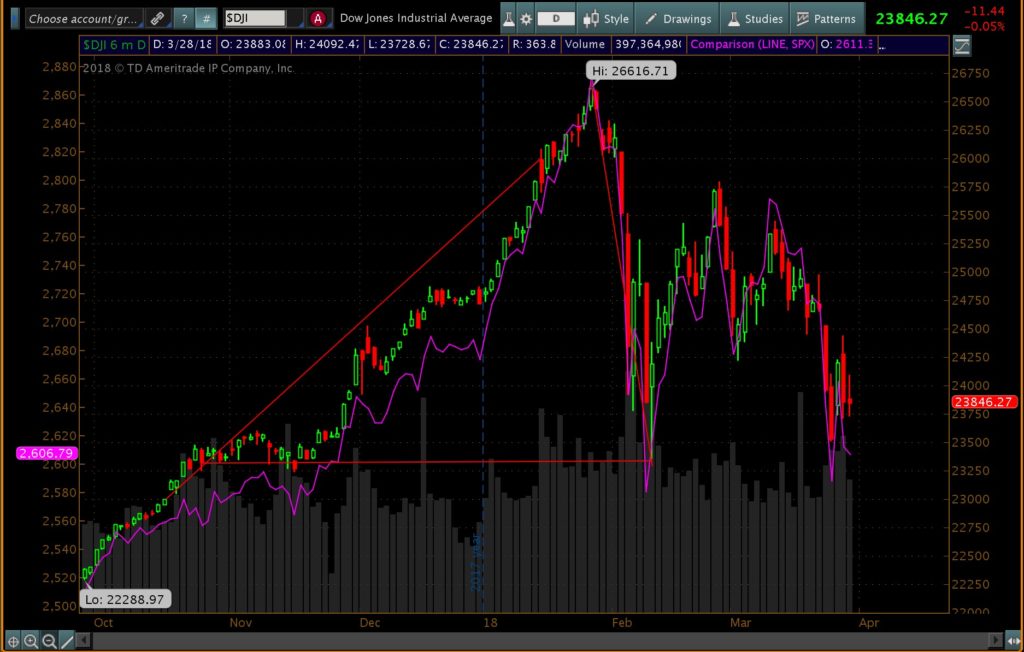
The chart below is a 6-month chart of the DJIA with the S&P overlapped in purple. It’s nothing more than a close up look at the most recent 10% drop highlighted above. There are plenty of technicians far better than I – though, this is a perfect example of bull and bear traits within a secular trend; It took roughly 3 months for the DJIA to move from 23k to 26k – yet 10 trading days wiped away all but 300 points of that gain.
Remembering the Bigger Picture…
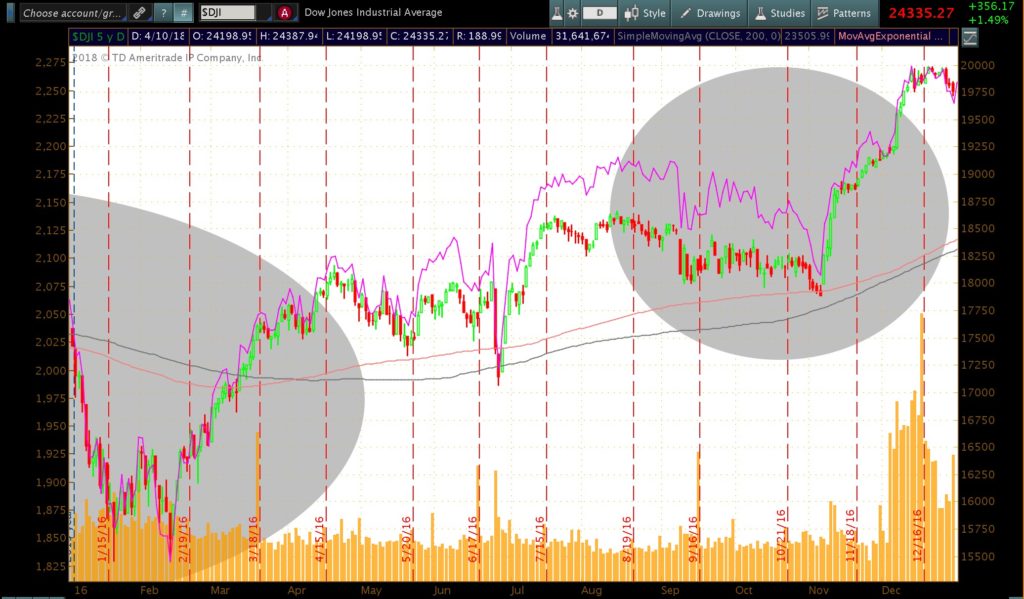
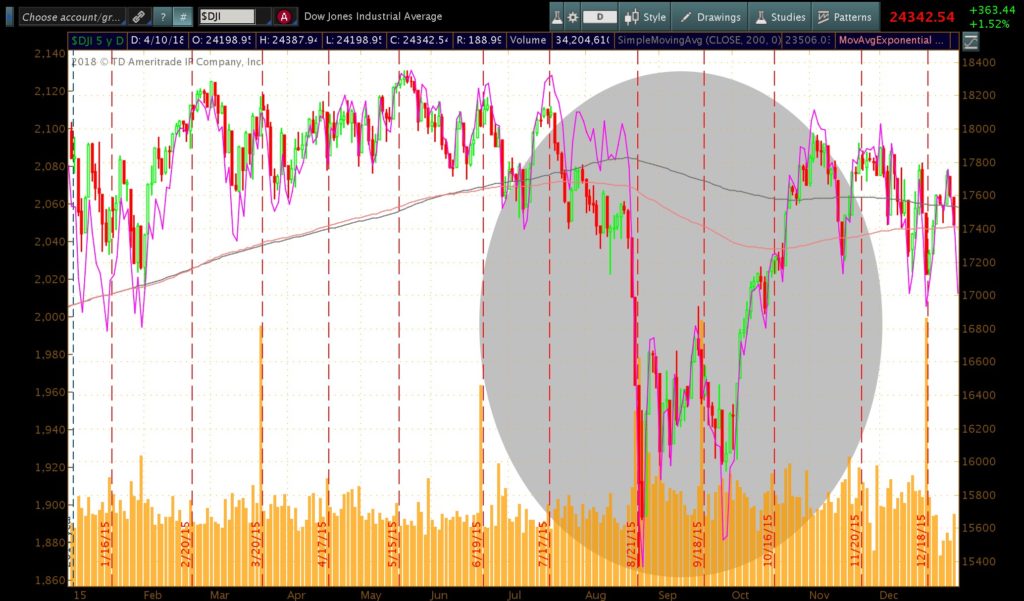
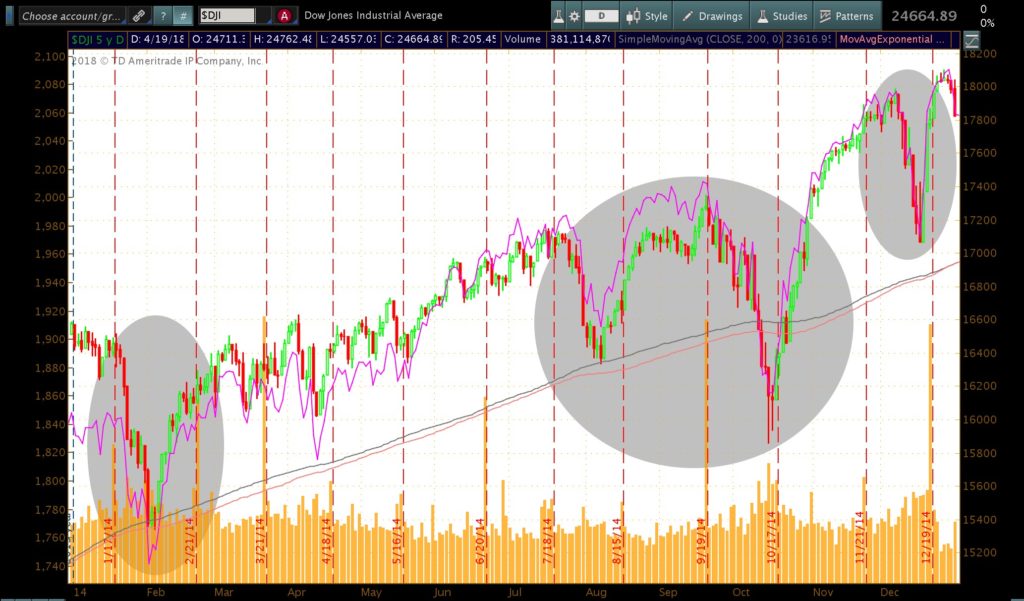
Do you remember how markets started the year off in 2016? Let’s take a look…
Down a quick 12.4% in January, August through middle of October (highlighted in grey) brought some significant volatility as well.
2015?
Anyone want to take a gander as to how 2014 began and ended?
I would be willing to make a fairly large friendly wager that during each of these periods, the media sensationalized these downturns suggesting the end of the bull market was finally here. Without belaboring the point, the below headlines are a mere fraction of what a quick Google search yields:
- Dow plunges 331 points as oil falls below $50 – CNN Money (January 2015)
- Dow plunges 391 points as fear grips markets – CNN Money (January 2016)
- January 2016 Stock Market Review: The Bear Awakens? | See It Market
Markets SOARS – Dow PLUNGES – how would you feel getting onto an elevator where “soar” and “plunge” replaced a simple up or down?
Newspapers have always been in business to sell newspapers. Network news chases “eyeballs” (ratings); the more “eyeballs”, the more they can charge advertisers for “air time” where commercials “sell you” on why you should buy their products… Drink more Coke or Pepsi; ask your Doctor about how [fixmylife] drug can help you (disregard side affects); this lingerie will make you look and feel like society suggests you should.
A headline is nothing more than an exaggerated snapshot of information designed to capture your attention at a “specific moment in time” and outrageous headlines “sell”.
“If “Meet the Press” were around at the birth of the light bulb it would have lamented the death of the candle” ~Don Connolly…
What headlines do, is invoke an emotional response, which is not necessarily healthy at a time in which we have become products of sensory overload. It can almost feel as if your drowning or being smothered; social media, barrages of personal and professional emails, text messages, marriages or relationships, kids schedules, “life” can become overwhelming, yet it perpetuates poor decisions based upon lack of focus. Our focus has becomes so “in the now”, we often forget to take a step back, breath and look at the bigger picture.
Once upon a time, investors checked the daily newspaper for pricing on stocks and mutual funds. In no more than a few decades, it has become a sensationalized marketing ploy by the media; day trading has replaced true investing. The prices advertised are only yours if you are redeeming or selling at that particular moment in time.
Now, let’s take a look at a much “bigger picture”
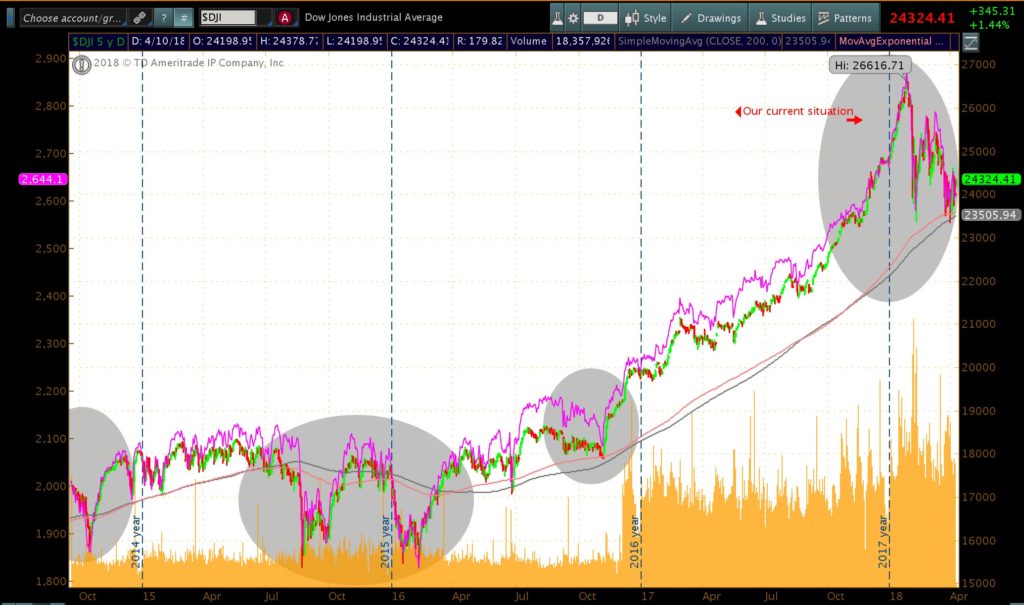
Had you paid attention to the headlines over the last 3 years you would have missed out on quite a move; headlines can literally make you sick. Please, take a step back and turn off the “NOISE” (1Q2017 note). There will come a point in time where our focus shifts, however, I can assure you, it won’t be CNBC, Bloomberg TV, Jim Cramer or the Wall Street Journal which drives our decisions nor should they alter yours.
While 2018 is off to a choppy start, the increase in volatility shouldn’t be a surprise to anyone who reads these notes… 10% corrections are part of investing, Yardeni research just put out a great visual note detailing bull and bear markets dating back to the 30’s. I urge each of you to click here and take a brief look.
The Real Challenge that lies ahead…
The real challenge that lies ahead is complacency; 10% corrections can look an awful lot like the beginnings of a new bear market. Again, what current markets still appear to be in a relatively normal progression of a “late-stage” bull market, yet, and I can’t stress this enough, there is no specific “rule” that states all “late-stage” bull markets must act the exact same way.
Yes, volatility has spiked, markets have corrected (and could correct further) yet, no one
knows for sure if this is the end of the bull or beginning of the bear? History is however; on the side of the bulls as bear markets are far less likely to begin when companies are showing continued strength in revenue and earnings, consistently beating Wall Street estimates. As we stare Q1 earnings right in the face, we’ll see if that trend continues. We could have 1,3, 5 more of these whipsaw corrections leading up to the Blow off top we’ve frequently mentioned, it could be the beginning of our next credit default cycle, only time will tell.
Based upon numerous factors from history, studies, market cycles and current market indicators my belief is we have just begun to see the “fireworks” I mentioned in last quarters note, we simply can’t know for sure. NO ONE, regardless of how hard they pound their fists, knows for sure; this is why we do our best to plan for multiple scenarios. This is why we follow our sell disciplines.
Some have asked, if our volatility and risk is reduced, how are we “in-line” with indices this quarter? It’s a good question; as mentioned above, there was a point during this recent sell off our disciplines had us come out of a few names bringing us to 36% cash. While we follow our capital preservation strategies, we still attempt to be opportunistic, we added a few names that currently have stronger internal characteristics to our portfolio reducing our cash position from 36% to 15/16%.
The names we added such as Boeing, American Express and MercadoLibre were purchased as markets were selling off (in an effort to “buy low”); markets did continue to move lower, which attributed to a light drag on the portfolio, in our opinion more of a short term timing issue as we’ve only owned these names for a few weeks prior to quarter end. Additionally, we also own some investments not directly correlated to a specific major index, and example would be our Chinese holdings (CAF and KBA), which have provided us with additional “alpha” over the past year and a half, though have traded lower on the “tariff talk” (much more below on this below, why we are not worried about these names and why we feel as if the “alpha” will return shortly).
While some market indicators flash “caution”, the vast majority of indicators are still in the proverbial “green” with none currently “red”. There will come a point in time it becomes much more prudent to hold a greater percentage of our proverbial “chips” in cash for a much longer period of time; given what we see, it’s not that time just yet. We are comfortable being “in-line” with indices given our current indicators. At some point,
it will be significantly more advantageous and less risky to hold more bonds then equities, should we continue to “benchmark” ourselves to the S&P or a mix of the S&P and Barclays aggregate at that point? Given the amount of cash we hold a combination of the S&P and Barclays Aggregate would likely make more sense, though, my belief is “benchmarking” has the ability to be dangerous. While it’s important to understand how you stack up, understanding what the risk you are assuming to achieve your returns is much more important in our opinion.
Should we enter another 2007-2009 (down 53% peak to trough), I personally will not be happy suggesting we’re “only” down 50% (those who “benchmark” will be). The final quote shared in this note says quite a bit in a few short sentences… One could relate it specifically to this topic at hand; try to get there to read it.
Death by, water?
Most people understand water is necessary for life. Water carries essential molecules and nutrients to cells as well as transporting waste away, keeping cells healthy. Water is required for circulation, respiration and converting food to energy. The human body is approximately 60% water, the brain; nearly 70%, our lungs are roughly 90%, experts estimate the body needs to replace between 2.00 – 2.5 quarts of water through ingesting liquids and food per day. While humans can survive weeks without food, on average, even the healthiest of humans can only survive 3-7 days without water.
What many people don’t realize is that drinking too much water in too short a period of time can be extremely dangerous. While water is literally our “life’s blood”, “over consumption” can cause the level of salt (sodium) in our systems to drop to dangerously low levels; a condition called hyponatremia (also known as “Water Intoxication”); this condition can be fatal.
So what does this have to do with investing?
Exchange traded funds (ETF’s) are not exactly the “life’s blood” of all investors, though, at this point in time, they have become the preferred “go to” investment vehicle for the vast majority of investors, including many brokerage firms via their “custom diversification models”, they’ve become the asset gatherer’s low cost life line.
Both ETFs and index funds were created with many perceived benefits for individual investors, the more obvious being a less expensive “ticket” to diversification through passive investing. ETF’s are designed to match specific indices, and with the help of endorsements from investing icon Warren Buffet, over time, the number of ETF’s and dollars invested in them has grown exponentially.
JP Morgan estimates nearly 90% of all daily market trading volume comes from passive investments and computer quant funds, as reported here by CNBC & Barrons.
Furthermore, research firm Bernstein estimated that nearly 50% of all money in financial markets is in some form of passive ETF. As money continues to flood markets via ETF’s and index investing, caution has been thrown to the wind, as money is now primarily added to companies based upon “money flow” alone, rather than fundamentals. Given the exponential growth over the past few years, prices are quickly becoming disconnected from underlying valuations. A stock is no longer bought because it’s “cheap” from a valuation to earnings, sales or revenue, it’s now bought because it’s part of a specific index and more money has been allocated to that particular index or ETF.
In previous notes we’ve discussed global central banks pouring money into markets. These purchases being made by the BOJ (Bank of Japan), SNB (Swiss National Bank) and ECB (European Central Bank), have primarily come through vehicles like ETF’s and index funds. Hundreds of billions to trillions of dollars have been moving into markets through these vehicles, which begs the question, what happens when the music stops?
What happens when the printing presses no longer work? Who, or better yet, how many are left without a seat when the music stops (markets sell off)?
A better question might be, what’s the “pain tolerance” of these central banks? If US equity markets sold off by 25-50%, what happens to the value of say, the Swiss Franc? Will there even be a rotation from “risky” to “less risky” assets? Traditionally, “risk off”
has pushed investors to Treasury bonds, though, what happens if “credit” is largely to blame for the next market correction?
While I am a large advocate for reducing fees and high liquidity, my belief is many investors confuse or equate low fees, diversification and high liquidity to “lower risk”, which is likely a false pretense. While expenses are extremely important to be mindful of, it should only be one of the many decisions to consider when investing.
I heard a wise tale many years ago from a gentleman by the name of Don Connolly addresses this point with a simply with the “Springfield story”…
It’s the Story of a traveler who came storming to the window of the ticket counter at grand central station about to miss his train shouting breathlessly, quick, quick, give me a ticket to Springfield!
Springfield the ticket seller asked, which Springfield? Arkansas, Colorado, Georgia, Idaho, Illinois, Kentucky, Louisiana, Maine, Massachusetts, Minnesota, Missouri, Nebraska, New Jersey, Ohio, Oregon, South Carolina, South Dakota, Tennessee, Vermont, Virginia, West Virginia or Wisconsin.
And the traveler asked, well, which one’s the cheapest?
The answer to this question of course is it depends entirely on where you want to go; the cheapest ticket is the right ticket only if the nearest Springfield is the one, which is your destination. A cheap ticket, which takes you to a Springfield that’s out of your way or in the wrong direction, is a very expensive ticket indeed.
There are no bargains in parachutes, life preservers, fire extinguishers, brain surgery or a ticket to Springfield…
What was once a healthy dose of low cost diversification has morphed over recent years with the help of continued global central bank intervention and a great marketing campaign. These investments have now become the equivalent of “drinking too much water” or purchasing a ticket to the wrong “Springfield”. The structure of these vehicles, coupled with a false sense of security has created a tremendous amount of risk to the entire system. My belief is this will become exposed by what I believe to be the single largest problem looming over our financial system today.
While significant danger lies in passive equity investments, specifically ETFs; my single greatest fear or MOAB exists in passive Bond ETF’s and Bond Funds. What was once designed, as a “safeguard” for investors will likely become a catalyst placing a tremendous amount of strain in both bond and equity markets. More importantly, while it is my largest fear, it could also lead to our greatest of opportunities. I have dedicated a note to this topic alone to be released next week.
TRU, too small to care? Or…
Historically, The stock market and high-yield bond market (junk-bond market) do move in similar directions. Wall street lore says bond investors are often ahead of (and more intelligent than) those who trade equities, which is why many tendto
look towards the High yield market as a leading indicator as to where stocks may be headed.
Continued:
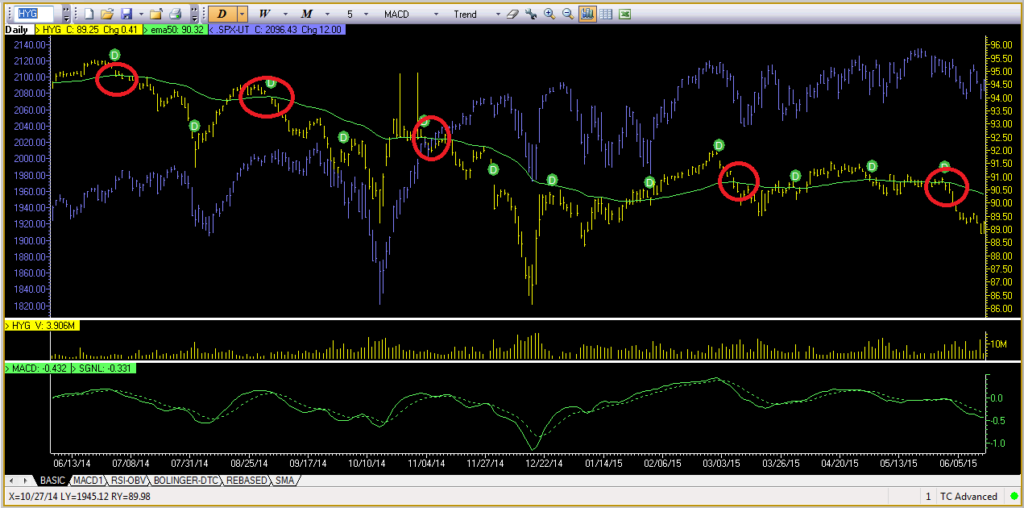
As the chart illustrates (below), the last 4 times this has occurred in the past year
– an S&P “downturn” has trailed that of the HYG by a few weeks, but none the less, has indeed followed with anywhere from a 3%-7% sell off in the S&P 500.
Written on June 17, 2015, these excerpts were part of email that went out to clients and prospects discussing the correlation between the high-yield bond markets (as measured by the HYG) vs. the S&P 500 (SPX). It was my first attempt at documenting thoughts to digital paper.
I remember it vividly as it was that email which began my writing. It was short, remedially written, yet fairly accurate call as no sooner did August come bringing with it, an 8% plus drop in the S&P. I’m not proud of everything written in that note; at the time, I was not brave or confident enough to speak too far from the firm’s narrative for fear of losing my job. I had yet to receive approvals to run my discretionary model, but it was a start nonetheless.
Fast forward to today, I want you to take a look at something…
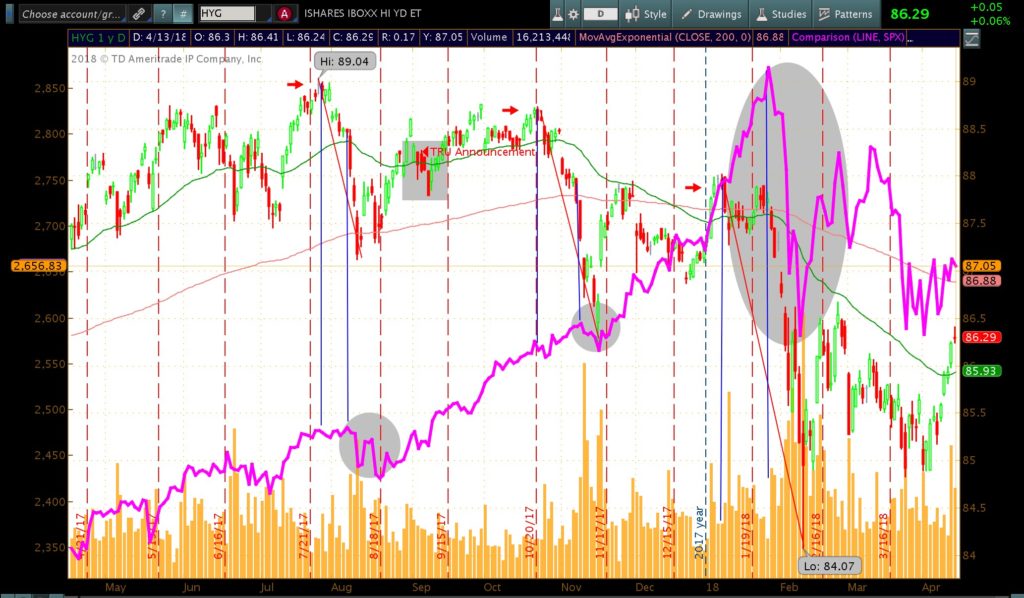
In the chart above, there are 3 “channels” denoted by blue vertical lines. The first blue line in each channel is when the HYG begins to fall – the second blue line in each channel is when the S&P begins to fall… It is important to note the time lag between when the HYG sells off and the S&P begins to follow. The sell offs become much more severe on the S&P when the HYG falls significantly (as can be seen in the 3rd and largest grey circle), as well as when the HYG trades BELOW the horizontal green line (which is the 50 day moving average)
I have highlighted the Toys R Us bankruptcy announcement last September (grey rectangular box). You will note an immediate weakening of the HYG following the announcement, briefly falling below the 50-day moving average.
You may also notice 3 red arrows in the chart above; following the TRU announcement; the HYG was never able to generate enough strength to move higher than the previous peak (the first red arrow before the announcement).
Was Toys R Us the “canary in the coalmine” moment warning credit markets or was it too small to matter?
Toys R Us was attempting to refinance roughly $400 million in debt, which was to come due this year, 2018. A relatively small number, though, by no means tiny. If TRU couldn’t refinance their debt, in their efforts to be early in line (trying to refinance 2018 debt in 2017), would companies with significantly more debt have an easier or more difficult time doing the same?
The recent action of the HYG (High Yield Bond ETF) vs. the SPX is eerily reminiscent to that of what we saw back in June of 2015 leading up to August’s S&P weakness.
Credit markets had been jittery since the TRU announcement, never gaining enough strength to reach a “higher high” (i.e. never trading higher then each previous red arrow in the chart above) through year end 2017; 2018 brought continued weakness through mid January; falling off a virtual cliff right around January 31. The question then
becomes did anything happen the week of January 31, 2018 to rattle credit markets??? If only we could put our fingers on something…
That week, media giant; iHeart Radio missed a $106 million dollar interest payment. The missed interest payment was ¼ the size of the entire amount of debt TRU was attempting to refinance; yet iHeart Radio carries roughly $20 billion worth of debt per the Wall Street Journal. For those of you who don’t click on the hyperlinks, I think it’s important to highlight something quoted in the WSJ’s piece:
“This company going bankrupt is not a problem, it’s the solution,” says Cowen analyst Lance Vitanza. A bankruptcy could free up cash to invest in talent and programming, he said.
You can’t make this stuff up! “This company going bankrupt is not a problem”… Attempting to cut debt from $20 billion to $6-8 billion, wiping away nearly 60% of the company’s debt due to mismanagement isn’t a problem? This mentality IS Wall Street ladies and gentlemen. It’s not the exception – it’s sadly the rule… Though, I digress.
Early March brought another shock to the high-yield credit markets as retailer, Claire’s stores, announced their troubles drowning in nearly $2.2 billion of debt; iHeart radio then made “official”, filing for bankruptcy protection on March 15th.
Years ago before technology became woven into our cultures fabric; miners would literally carry canaries (little birds) down the mineshafts with them. If dangerous gases, such as carbon monoxide, were present, the gases would kill the canaries before the miners, thus, providing the miners with an early warning signal that the mines were not safe and they should get out and head for safety as quickly as possible… Hence the allusion, “Canary in the coal mine.”
Some suggest TRU was too small to matter to credit markets in the grand scheme of things. I believe those who dismiss the thought are completely missing or misunderstanding the concept and importance of what a “canary in the coalmine” moment is. It’s a warning or signal that danger may lay ahead.
At this point I would suggest we take another look at the value of both Tesla’s equity and bonds. Anyone who has read one of my quarterlies knows my belief that TSLA is a bankrupt company simply waiting for its investor base to accept reality; from my 3Q2017 note:
There is no economist, investor or analyst in this world that can rationally explain to me how Tesla (TSLA) who delivered 76,230 cars in 2016should have a markets cap of nearly $56 Billion dollars. The company has failed to meet virtually every manufacturing and sales target it has set for itself. The company has over $10 billion in debt; it’s chewed through more than $10 billion in cash since 2012. Given its current cash position and burn rate, it could be out of cash by 1Q/2Q2018 unless it raises more capital in the not so distant future? Ah yes – and it has never turned aprofit,
EVER. Adding insult to injury, once TSLA surpasses 200,000 vehicles sold, it will also lose its government subsidy at a time where competition in the electric car market is about to explode with tremendous supply coming from viable, currently profitable auto manufacturers from GM to BMW, Audi and Mercedes to name a mere few…
TSLA’s survival is the “typical” Wall Street mindset; I’ve already poured billions of other people’s money into this (worthless) company, if we don’t give them more now, we’re sure to lose it all. Let’s just keep them afloat a bit longer, maybe, just maybe there is a chance to salvage some value in the long run finding a “greater fool” to sell it to in the near future. Again, $10 billion cash burned, $10 billion in debt, $3.5 billion cash burned through in 2017, $3.4 billion cash currently on hand with $900 million of debt coming due in 2019.
Elon Musk has been tremendously optimistic, he has suggested their model 3 production would hit 500,000 units in 2018 reaching 1 million in 2019, Bloomberg has recently reported,
“Bloomberg’s Model 3 tracker estimates the company may be making about 975 of the cars a week, well short of the target to build at a 2,500-unit rate by the end of this quarter.”
975 Units is a far cry from 2,500. Coupled with another fatal car crash, chip maker Nvidia is “pausing” their self driving car testing, Moody’s downgrading the company’s credit rating to B3 while taking their bonds to Caa1, the company’s stock had traded off by nearly 31% since February 26th ($358 to $248) only to bounce back as I edit. I mean, after all, Elon Musk “tweeted” they will NOT need to raise additional capital this year. SMH.
In late 2016, the company said they wouldn’t need to raise additional capital before the end of they year as well – and admittedly, they didn’t. They waited till mid 2017 to raise an additional $1.8 billion via a debt offering. You can play with what amounts to be semantics all you want, eventually, investors will need to hold the company accountable. There was a point in time the towns people didn’t come for the “little boy who cried wolf” when he really needed them.
Eh – Stranger things have happened, but this is where things get really interesting…
Toy’s R Us was attempting to refinance 2018 debt in 2017, for many reasons, one of which was the sheer number of companies in need of capital is quite long through 2021. Back of the envelope requirements looks like roughly $900 billion will be maturing and rolling in 2019 with nearly $360 billion specifically for the high yield markets (which is where TSLA’s debt falls). Moody’s recent downgrade of Tesla “should”, “in theory”, make it much more expensive for them to refinance their debt, while cash will likely flow out the door at a more rapid pace; parts suppliers will likely want to be paid more quickly as they begin to fear not getting paid at all.
Maybe it makes sense for TSLA to hold off a capital raise in an effort to sure up its balance sheet? If so, they will likely be walking a very thin tightrope with respect to their capital requirements heading into 2019. Unless of course… Model 3 sales go through the roof and they can meet manufacturing deadlines (which the company has NEVER done in it existence) At their current estimated pace, it’s not looking good.
I believe Toys R Us was a “canary in the coalmine” moment. It has placed those in the credit markets on a heightened alert and larger bankruptcy filings like that of iHeart Radio and Claire’s stores have only added to that fear. We will see peaks and valleys in
volatility as high profile names either succeed in their refinancing’s or don’t… This will spill into equity markets, creating the “fireworks” scenario I’ve been speaking about.
There is a reason I continue to point to Tesla’s debt burden, their cash burn of nearly a billion per quarter, having spent over $10 billion in cash with $10 billion in debt and no profit to show for it in the face of heightened competition from competitors like BMW, Mercedes (with nearly 36 manufacturers having an EV vehicles by 2020)… It, without question, has the potential to be a flammable situation.
This quote should forever be etched into your brains,
“This company going bankrupt is not a problem, it’s the solution,” says Cowen analyst Lance Vitanza”
NEVER underestimate a desperate CEO, greedy Wall Street Investment banks, corporate financiers, and brokers who get paid significantly more to SELL a “new issue or secondary offering” – recognize where the money is made and understand whom the “real” clients of an investment bank are…
I’ve made a few references in this note regarding my largest fear for markets today. The MOAB (Mother of All Bombs); People may or may not agree with me on TSLA, which is ok – it’s what makes markets. I would hope those playing with fire have a fire extinguisher close to mitigate their risk and prevent a potential fire from spreading, unfortunately, history suggests otherwise, which is why we preach capital preservation strategies and managing risk (always wear your seatbelt).
If, at some point, TSLA does file for bankruptcy protection, investment bankers or brokers will likely say, “you knew the risks, the bonds were rated Caa1” – they had a Junk bond rating. A filing would likely wipe away nearly $50-billion in equity value and billions more in bond value pending recoverable assets. That’s a fairly large number but it’s not considered “crazy talk” in this industry either. It would likely shock the system and ripple into other things, but again, it’s something people haven’t turned a complete blind eye to.
Here is a question that literally has me up at night; I can’t stop thinking about… What would be worse for financial markets, Tesla filing for bankruptcy protection or AT&T’s debt being downgraded? It initially sounds like a no brainer answer, bankruptcy v downgrade, but is it? Please read my follow on to this note, I’m going to give you a few days to digest this note, though; it should be emailed within a few days…
Lets talk China, Tariffs and Trade Wars…
China has been in the news quite a bit lately. The hot topic these days is “Tariffs” leading to possible “Trade wars”, I’ve now edited this section more times that I care to admit as every time I have suggested the “most recent” rhetoric “proposed” by the current Whitehouse administration, I’ve no more than blinked and have had to change the meaning of “most recent action”.
I’ll summarize; The White House suggests X, China has responded with an “if X then Y” equation.
This is a dangerous game of chicken for both sides to be playing given the current global economic situation at this point.
Yes, the US has a significant trade deficit, though; it’s not something that’s just happened overnight; nor by accident. Short memories quickly forgot a trade deficit didn’t exist until the mid 70’s. Up until the early 70’s, trade needed to be settled in gold and it wasn’t until a few years post Nixon’s abandonment of the Bretton woods agreement the trade deficit began. As the U.S. started running these large deficits wage costs were driven lower, corporate profits began to increase, resulting in larger bonuses for CEO’s. These deficits have evolved over time. The current global trade deficit is estimated to be around
$568 billion this year with nearly $1 billion per day deficit to China alone.
Today, our country is staring at trillion dollar plus budget deficits for as far as we can see, while starting Quantitative Tightening (QT) straight in the face; i.e. the Federal Reserve is no longer buying treasuries; in fact they are “selling them” in the form of no longer “rolling them over”; to the tune of $400 billion this year, $600 billion in 2019 and $600 billion in 2020.
Implementing policies, which, in turn, lowers the trade deficit, will also lower capital inflows to the country as capital inflows are a mirror image of the current account deficit; lower current account deficit equals lower capital inflows; lower capital inflows means less money to finance our much larger budget deficit which the current administration took on with both, the tax cuts and the February 9th spending bill. With the fed now tightening, this has the potential to become an extremely toxic environment for all parties involved (investors, the US and China). Please feel free to glance over this extremely captivating, riveting read from The Federal Reserve Bank of New York, 1998, speaking, in part, to the above.
China is by no means innocent here, as one would have a difficult time describing their trade policies as “fair”. We would absolutely support conversations to reduce trade barriers. However, spitting back and forth at each other is more than likely, rhetoric and not necessarily the best approach to be taking. Open conversation is good, a deal which could help protect U.S. IP (Intellectual property) from being stolen would be extremely beneficial to us, though an all out trade war could easily create a decline in access to foreign capital at a time when capital is needed the most. Foreign capital partially finances our budget deficit and is also a reason our interest rates have remained abnormally low for as long as they have; lower interest rates have propped up asset prices, housing and equity markets contributing to the wealth effect.
Neither China nor the U.S. is in a position to wage a trade war at this moment in time. After quite a few recent conversations regarding this matter, including a marathon with my father, I realized many still believe China is the go to, dirt floor 3rd world country for all things made cheap. While many items we use everyday are made in China at cheaper prices, a misconception exists. China has also become a hotbed for highly skilled labor, especially in the STEM (Science, Technology, Engineering and Math) arena.
Don’t take my word for it, please find perspective from Apple CEO, Tim Cook who works closely with China:
“There’s a confusion about China. The popular conception is that companies come to China because of low labor cost. I’m not sure what part of China they go to but the truth is China stopped being the low labor cost country many years ago. And that is not the reason to come to China from a supply point of view. The reason is because of the skill, and the quantity of skill in one location and the type of skill itis.”
And China has an abundance of skilled labor unseen elsewhere, says Cook:
“The products we do require really advanced tooling, and the precision that you have to have, the tooling and working with the materials that we do are state of the art. And the tooling skill is very deep here. In the US you could have a meeting of tooling engineers and I’m not sure we could fill the room. In China you could fill multiple footballfields.”
Cook credits China’s vast supply of highly skilled vocational talent:
“The vocational expertise is very very deep here, and I give the education system a lot of credit for continuing to push on that even when others were de- emphasizing vocational. Now I think many countries in the world have woke up and said this is a key thing and we’ve got to correct that. China called that right from the beginning.”
While no one can know for sure what is going through the minds of those in Washington, we would speculate.
Political Gain: Trump promised Tariffs: 45% on China and 35% on Mexico and up until recently he hadn’t kept his end of the bargain. Re-election campaigns are closer than any of us would like to think about.
The rise of the Chinese Yuan: We’ve been discussing the Chinese Yuan’s inclusion into the IMF’s reserve currency basket since 2015. The Yuan’s currency continues to strengthen as China’s global presence continues to expand. The Yuan has appreciated roughly 9% v the US dollar over the past year.
Chinese local A shares inclusion in the MSCI indices: Something we’ve talked about before MSCI’s official announcement and have benefited from this trend via our holdings in KBA and CAF among other investments. China’s “local A shares” have never been included in the MSCI’s index. The second largest economy in the world has never had representation in these indices. MSCI voted for inclusion last year, with the initial “partial” inclusion, taking place in June. The end result will be hundreds of billions to nearly a trillion dollars flowing into the local Chinese A-shares over the next few years.
This “inclusion” will begin June of this year.
Something important for investors to understand is the vast majority of mutual fund managers or (PM’s – Portfolio Managers)) are paid very lucrative bonuses based on their performance relative to their respective benchmark index (another dirty little secret of benchmarking to an index).
I recently heard the term “closet indexer” – it made me laugh – couldn’t be more true. Self-preservation is part of human nature. Most PM’s attempt to do nothing more than
mimic their respective benchmark as they don’t want to get fired should performance veer too far away from their “target”. If the benchmarked index is down big, so long as the PM’s performance is “close”, it’s not a problem for them, but what about for you? What if you’re ready to retire? What if the bear market doesn’t just disappear with the addition of more central bank intervention? What if markets perform more like the 1930’s or 1970’s with a decade of poor performance? Be aware of the “benchmark trap”.
There are instances where benchmark traps can help us as investors. For example, as MSCI begins to increase the ownership percentage of the Chinese local A-shares in their indices, those “closet indexers” will follow in suit and begin to push money into the local Chinese A-shares as to not stray too far away from the performance of the MSCI or respective index. The complexion of these “closet indexer” funds will begin to mirror the benchmarked index regardless of trade wars or tariffs. Again, this year’s inclusion is a mere fraction of what the final allocation will be.
We continue to talk “noise” vs. “bigger picture” and while a trade war is by no means your ordinary “noise”, we’ll follow the “bigger picture” until our capital preservation strategies tell us otherwise.
China’s new Oil futures exchange denominated in Yuan:
In my opinion, this is the most important thought of the aforementioned. Again, it’s something we’ve written on in the past and it’s worth noting that after numerous “false starts”, the “PetroYuan” is now very real, trading launched 3/26/2018. The “Petrodollar” creates an enormous demand for “dollars”, countries from all around the world convert their currency to U.S Dollars to pay for oil. With the “PetroYuan” now launched, any trading that occurs on China’s new platform will mean less demand for U.S. dollars.
Everything we’ve detailed about China from the IMF reserve currency basket, to MSCI inclusion to the now “PetroYuan” has happened over a 3-year span. These are some serious announcements in a very short period of time. While the impact may not be felt immediately, time, China is gaining significant traction against the U.S more quickly than anticipated. Tariff talk with China, tensions with Russia and a war with Syria whose current government is backed by both Russia and China are all front-page stories. I do not believe this to be coincidence.
From our December 1, 2015 note:
Without question, the U.S. Dollar is still the world dominant reserve currency, this is not up for debate, nor has it been in my previous notes. What is up for debate is now with the Chinese Renminbi (Yuan)
considered an official reserve currency for the IMF’s SDR basket, market share of the dollar amongst “World Settlements of goods and services” will begin to diminish. As market share erodes, demand inevitably decreases. While this will take some time, the speed at which it happens is more than likely faster than most anticipate.
As you can see, we mentioned the changes would most likely be gradual at first, yet “the speed at which it happens” is even faster than we anticipated. In less than two years, this could become one of the most important announcements of
the modern, global era, and in typical mainstream media fashion, this news, while mentioned, seems to be getting swept under the rug.
Additionally, there could be some much larger geo-political implications to this as it’s no secret there are some countries that don’t get along all that well with the US. Russia has worked with China for years now in an effort to minimize their use of the US dollar. As the Nikkei Asian
Review points out, oil exporters like Russia and Iran (even North Korea for that matter), could possibly skirt by U.S/UN Sanctions by trading their oil in Yuan and then converting it to gold (taking little to no Yuan currency risk).
China is the largest oil importer in the world, importing from countries all over the world; like it or not this will have a significant global impact over time; the question, which still remains, is when? Over how long a period of time will it take to become a major impact to the dollar? This is not something to sweep under the rug and definitely something to be aware of over the next few years.
I will reiterate:
This is not something to sweep under the rug and definitely something to be aware of over the next few years.
We see you…
Shares of FB fell during 1Q2018, it’s been all over the news. The fall has been tied to “data mining” by a 3rd party app, Cambridge Analytica. For those unaware, data mining is nothing more than collecting and aggregating data, then selling it to other companies. Meghan McCain, co-host of talk show “The View” has been quoted as saying,
“It happened under Obama, and it was lauded by the media as being genius. And now under the Trump campaign – it’s the Cambridge Analyica scandal”. “The View -Tuesday March 20, 2018”
She makes a point; and this may come as a shock (sarcasm), I think she and most talking heads are missing the crux of the issue or “the bigger picture”.
Politifact, hailed as an “independent fact check” website has rated this Megan McCain statement as a “Half True”. Politifact is as much a fact check website as snopes; “fact checking” based upon who is paying them, though, it’s easier for people to read a headline and cliffs notes as discussed last quarterly then spend time researching on their own (sensory overload). The “Half True” rating by Politifact lies in semantics and opinion (which frustrates the heck out of me as there is no room for “opinion” in a fact), the bottom line and facts are under both Obama and Trump data has been collected and distributed.
I find it a bit comical people are acting surprised by this; this isn’t news. Every single keystroke we make is recorded; this has been public information for years now. Whose gotten blasted harder by the media and whose repercussions were more severe, Facebook, Edward Snowden or the NSA? One tried to let us know we are being spied on; the other
two are doing the spying. (Hint; Edward Snowden had to flee the USA and is currently living in Russia, the NSA is still spying and Facebook is still collecting and selling data).
Wikileaks and Julian Assange have been telling people this for years while Hillary Clinton and other government officials have stated publically we should bomb Assange and kill him for such releases (It’s truly amazing how little we value human life these days). Mind you, Wikileaks has won in every court case ever brought against them and to date, none of the data released has ever been proven to be false, yet the focus has turned to [how dare you release such data, rather than we, those who are entrusted with running this great country, have lied and done some really bad, sick things that most would go to jail for, but it was all for your good.] SMH…
Data mining is big business, and countless companies do it; Facebook is just one of many, but while company’s like Facebook, Google and Amazon have businesses that will likely survive probable government intervention and regulation with advertising revenue exceeding that of data mining, other companies like Twitter makes as much, if not more selling user data to the tune of hundreds of millions per year (estimated $400 million this year alone in selling user data). Snapchat sells user data to advertisers as well, and just recently it’s been reported their latest “beta testing” has functionality much like the Facebook/Cambridge Analytica relationship. (Gasp, where’s the outrage?!)
Public Service Announcement, please be mindful of everything you say and do online, you are being watched and your data is being sold – you’ve given permission to these companies every time you click the user agreements no one ever reads. While Facebook’s stock has sold off, it’s still one of the most capital efficient companies in history. It’s a marketing behemoth with tremendous scale. Multi-million dollar businesses have been created by Facebook’s existence.
Markets don’t like uncertainty, they don’t like the government sticking its nose in things, people have been looking for an excuse to sell and take profits, and I suspect this news is that excuse. Our capital preservation strategy has yet to trigger, we are still long Facebook, but will respect our discipline and adjust accordingly should things change. No one with a pulse should be surprised by the “news” that your data is being collected and sold. If you are, please take some additional time to read the user agreements we so freely and quickly click on.
Conclusion:
Our thesis still remains higher highs this year, we maintain the belief that at some point, this won’t end well for many. Our “years to come” thesis revolves around the volume of debt that needs to re-price 2019-2021, met with rising interest rates, QT (Quantitative Tightening) from the federal reserve taken too far; coupled with a tapped out, over leveraged corporate and consumer borrower. Until proven otherwise, this volatility remains a correction in what appears to be a continuing “late stage” bull market. I’m not convinced we’ve seen the worst of what’s to come before the market resumes its march higher fueled by continued global central bank buying (remember, I said fireworks).
In my last quarterly, I pointed you to a book written by Reinhart and Rogoff, “This Time it’s Different: Eight Centuries of Financial Folly”. The basic gist lying in the title, spoiler alert”, it’s never different. I wanted to conclude with a deeper thought within the book,
and I may very well be misunderstanding this concept, but I don’t think so… Given all the Financial Folly over the centuries, I don’t believe there is a specific number or metric that anyone can point to. If I understand Reinhart and Rogoff’s “bigger picture”:
The ultimate “trigger”… Confidence – or lack thereof…
“The essence of the this-time-is-different syndrome is simple. It is rooted in the firmly held belief that financial crises are the things that happen to other people in other countries at other times; crises do not happen to us, here and now. We are doing things better, we are smarter, we have learned from past mistakes. The old rules of valuation no longer apply. Unfortunately, a highly leveraged economy can unwittingly be sitting with its back at the edge of ta financial cliff for many years before chance and circumstance provoke a crises of confidence that pushes it off.”
- This time Is Different: Eight Centuries of FinancialFolly
I wish I could tell you exactly how this will play out… We’ve had a fairly good run so far; we’ve been pretty accurate in speaking to things prior to them happening, but as I have said numerous times, no one has a crystal ball. We will continue to tirelessly study, read, research and seek out larger macro trends that have an ability to alter our thesis and how? If necessary, we will adjust our strategy based on any new information we come across. When facts change, we’ll be as fluid as we can and adjust as quickly as possible. I’ll leave you with a relevant quote.
I said empty your mind, be formless, shapeless, like water. Now you put water into a cup, it becomes the cup; you put water into a bottle, it becomes the bottle; you put it in a teapot, it becomes the teapot. Now water can flow or it can crash. Be water my friend. ~Bruce Lee
There is a lot of information in this note and yet, it feels unfinished to me. I don’t like leaving something I feel holds a great deal of importance out. Please take the time to read part 2 next week. It is a very important concept to understand which I why I have spent quite a bit of time on.
Please call with any questions or concerns, we are happy to help! Good Investing,
Mitchel
Mitchel C. Krause Managing Principal & CCO

4141 Banks Stone Dr. Raleigh, NC. 27603
phone: 919-249-9650
toll free: 844-300-7344 mitchel.krause@othersideam.com www.othersideam.com
** We are working on getting our flagship model’s numbers audited from a performance standpoint. In opening our new firm (OSAM), performance will only be able to be officially audited as far back as the complete sets of statements we receive from clients. This may remove data points from our official numbers upon audit completion affecting 2016’s reportable performance number.
Disclosure: The commentary, analysis, references to, and performance information contained herein, except where explicitly noted, reflects that of Other Side Asset Management, LLC, a registered investment adviser. Opinions expressed are as of the current date and subject to change without notice. Other Side Asset Management, LLC shall not be responsible for any trading decisions, damages, or other losses resulting from, or related to, the information, data, analyses or opinions contained herein or their use, which do not constitute investment advice, are provided as of the date written, are provided solely for informational purposes and therefore are not an offer to buy or sell a security. This commentary is for informational purposes only and has not been tailored to suit any individual. References to specific securities or investment options should not be considered an offer to purchase or sell that specific investment. Other Side Asset Management, LLC does not guarantee the results of its advice or recommendations, or that the objectives of a strategy will be achieved. Performance shown herein should in no way be considered indicative of, or a guarantee of the actual or future performance of, or viewed as a substitute for any portfolio invested in a similar strategy.
Performance data shown represents past performance, which does not guarantee future results. Investments in securities are subject to investment risk, including possible loss of principal. Prices of securities may fluctuate from time to time and may even become valueless. Securities in this report are not FDIC-insured, may lose value, and are not guaranteed by a bank or other financial institution. Before making any investment decision, investors should read and consider all the relevant investment product information. Investors should seriously consider if the investment is suitable for them by referencing their own financial position, investment objectives, and risk profile before making any investment decision. There can be no assurance that any financial strategy will be successful.
All data presented is based on the most recent information available to Other Side Asset Management, LLC as of the date indicated and may not be an accurate reflection of current data. There is no assurance that the data will remain the same. This commentary contains certain forward-looking statements. Forward-looking statements involve known and unknown risks, uncertainties and other factors, which may cause the actual results to differ materially, and/or substantially from any future results, performance or achievements expressed or implied by those projected in the forward-looking statements for any reason. No graph, chart, or formula in this presentation can be used in and of itself to determine which securities to buy or sell, when to buy or sell securities, whether to invest using this investment strategy, or whether to engage Other Side Asset Management’s investment advisory services. In addition to the Other Side Asset Management’s advisory fee, overall returns may be reduced by expenses that an investor may incur in the management of the investor’s account, such as for custody or trading services, which will vary by investor and may exceed the trading costs reflected herein.
Please find below a complete list of hyper-links referenced in this piece. Each hyper- link will launch you to the respective article or report referred to:
Dow plunges 331 points as oil falls below $50 – CNN Money Dow plunges 391 points as fear grips markets – CNN Money
January 2016 Stock Market Review: The Bear Awakens? | See It Market
Yardeni Research – click here Hyponatremia
iHeart Radio – per the Wall Street Journal Tesla 76,230 cars in 2016
Bloomberg has recently reported – Tesla model 3 production
The Federal Reserve Bank of New York, 1998
China perspective from Apple CEO, Tim Cook:
please find perspective from Apple CEO, Tim Cook who works closely with China:
local A shares inclusion in the MSCI indices
Politifact – “Half True”
Snapchat – reported

