
In This Article

Please accept our apologies! Hero to heel in just under a week… Education by Headline… Here we go again… Can a boiling frog parable teach us anything about “New Normals”? Defining “bad” in a strange world. Cloudy with a chance of Meatballs…
Our Apologies!
Under normal circumstances, we make all efforts to provide you with our quarterly note as quickly, post quarter end, as possible; admittedly, this is not a normal circumstance.
Many of you are now aware that I have resigned from my position at Stifel; while not an easy decision, I once again refer to a familiar quote from former Notre Dame President Theodore Hesburgh:
“My basic principle is that you don’t make decisions because they are easy; you don’t make them because they are cheap; you don’t make them because they are popular; you make them because they are right.”
The time has come to create my own asset management firm. We had been advised to hold our quarterly until the firm had received regulatory approval, which we now have.
Other Side Asset Management was born with the above principles in mind. The novel idea of voicing all sides of the investing story to the client. After nearly 22 years, viewing this business from many different angles, my humble opinion is that very few people even realize there is a story to be told other then the very lopsided narrative that’s been “sold” to investors over time. Those who have read past notes understand what I mean, for those who may be newer, or you just don’t take the time to read these in their entirety I humbly and respectfully ask that you take a few minutes to read these quarterlies.
If nothing else, these notes more than likely bring a much different perspective then what you are most likely hearing elsewhere. I am appreciative and thankful for each of you; we welcome you to Other Side Asset Management.
Merriam-Webster defines Fickle:
adjective fick·le \ ˈfi-kəl \
: Marked by lack of steadfastness, constancy, or stability: given to erratic changeableness
After nearly 22 years in the financial world, I have yet to decide whose more fickle, “markets” or “investors”?!
2017 was a good year for us as well as markets… Let’s get into the numbers and our thoughts.
2017 YTD for the S&P
21.83% Total Return
19.42% Performance Return
2017 YTD for the DJIA
28.11% Total Return
25.08% Performance Return
2017 YTD for our Equity Solutions Model
21.11%** Total Return
18.93%** Performance Return
Hero to Heel
On November 30th, the S&P’s YTD numbers surpassed our models for the first time in nearly 2 years. I was quickly made aware of this by a few clients/friends (glad they’re looking closely). During these conversations, I casually noted that I have a fairly intimate familiarity with the model and how it is performing relative to major indices – I was well aware of the numbers.
I was also conscious of the primary cause of the model’s brief underperformance; a sell off in many of our technology names as the month of November came to a close; this included our Chinese tech holdings. Gold and precious metals saw weakness over this time frame as well. Yet, the only core holding we exited was HCN and we did rebalance OSTK (a “special situation” name) a bit sooner than usual, as it is extremely volatile and had moved from a 1.58% position in the portfolio to nearly a 3% position very quickly (roughly two months).
It’s been my experience that very few things go straight parabolic. While some are quick to point to the slight underperformance, I am more comfortable today, having experienced this recent “breather” than I was prior to the pause. In my humble “opinion”, it’s healthier for the overall portfolio moving forward. We have held cash on hand since inception of the model – anywhere from 12 to 38% (at times in 2016) yet, our performance has been “in line” or exceeded the S&P while assuming significantly less risk.
While the goal is to not be over weighted in cash, as we follow our disciplines and capital preservation strategies, we may see more cash on hand at times of extreme market turbulence; during those times, we maintain a “shopping list” of names we are interested in buying at cheaper prices. However, just because we are in cash, it doesn’t mean we throw money at names in extremely volatile markets. We make our best efforts to be prudent in preserving our capital should sell offs get exponentially worse. Currently our cash position sits around 15%.
Education by headline…
As investors, we are conditioned to benchmark ourselves to indices; which may not necessarily be healthy to do. From Peak to Trough (2007 – 2009), The S&P was off nearly 53% while finishing 2007 “up” 5.49% with 2008 being down (-37%). I’m guessing most who watched their portfolios fall 50% or more during that brief time period weren’t fist pumping ala Kirk Gibson’s 1988 World Series walk off home run against the A’s (game 1).
Most dinner party conversations weren’t, “markets down 53%, I’m only down 50% – I’m killing it!” At the point markets were down in excess of 50%, most investors were too scared to open their statements, many made bad, uncomfortable jokes re-naming their 401k a 201k (as its market value was cut in half – get it – yeah, I didn’t think it was all that funny back then (or now) either).
A snapshot in time doesn’t always tell the full story; nor does a headline!
However, according to a study by the American Press institute dating 3/17/2014, nearly 6 out of 10 Americans admit to do nothing more than read and digest information based upon a news headline; as reported by the Washington Post; 3/19/2014.
Columbia University in partnership with the French National Institute published a formal study as recently as June of 2016, which can be read here1 echoing the 2014 American Press study, though taking a more in depth look at social media “shares”, concluding that nearly 59% of links shared on social media have NEVER been clicked.
Why is this important and why the mention in this Quarterly?
From the time we are little, we spend years being “taught”, but do we ever really “learn”, or merely follow what we are told? We sit in classes, science, math, history, though are we ever taught to “question”? Are we sincerely learning or merely being conditioned to believe and regurgitate a one sided narrative?
I vividly remember a conversation with an institutional client years ago. He chuckled as I reported his execution price of $14.92 on a particular trade – I didn’t understand what was so funny or why he was laughing? “1492 Columbus sailed the ocean blue”, he sang (he literally turned it into a melody). “You know, the guy who discovered the new world” – he proceeded to lecture me as if I was an idiot for not picking up on his “history reference” while reporting his trade – clearly, his trade was the only thing I had to do all day – I had nothing else going on (sarcasm), though I digress…
While my mind was simply in a different place, after a brief second what I wanted to say was, The American Indians might disagree you arrogant *&#^%*. Yes, a simple Google search of “Who discovered the United States” yields none other than Christopher Columbus – and schools teach the importance of Columbus – we continue to celebrate a holiday every year in his name, However, many historians would vehemently argue and have detailed the American Indians already being here before Columbus set foot on shore (you don’t say?!)… Yet, the narrative we continue to teach and holiday we continue to celebrate hasn’t changed.
It’s important to examine all sides of the story, in all facets of life; though it’s difficult to understand another viewpoint if we are so entrenched and conditioned to believe there are only certain ways to do things, this includes how we manage our portfolios; which leads us to…
Here we go again…
I don’t sleep much. I take the responsibility of handling other people’s money and retirements extremely seriously. When Fed officials like Janet Yellen say things that simply don’t make any sense – it creates countless sleepless nights and days of a head scratching moments for me. Though, I have yet to figure out if I’m more perplexed by what she says OR that people actually believe her (the importance of people just believing the headline or legitimately reading and understanding what was actually said)?!
“Correlation is not Causation”: Translated: This time it’s different…
Mid-December, former Fed Chair (as of tomorrow), Janet Yellen, provided markets with some parting thoughts and insight. You can read the transcript in full here, I would welcome it – maybe you would feel the same way I do at this moment in time? I have highlighted some of my favorite talking points/quotes and added commentary below.
In reaching out to many of you regarding some of the most important leading indicators to be mindful of when measuring the overall strength and health of both the economy and markets, at the top of our list is an inverted yield curve (when the spread between the 2-year and 10-year treasury is negative). An inverted curve has been one of the most reliable leading indicators in predicting recessions and market crashes post WW2; it has preceded the past 3 recessions…
While Fed Chair Yellen noted and acknowledged this relationship, she then decided to tap dance around the heart of the issue:
Yellen:
“Now there is a strong correlation historically between yield curve inversion and recessions. But let me emphasize that correlation is not causation… and I think there are good reasons to think that the relationship between the slope of the yield curve and the business cycle may have changed.”
Commentary: Translated: This time it’s different, my guess is Carmen M. Reinhart & Kenneth S. Rogoff’s 496 page book titled “This Time is Different: Eight Centuries of Financial Folly”, published by Princeton University Press © 2009 would disagree. You can read the 5 page abstract here or purchase the book here… Again, I urge you to at minimum take a look at the abstract to bolster your understanding of this relatively self-explanatory headline:
“When You Hear “This Time Is Different,” Don’t Walk, Run”
It shouldn’t require much reading between the lines…
Yellen:
“Look, at the moment, the U.S. economy is performing well, “Yellen said. “The growth that we are seeing, it’s not based on, for example, a unsustainable buildup of debt, as we had in the run-up to the financial crisis.”
Commentary: Is she seriously out of her mind? Are people really buying this #&*^?
Global debt has soared to over $225 trillion(representing a record 324% of global GDP). The above footnote would come from a private newsletter you would be unable to open, and as I do my best to footnote facts and figures, let’s try it this way; nearly a year ago the IIF (Institute for International Finance) released their January 2017 report stating the first 9 months of 2016 saw Global debt increase by $11 Trillion dollars to a record of $217 trillion (As reported by Zero Hedge). Should you question my $225 trillion number – a record high of $217 Trillion was reached October 2016 – should you believe there has been no additional global debt issued over the last 5 quarters I might just have a bridge to sell you?
How is this NOT an unsustainable buildup of debt? How is this not dangerous, especially in a rising interest rate environment with the fed allowing nearly $400 billion of debt to “roll off” its books?! That’s a $400 billion dollar buyer disappearing at a time when the treasury anticipates borrowing over $955 billion (nearly double that of 2017 $519 Billion) who steps in to absorb this supply? Just think about what happens as interest rates rise and this debt needs to be refinanced at higher levels – think about a company or government’s ability to service the debt, let alone, repay it!
Yellen continues:
“We are in a synchronized expansion, this is the first time in many years that we have seen this,” Yellen said.
Commentary: We are in the midst of “synchronized” global central bank intervention, which the world has never seen before. This has created a mountain of debt that dwarfs what some might seem as fathomable. What in the name of all that’s holy is this woman talking about –
-
The
central bank of Switzerland has created nearly $1 trillion of
currency over the past 3 years, is purchasing assets around the
world (including shares of US stocks in the form of indexes (which
are mostly market cap weighted)) which last year generated nearly
$55 billion in interest payments, dividends & currency
appreciation.
- They own nearly $250 billion in US equities
- Their balance has been used to purchased European bonds artificially driving yields down (including high yield/junk paper)
- And the Swiss bank is one of the smaller central banks intervening
- The central banks of Europe and Japan have purchased more than $2 trillion of assets…
- The ECB has been purchasing high yield debt driving yields on European “junk” bonds below that of the U.S. Treasury in certain instances throughout 2017
- The balance sheet of the US Federal Reserve has ballooned from $800 billion to more than $4 TRILLION over the past 9/10 years
The above are documentable statements, which the headlines don’t tell you…
You heard the Fed Chair – our growth is clearly not due to an unsustainable debt buildup like the one that led to the worst financial crisis since the great depression; nothing to see here… Carry on!
A Boiling Frog & “New Normals”
Can a boiling frog parable teach us anything about “New Normals”?
Have you ever heard the parable about the boiling frog? The story goes something like this… If you place a live frog in a pot with room temp water then proceed to add a slow, gradual heat, the result will yield a boiling frog rather than the frog jumping out of the water to save it’s own life. The premise is the cold-blooded creatures body temperature adapts to its environment to a fault. As the frog’s body temperature adjusts with the water, there comes a point in time where the frog becomes too uncomfortable, wanting to save itself and jump out; however, it has lost its ability to jump and has succumbed to the now boiling water. Wikipedia will tell you this story is false and references a few obscure websites, and yet some other sites and YouTube videos take the other side of this argument. Having just discussed questioning everything, I’m not here to argue the parable – nor do I have time or care to buy a frog for sacrifice. The point here is the underlying premise behind it parable.
We’ve all become complacent, watching historical anomalies become new “new normals”. Ideas once thought to be absolutely off the wall NUTS have slowly, over time, become acceptable. Though, if we all take a step back and think about aspects of our current economic environment, in isolation, one can’t help but wonder how in the name of all that’s holy have we allowed ourselves to get here. Simply put, we, collectively, are the “frog”, the flame has been lit for quite sometime and the water has been getting warmer and warmer with each passing day and we are dangerously close to being unable to jump out of the near simmering water.
What historic anomalies you ask?
For just a moment, lets think about the idea of negative interest rates, in isolation… Handing someone your hard earned money with the idea that they can use your money as they wish, with no restriction, giving you back less, at a defined time frame in the future. Seriously – why would anyone in his or her right minds do such a thing? Why would you ever guarantee yourself a loss? Why wouldn’t you hold cash? Gold? What would you do?
Think about High Yield Bonds yielding less than US treasuries. (Public Service Announcement; “High Yield Bonds” = JUNK BONDS, they are synonyms) Michael Milken ring a bell? The ECB, along with the Swiss National Bank and others have created an artificial supply/demand game having bought so many European bonds (including Junk bonds) that some have had yields less than that of the US treasury at different points in time throughout 2017.
I don’t know how to emphasize this enough – just about everyone in the world of finance considers US treasuries to be “risk free” – (now, I would argue that a country with $20 Trillion in debt and arguably exponentially more in unfunded liabilities could never be considered “risk free”, again, I digress) Junk bonds should not yield less than the U.S Treasury bond OR the U.S Treasury bonds should not be considered risk free, both cannot hold true if markets were “normal”.
In isolation, these thoughts are flat out crazy, yet academics at the Fed (those who apparently fail to learn from history) continue to argue that this is acceptable, as yellen inferred above, it’s simply just another “new normal”. (These are the same PHDs who walked the halls of the Fed and failed to spot the cause of the worst recession since the great depression). They were all smacked over the back of the head with a cinder blocks – no one saw it coming.
Defining “Bad” in a Strange World
How do we define “bad” in a strange world?
Our society has come to rationalize these behaviors as normal for they have yet to manifest themselves in terms of how people traditionally measure something “bad” happening in the economy. When you ask people how the economy is doing some will say – unemployment numbers look good, others would suggest GDP is up – though most speak of their 401k. 401k’s are up – clearly nothing is wrong; the measure of “good” or “bad” in the economy has become, by in large, performance of the equity markets.
To paraphrase a brilliant wall street, Grant Williams, We are conditioned to believe “bad” only exists by measure of a route in stock or bond market – so in the minds of most we’re currently ok as the barometer that people typically understand has yet to become quantifiable…
As markets reach record highs (which is just about daily lately), people either a. are educated by headline not realizing these mounting economic absurdities exist b. are trusting individuals and believe the Fed Chair when she suggests our growth has not been fueled by absurd amount of debt or c. They accept and trust that this time may be different as we are watching the birth of a new “sustainable” normal?
“History” has proven time and time again, that things like this have a habit of not mattering to anybody until they seemingly matter to everybody. At which point it’s typically too late to do anything but point fingers as the “blame game” takes center stage.
We are living in a strange world…
In what world would a company be able to spend nearly $8 billion dollars in a single year on “digital content” without having made a profit over the previous 5 years?
OR
Can a relatively young electric car manufacturer lose roughly a billion dollars per QUARTER, has never earned a profit, recently raised nearly $1.8 billion by selling JUNK rated paper at roughly a 5% yield – yet still has a larger market cap than multi generational car manufacturer’s General Motors or Ford? Where a company has a cash burn rate of nearly $1 billion per quarter, and is likely to rely on capital markets once again, prior to 2Q2018.
Would a normal world allow a wireless telecom company to increase their debt load in excess of $250 billion in an effort to fund an overpriced acquisition? That’s a quarter of a Trillion dollars for a publically traded company! Mind you, takeover aside; they currently carry nearly $170 billion in debt in a highly competitive market where price wars are the norm. (what could go wrong?!)
I believe there is no better “independent” research company than Stansberry Research. They publish a FREE report Monday through Friday named Stansberry’s “Digest”, (yes, they use this platform to sell their paid subscriptions, yet this free newsletter should be required daily reading for all serious investors as should the rest of their publications.
I typically begin collecting data for my quarterly notes as soon as the previous quarter comes to a close. My outline begins to take shape a good month before quarters end and this quarter was no different. I had gathered talking points from numerous locations; Then came Stansberry’s December 11th Digest– rather than re-write my piece, I respectfully footnote and credit them for the below list of what else “might” be considered anomalies in any other period of history.
- European high-yield (or “junk”) bonds traded at yields below 2%, and yielded less than U.S. Treasury debt for the first time on record…
- Argentina – which has defaulted on its debt no less than eight times – sold 100-year bonds yielding less than 8%, and investors couldn’t get enough…
- U.S. corporations sold a record $1.75 trillion in bonds…
- Volatility on the benchmark S&P 500 Index plunged to the lowest levels on record…
- The market caps of the super-popular “FANG” stocks – Facebook (FB), Amazon (AMZN), Netflix (NFLX), and Alphabet (GOOGL) – grew by more than $1 trillion and counting…
- An 18,000 sq. ft. penthouse apartment in NYC recently sold for over $200 million dollars
- A SINGLE Leonardo da Vinci painting, ONE painting… Just last month, sold for a massive $450.3 million, setting a new all-time record.
The above bullets don’t even touch on the mounting Consumer Debt crises having recently reached another record high; both auto and consumer credit card loans have each surpassed a trillion respectively – student loans are nearing $1.5 trillion… you get the picture.
“Bad” and “irrational” seems to be happening all around us and while few are taking notice; there are some highly intelligent managers who are…
“Bond God” Gundlach sees negative returns for 2018
“My prediction for 2018 is that the S&P 500 will have a negative rate of return,” Gundlach said during an investor webcast on Tuesday. “It may go up 15% in the first part of the year, but I believe when it falls, it will wipe out the entire gain of the first part of the year and end with a negative sign in front of it.”
Now – there are very few certainties in this business, but here’s one you can take to the bank. No one – not Jeff Gundlach nor former bond king Bill Gross, not Ray Dalio or little ole me… Not a single person definitively knows how markets will finish tomorrow, let alone the year. We can hypothesize and formulate our opinions all we want, we can argue talking points and data, but the reality is no one knows exactly if/when this shoe will drop or how long the bull market can be prolonged… This is yet another narrative investors place too much emphasis on.
Cloudy with a Chance of Meatballs?
I recently watched the above titled movie with my daughters; it’s a cute movie with some much deeper “life’s lessons” then your average animated movie. I would say “kids” movie, but I can think of quite a few adults who could learn some things from it if they watch it with an opened mind. The movie got me thinking.
If the weather report suggests a 20% chance of rain tomorrow, how many people would carry their umbrella? Be truthful – the answer is virtually no one. Human behavior suggests most people either round large probabilities up to 100% likewise, they round small probabilities down to 0%; but if it actually rained, most people would more than likely be upset with the weatherman! Everything from they are always wrong, to they don’t know anything, the probability of rain should have been greater as it rained, the list of complaints is typically endless. The weatherman told you it “could” rain, it was you who made the decision to leave the umbrella at home based upon your discounting the 20% as zero – or it was just a chance you were willing to take. So is the weatherman to blame or the individual who discarded the small percentage?
The same often holds true with financial markets; if I “suggest” the odds of equity markets being up in 2018 were 80% and they ended the year down, most people would completely discount the 20% as 0. Now, suggesting there is an 80% chance of markets being higher isn’t all that much of a reach. Markets have been positive 80% of the time since 1970; so most investors leave their umbrella’s at home.
Our Q3 note spoke about some of the brightest investors in the investing world debating the current state of financial markets – the crux of my observation at the time was none of them know exactly what will cause the next crisis nor when it will happen, yet it’s what they all fixate on: From our Q3 note:
The first constant: The absolute best of the best, the smartest of the smart, those presenting or in the audience, regardless of conference I was at, constantly asked a singular thing. The question can be phrased countless ways, yet it usually boiled down to one simple word, “When”? When do you see markets crashing? When do you see inflation rising? When do you see interest rates moving higher? When will all the debt on the BOJ’s (Bank of Japan) balance sheet come to roost? What’s your timing on all of this going down?
When simplified, the question was always, When, WHen, WHEn, WHEN?!! The answer, is inevitably boiled down simply to, “I don’t know”?
The second constant focuses around, what I found to be the highlight of multiple conferences for me, which was a debate between James Grant and Jeremy Grantham, two brilliant minds of the investing world. I won’t give away anything from the conference; merely point to a high level observation. The debate was titled “Resolved – It Actually Is Different This Time”. Two Scholars laying out there cases for the current market landscape and what the near and long term future holds for investors in financial markets? Both men have called major market events prior to “said events” coming to fruition – yet on stage, these walking financial encyclopedias had a completely two completely different outlooks (hence a debate – wouldn’t be much of a debate if they both agreed, right?)
Let me summarize these two observations! All the best, most intelligent investors wanted to know from their presenting peers was, “when they foresaw something happening” and even the smartest can’t agree.
This mentality permeates the investing community and trickles down to the individual investor – it seems like everyone focuses on spotting Bigfoot or a rainbow colored unicorn. Sure I’d love to know exactly when the markets will collapse – I’d love to know exactly what stocks will be the absolute best performing names year in and out; I’d also love to know the winning lottery numbers to the next $500 million pot, it’s just not realistic.
So what if we reframed our thinking with the understanding that we more than likely won’t call the next exact top. What if we prepare for either scenario and attempt to set your portfolio up to take advantage of markets should they continue to move higher – while having a fairly good plan should downside come sooner than anticipated.
Exploring small, asymmetrical investments laddered out into heart of the largest amount of debt being re-financed in what appears to be a seemingly rising interest rate environment could create a bit of a hedge in today’s environment, allowing for a greater on base percentage. (Outside of something cataclysmic happening)
At this moment in time, my model does NOT make the asymmetrical investments laddered out for numerous reasons, though, I’d love to talk with each of you who follow my model regarding things we may be able to do in an effort to address this.
Calling a top or bottom on markets shouldn’t be the driving force in how anyone “manages” a portfolio properly, yet the gambling mentality described above is most often how investors address their financial assets; which tends to be reflected in their results.
A final thought on calling tops and bottoms… While we don’t believe predicting exact tops and bottoms to be a reliable “investing thesis”, we clearly make a strong effort to understand the crux of what we believe are market driving forces which often, in turn, what creates the top and fuels the eventual sell off. As I make final edits today, markets are selling off hard, has the top already been set? No one knows for sure, but understanding the internals allows us to be more prepared then most.
It is virtually impossible to predict the lengths at which governments and central banks will intervene; which makes it impossible to understand exactly how large investors will react to “said” intervention. While some tremendously honest, unbiased and incredibly intelligent analysts can tell you how absurd GE’s balance sheet manipulation has been over the last 20 years, It’s taken nearly 20 years for the bones to fall out of the closet. Very few could foresee the extent to which the government and investors would go to in an effort to bail out management and institutions.
Following the crowd is not always a good thing. Understanding the “Other Side” to the story is often more important and very telling.
Having said all that…
We’re in a “similar” camp to Gundlach, though, we disagree on timing… 2018 will more than likely bring us fireworks – increased volatility (as seen today) – higher highs with less likelihood of lower lows (there is still a chance though so don’t discount it to zero). Our thoughts, again, are deregulation and tax cuts (to a minor extent) will “help” stoke this seemingly raging bull market. Though, the primary fuel on the global markets fire will continue to be intervention and asset purchases from Central Banks around the World (Swiss National Bank (SNB), Bank of Japan (BOJ), European Central Bank (ECB), et. al.)
While an inverted yield curve has been an extremely reliable leading indicator for both recessions and market sell offs, we note the curve has yet to invert (regardless of how close it may be).
It’s also worth mentioning that in previous years where the yield curve has inverted, markets did not retreat immediately; in most cases, it took nearly 12-18 months POST inversion for the sell offs to begin.
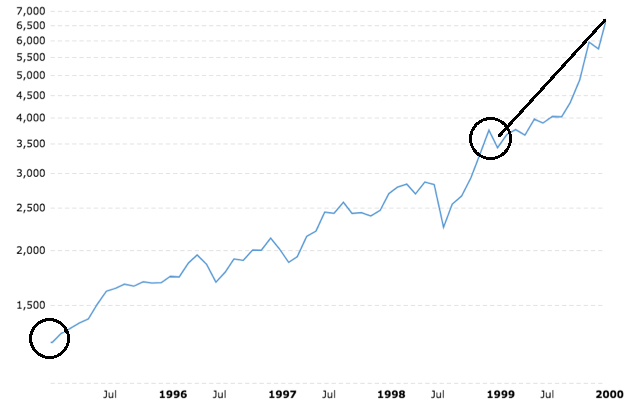
While this bull market is getting a little long in the teeth, most bull markets tend to end in a ball of fury with explosive gains coming in the final months, which we haven’t seen just yet. An example of this would be the Nasdaq being up nearly 203% from January 1995 (1,238.53) – January 1999 (3,758.84). Surely the Nasdaq was out of steam, right?
Wrong – the Nasdaq soared over 80% in just over a year, from January 1999 (3,758.84) to February 2000 (6,819.59) – with some individual names up 300 + % over the same time frame.
Interest rates have been and will likely continue to move higher over the year as the largest net buyer of bonds over the previous 10 years (The Fed) continues to accelerate their taper. It will be interesting to see how much of an appetite institutions have for bonds at these interest rate levels or if they will demand more “return” for the incredible risks that are being taken; higher borrowing rates will more than likely be the spark that sets this house of match sticks ablaze.
In previous notes, we’ve talked ad nauseam as to how much corporate and Global debt will need to be refinanced over the next 4-5 years (nearly $1.5 Trillion domestically). A spike in interest rates could easily double debt servicing loads for many companies which would hit those on the cusp of a junk rating (BBB) especially hard. Even still, history and current market characteristics don’t lean to 2018 being a negative year.
My belief is history provides us with strong enough evidence which sets the stage for an explosive 2018, though, as I wrote in our Q2 note “Dark clouds loom in the distance”; and they still do, this hasn’t changed. As noted above, deregulation, the tax bill and global central bank purchases (sans the US) may temporarily hold them at bay for a moment; and while the question for most is: for how long? We suggest a different approach.
We believe it’s important to manage money with humility, leaving ego at the door, taking the “what if I am wrong” approach to the model. So lets… Currently, the volatility of our portfolio is less than that of the S&P, additionally; we have nearly 15% cash reducing the volatility further. As the S&P falls, we too will fall, though we know exactly at what levels our capital preservation strategies kick in. In maintaining our discipline – volatility of the model decreases, as the markets get weaker. This outcome should hold true regardless of when a sell off occurs.
What becomes increasingly interesting is if we are correct that overloads of debt in a rising interest rate environment becomes the root cause of the next financial disaster and is what sparks this oncoming inferno, high yield bond managers, balanced portfolio managers; lets just say any portfolio manager who holds any bonds will need to raise money for redemptions. Bond markets will become tremendously inefficient, my guess is worse than late 2015 when bond funds who called liquidity fears a “myth” were frozen, (ala Third Avenue’s High Yield fund) among others.
These managers will be forced to sell what they can, not what they want to. They will have to sell their higher-grade bonds, as these bonds are what will most likely provide more liquidity. Stocks will also hold more liquidity, including gold stocks; so while gold is typically a hedge, and we own some gold names, I am a touch skeptical of the hedge working as designed until the liquidity crunch slows and the rotation comes back to hard assets, though I’d rather take that chance with a proper position size in the portfolio.
Below, please find a few bullets, which should allow us to take advantage of a blow off bull market top, yet protect ourselves from what is most likely, to come (either sooner, as Gundlach anticipates, or later, as I anticipate)?
- Understand greater risk does NOT equal greater reward! The greater risk = greater reward thinking is a fallacy. You do NOT need to take on more risk to achieve a significant return
- Reduce your risk. If you were up 35% last year, you are more than likely taking on too much risk; adjust your mindset as well as your portfolio
- Adjust your position sizes based upon volatility (i.e. own MORE 3M, less JD.com)
- Have an investment plan to follow; don’t allow emotion to make the decision for you. A plan like this will allow you to understand and protect your downside FIRST – Understand your pain tolerance before a sell off begins…
- Be disciplined, you can always get back into a name assuming it survives
- Look for asymmetrical risk reward setups as hedges (***see below)
- Have a shopping list of high quality names you’d like to own at cheaper prices
**NOTE: Different types of accounts may have restrictions as to what you may or may not be able to own within those accounts. For example, you typically can’t “short” a stock in an IRA. Look for alternate solutions. These alternatives are not something I can currently do within the discretionary model and need to be addressed on an account-by-account basis.
***NOTE: You don’t buy hurricane insurance while staring down a category 5 storm – hedge yourself when volatility remains low, hence a lower “premium” – this trade is likely to go against you from the very start, it’s the nature of a hedge. File these hedges away as you would the premium on your term life insurance policy; you’re not upset when you buy term life insurance and it doesn’t pay off – your happy that your family was protected if lord forbid something happened to you, but you’re more happy to be alive. These hedges should be approached with the same mindset. The investment in these hedges should be so nominal that if it fails, it doesn’t hurt (it’s failed for a reason and you’ve profited on the upside to cover the failure) – yet, if it wins, it’s designed to cover what your capital preservations strategies don’t.
While I’m not trying to pull a page out of Apple’s old marketing book, in times like these, Think Different is more an asset than a liability.
A quote tied to Mark Twain has floated around for years after his death so while the quotes origin is at times questioned, it’s meaning could not be more poignant at this moment in time regardless of who said it, “history does not repeat itself, but it often rhymes.”
Please call or email with any questions or concerns…
Good investing
Mitchel Krause
Mitchel C. Krause
Managing Principal and CCO
Other Side Asset Management
4141 Banks Stone Dr.
Raleigh, NC. 27603
Phone: 919-249-9650 Fax: 919-249-9645
Toll Free: 844-300-7344
Mitchel.Krause@Othersideam.com
Disclosure: The commentary, analysis, references to, and performance information contained herein, except where explicitly noted, reflects that of Other Side Asset Management, LLC, a registered investment adviser. Opinions expressed are as of the current date and subject to change without notice. Other Side Asset Management, LLC shall not be responsible for any trading decisions, damages, or other losses resulting from, or related to, the information, data, analyses or opinions contained herein or their use, which do not constitute investment advice, are provided as of the date written, are provided solely for informational purposes and therefore are not an offer to buy or sell a security. This commentary is for informational purposes only and has not been tailored to suit any individual. References to specific securities or investment options should not be considered an offer to purchase or sell that specific investment. Other Side Asset Management, LLC does not guarantee the results of its advice or recommendations, or that the objectives of a strategy will be achieved. Performance shown herein should in no way be considered indicative of, or a guarantee of the actual or future performance of, or viewed as a substitute for any portfolio invested in a similar strategy. Performance data shown represents past performance, which does not guarantee future results. Investments in securities are subject to investment risk, including possible loss of principal. Prices of securities may fluctuate from time to time and may even become valueless. Securities in this report are not FDIC-insured, may lose value, and are not guaranteed by a bank or other financial institution. Before making any investment decision, investors should read and consider all the relevant investment product information. Investors should seriously consider if the investment is suitable for them by referencing their own financial position, investment objectives, and risk profile before making any investment decision. There can be no assurance that any financial strategy will be successful.
All data presented is based on the most recent information available to Other Side Asset Management, LLC as of the date indicated and may not be an accurate reflection of current data. There is no assurance that the data will remain the same. This commentary contains certain forward-looking statements. Forward-looking statements involve known and unknown risks, uncertainties and other factors, which may cause the actual results to differ materially, and/or substantially from any future results, performance or achievements expressed or implied by those projected in the forward-looking statements for any reason.
No graph, chart, or formula in this presentation can be used in and of itself to determine which securities to buy or sell, when to buy or sell securities, whether to invest using this investment strategy, or whether to engage Other Side Asset Management’s investment advisory services.
In addition to the Other Side Asset Management’s advisory fee, overall returns may be reduced by expenses that an investor may incur in the management of the investor’s account, such as for custody or trading services, which will vary by investor and may exceed the trading costs reflected herein.
Some headlines have been slightly modified, shortened, broken into multiple levels in order to fit our Web-based table of content – early PDFs are all in original form as they have no hyperlinked Table of Contents…
Legal Information and Disclosures
This memorandum expresses the views of the author as of the date indicated and such views are subject to change without notice. Other Side Asset Management, LLC. has no duty or obligation to update the information contained herein. Further, Other Side Asset Management, LLC. makes no representation, and it should not be assumed, that past investment performance is an indication of future results. Moreover, wherever there is the potential for profit there is also the possibility of loss.
This memorandum is being made available for educational purposes only and should not be used for any other purpose. The information contained herein does not constitute and should not be construed as an offering of advisory services or an offer to sell or solicitation to buy any securities or related financial instruments in any jurisdiction. Certain information contained herein concerning economic trends and performance is based on or derived from information provided by independent third-party sources. Other Side Asset Management, LLC.. (“OSAM”) believes that the sources from which such information has been obtained are reliable; however, it cannot guarantee the accuracy of such information and has not independently verified the accuracy or completeness of such information or the assumptions on which such information is based.
1 Maksym Gabielkov, Arthi Ramachandran, Augustin Chaintreau, Arnaud Legout. Social Clicks: What and Who Gets Read on Twitter?. ACM SIGMETRICS / IFIP Performance 2016, Jun 2016, Antibes Juan-les-Pins, France. 2016.

