
In This Article

This could be the most important note you’ll read all year.
For those of you who read “Part 1” of our most recent quarterly, you know that we excluded, arguably, the most important concept for all investors to understand right now. This section deserves your undivided attention. While I have briefly written on this topic in the past, with each passing day, these thoughts become more and more troubling to me and some extremely large names are beginning to join my soapbox.
We make efforts to simplify the complicated in these notes. We have a very diverse audience; some may have a much greater understanding of financial markets than others. We paint pictures and draw analogies; we repeat concepts that we feel are incredibly important to understand. We make an effort to avoid charts and graphs from the likes of the Treasury, IMF, Federal Reserve (academia in general) which would likely lose many readers. We try to include excerpts from respected news sources and reputable firms to first, give you a glimpse as to how we work through our thought process and second, show you we’re not wearing tin foil hats, we’re not completely alone with many of our observations (we encourage you to click the links and read the full articles for yourself).
In doing so, our hope is, this note will offer some clarity on what is not only likely to fuel our next credit default cycle and recession, but discuss and explore viable ways to capitalize on what could be tremendous opportunities presented to us if/when this happens; while assuming far less risk then what most investors are currently taking.
Before you become dismissive, before you think your investment guy, golf buddy, neighbor, friend or expert has you covered; the odds are – they are large in part to what’s causing and perpetuating the problem and they don’t even know it; the numbers tell the story, not me. Please, take 10 to 15 minutes and form your own thoughts on what’s written below.
The majority may say I’m crazy… They will also be the ones saying, “No one saw this coming” after it happens. I never really cared all that much about what people thought of me… Call it a character flaw, I call it as I see it; and if things unfold anything close to how I see it, these words may be extremely helpful. Should these words bring you even the slightest chance of saving/preserving your retirement, safeguarding more of your capital, why wouldn’t you read it? Print it out – take it on a plane, bus, train, bathroom… read it in pieces, just get through it; time is valuable – I wouldn’t waste mine time writing this – I surely wouldn’t waste yours in asking you to read this if I didn’t think it tremendously important.
My Q1 note contained a question that literally keeps me up at night:
What would be worse for financial markets, Tesla filing for bankruptcy protection or AT&T’s debt being downgraded?
The answer sounds like a “no brainer”, right? When considering bankruptcy vs. a mere downgrade, the immediate knee jerk reaction would be bankruptcy.
Not so fast…
Please allow me to paint a picture in an effort to simplify and refer back to through the piece, bear with me.
We might not all be engineers here, but I think we would all agree that when purchasing a home, we want to live in a house that has been built with structural integrity.
We don’t want our house falling down on us. Which is why prior to purchase, under normal circumstances you get a home inspection to make sure things like the footings and foundation are strong; the structural walls and support beams aren’t rotted and are able to hold the weight they were designed to carry. We don’t want to see any termite damage weakening the structural integrity of the home.
There are so many variables to be considered when building a home that most homebuyers never even think about. Numerous point load calculations need to be accounted for; a floor joists need to be sized properly to carry the weight of not only, say… an empty bathtub, but also one that is filled with water (water is not light). How many gallons of water fill a bathtub? Some tubs are singles, some are doubles, and some are larger whirlpools each holding a different amount of water (a different weight calculation (i.e. load)). You don’t just fill a bathtub to stare at it, you’re going to get in. You weigh something, don’t you? What if the engineer only accounted for the weight of the tub and water but no people? What might then happen if multiple people got into that bathtub? These calculations would be the difference between using a 2×4 joist (small) vs. a 2×12 (big) or any size in between; possibly even an engineered joist (in most cases stronger).
Consider what could happen if an engineer designs a roof system with hips and eves that only took into consideration the weight of 8” of snowfall, but it snowed 4” per day, for a month straight?
Added stresses of extra people in a bathtub (unaccounted for during design) or a month straight of snowfall the engineer didn’t take into consideration could not only expose signs of weakness, but under extreme pressure, be extremely dangerous, too. Maybe the joists beneath the bathtub starts to buckle when the 3rd and 4th person get in? Maybe the roof begins to sag and bow a little under the weight of an accumulated 28” of snow when it was only designed to hold 8”? The “point loads” aren’t likely to snap or collapse immediately under moderate stresses, but rest assured, over time, they will give way. Extreme stresses, however would have a much different impact accelerating the inevitable.
When building or buying a new home today, most people rely heavily on “a system” to safeguard one of the most expensive purchases they will ever make. So long as permits were pulled and inspections were signed off on, most make an immediate leap to an “all clear”… There is an assumption made that because they believe the process was followed, everything is all-good. Reputable builder, check; permits, check; inspectors, check; attorney, check; t’s are crossed and i’s have been dotted, “congratulations, enjoy your new home”… Clearly, there has to be some degree of faith in the structure of the system or business would never get done.
There are times, however, when the system breaks down. What if the town eased building code restrictions making homes less structurally sound? Or the engineer designed things properly but a previous owner changed something without a permit? If a single bathtub was replaced with a double whirlpool, but no additional support was added to the floor joists below? What if the builder has a relationship with the inspector and cut some corners or if a good bottle of scotch ‘bought’ a signature?
What happens when a structured system, experiences a breakdown?
I want to make it clear, this note is not a Tesla vs. AT&T problem, what keeps me up at night is more of a structural problem within our financial system then anything. Our financial system, while not perfect, was once a well-built house with a solid foundation. Its joists were designed to hold a ton; its roof truss system could stand up to month after month of snowfall, then something changed…
The engineer never foresaw a brigade of tanks driving into the living room or a fleet of Chinooks landing on the roof. Did the inspector ever get that good bottle of scotch?
While companies like Tesla, AT&T, Verizon, Sprint, and so many others are deeply indebted and at the heart of the issue, it’s more a systematic issue than that of any one individual company, the question becomes what’s the catalyst that exposes the inherent weaknesses embedded in the system?
I want to stress, while our conviction in this note is tremendously strong, we continue to believe markets remain in what appears to be a “late stage” bull market, which could yield significant returns for the next 12-24 months, we just don’t know? The bear market could have begun January 31st; our current strategy won’t pick exact tops and bottoms, but allows us to remain invested with our capital preservation strategies handling the heavy lifting when markets move outside those comfort zones. Our strategy gives us enough rope to ride our winners higher, but not enough to hang ourselves with – allowing us to sell our losers before they become problematic. Our Volatility Adjusted Position Sizes (VAPS) spread risk across our positions equally. Bottom line, no one knows what the future holds, when facts change, so will we… In the meantime, our discipline rules.
(Disclaimer: We have the ability to lose money – past performance is no indication of future results – “starting point” plays an important roll when investing).
Moving on…
The MOAB
The GBU-43/B – Massive Ordnance Air Blast, commonly known as the Mother Of All Bombs… touted as the most powerful non-nuclear bomb in America’s war chest. During its development, it had been reported that Pentagon officials suggested the MOAB’s be the backbone for the 2003 Iraq invasion strategy dubbed “shock and awe”. A destructive device to say the least; this bomb lies dormant until some catalyst triggers massive destruction reverberating shock waves throughout a massive area.
While most retail investors focus on the “stock market” they might be surprised to know that bond markets are exponentially larger. It’s estimated the Global bond market exceeds $100 trillion dollars with US (bond) markets comprising nearly 40% of this number. US equity markets make up just over 1/3 of total Global equity markets, which have eclipsed $64 trillion in value. Not only are the bond markets substantially larger, they are also considered to be “more liquid” (more on this later as it’s of extreme importance).
Years ago, bond markets were largely controlled by “market makers”, these were large investment firms and banks who brought (bond) deals to market; at the time, these firms would “inventory” many of the bonds, (just like a grocery store maintains a level of inventory in their stock rooms), selling them to investors in the following hours, days and weeks. While things work similarly today, bond ETFs and funds (both active and passive), have become the bond giants of Wall Street. With increased popularity in recent years, these behemoths have virtually become the market.
Most of you are aware of my respect and admiration for the guys and gals over at Stansberry research; (opinion) every serious investor from top Hedge fund manager in the world to individual should make a concerted effort to read their work, (many professionals already do). The “Daily Digest” is a “no brainer” read, it’s printed daily, has a tremendous amount of insight and is free – leaving no excuses. Their research is independent with no ties or correlation to the investment-banking world.
Due to their diligence, independence and attention to detail, they had subscribers watching Toys R Us (TRU) bonds for nearly a year and a half before TRU filed for bankruptcy. For numerous reasons Stansberry believed TRU was likely to have a very difficult time refinancing their maturing debt obligations due in 2018. As late as September 5, 2017 Toy’s R Us bonds were trading at $.96 on the dollar (priced fairly close to perfection). Upon investors hearing the news of refinancing “troubles”, the bonds immediately “gapped down” to $.70 and traded as low as $.20 on the dollar within a day or so.
This is a perfect example of how quickly and dramatically the price of a bond can change:
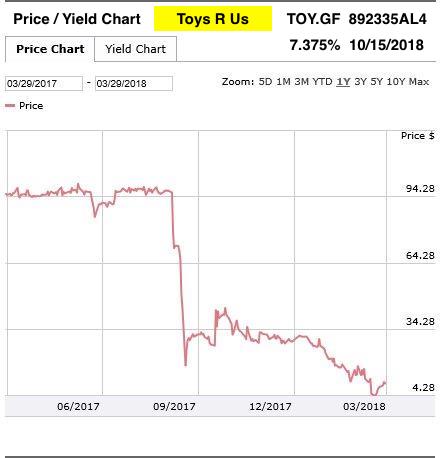
Source, Finra:
Troubling observation #1: The “market” had these bonds priced at $0.96 on the $1.00, literally no one saw this coming, not even their investors. Even though TRU was considered a “junk-bond” and rated as such, a troubled bond would have been trading at a far deeper discount to its par value ($1,000) as investors weighed the risk of a possible bankruptcy (or not). With the bonds trading at $960 their “trouble” seemed to be hidden in plain sight.
More troubling observation #2: How quickly and dramatically the price of the bond changed, with liquidity drying up in a heartbeat. The largest bond buyers in the markets, Bond ETFs and index funds, have DAILY liquidity requirements. In times of stress, with significant price dislocation and liquidity challenges, how does an ETF/bond fund manager provide liquidity to redeeming shareholders, when they themselves can’t find liquidity? (Much more on this further into the piece)
Troubling observation #3: Outside of a small, independent research/publishing company located in Baltimore MD, who had warned about this specific scenario over 18 months in advance, there was no warning from any large investment firm to speak of? This was no small deal – $400 million, yet, crickets…
While the impact of the Toys R Us bankruptcy on the surface appears to be minimal to most, my observation is, at its core, very disturbing and discussed at great length in Part 1 (provided in the main email).
When Liquidity Dries Up…
Do you remember Bond Anticipation Notes (BAN)? If not, these were products sold as “money market alternatives” leading up to the mortgage crises; they were Triple-A rated and sold as “liquid”, yielding slightly higher than money market funds (at the time). The “catch” was, these securities had relatively long maturities, but so long as the short term paper markets were “healthy”, investors had the ability to “roll” these investments every 30, 60 or 90 days…
Until…
Liquidity dried up in the short term paper market when the housing crises hit in late 2007 (‘hat tip’ to GE). The ability to roll these investments literally disappeared overnight. These notes then turned into much longer-term investments than the money markets alternative investors came to expect, defaulting to the actual stated “maturity”. What was once, fairly liquid money, was no longer. It is important to note, most investors were paid in full on these notes, many years later… I guess you can consider that a “win” if you didn’t earmark that money for anything while it was frozen?
We all know what they say about assumptions…
All too frequently investors make blanket assumptions that “what is”, will “always be”. However, in times of stress, what is often the “rule” is often what fails. The “worst case” assumptions that most investors make when planning out their financial futures are typically what falls way short of what actually occurs. In the case of the BANs, Investors wanted more than what a money market was providing at that time, so brokerage firms “manufactured” and financial advisors “sold” a product that temporarily satisfied the investors, want/need/demand.
One of the many life’s lessons my high school football coach etched into my brain via repetition, and I carry it with me everyday, is that the details matter. As an offensive lineman, your block is set up with the weight disbursement in your stance; a first step, which could be no bigger than a few inches, but it matters; keeping your hands inside, matters; a quick first punch, matters. All too often we dismiss the small things or nuances as not mattering burying them in the “fine print”. Then we act surprised when something “unforeseen” happens, only after which, we come to the realization that those small things – mattered. (Thank you Coach Chris Olsen, you continue to make me a better person everyday).
In previous notes we’ve talked about a handful of distressed debt funds that completely froze investors out from redeeming their shares in late 2015. Sparked by what is often referred to as the “taper-tantrum”, interest rates spiked briefly at the time, based on fear the fed was halting their quantitative easing policy (QE). The most recognizable fund to do this was well-respected Third Avenue and their “Focused Credit Fund” but not before they scoffed at the possibility that this could occur, calling it a “myth”, just prior to the freezing (see 3Q2107 note).
Again, investors believed it “couldn’t happen” until it did. Hedge fund Stone Lion and their $400 million dollar fund also prevented investor withdrawals. If we all had a penny for all the times a fund manager, CEO, CFO, government official (Federal Reserve Chairman or Secretary of the Treasury) denied something just before it happened we would all be fairly wealthy… Yet over and again, we assume they are telling the truth even in the face of contradictory data being present, we trust the structure of the system and those “in charge”.
But here’s the thing… What I believe is going to happen has already occurred as recently as 2015; just on a much, much, much smaller scale than I anticipate, the MOAB lies dormant in investors assumptions, it hides in dismissed and overlooked nuances… Until sooner or later, those nuances matter…
It’s important to note that many hedge funds have “lock-up” periods or contractual agreements with clients to allow the fund managers to invest longer term without the fear of having to “unwind” a position/trade to find liquidity for redeeming investors. It’s not necessarily the “lock out” that’s the issue, but the lack of, and poor planning as many investors borrow against these funds creating leverage in the system that eventually unwinds (typically in a disorderly fashion).
In 2015, activist investor Carl Icahn was heard repeatedly criticizing the high-yield bond market; calling it a “keg of dynamite that sooner or later will blow up”, per CNBC, “He contended that some junk bond funds lack necessary liquidity and investors need to know more about their risks.”
We agree there are serious liquidity issues looming within bond markets and investors need to be more diligent in understanding the risks, however, Icahn’s focus is high-yield; we want to remind people that it wasn’t the high-yield bind markets that brought our economy to a virtual halt from 2007-2009… Triple-A rated mortgage backed bonds were… Bond Anticipation Notes (BANSs) froze. Of course risk exists in high-yield markets; though, when investors “approach” high-yield markets they are hopefully aware of the risks that exist and prepare as such. We would take Icahn’s statement much further… We’re connecting the dots a bit differently…
Today’s MUCH bigger picture from 10,000 feet!
A common theme throughout most of our quarterlies is to make a concerted effort to “avoid the noise” and “focus on the bigger underlying theme”. We have written extensively on our belief that significant trouble lies ahead in companies dubbed “fallen angels.” These are companies currently deemed “credit worthy” (at least in the eyes of Moody’s & S&P’s), yet, in our opinion, are wolves in sheep’s clothing.
It’s easy to pass blame to the proverbial “problem child” (high-yield/junk bond markets), though, let’s try not to forget recent history, as well as understand it. We acknowledge our Toys R Us example is Junk rated paper, duly noted, but again, it was the Triple-A market that was at the heart of the mortgage crises, not junk bonds.
We will also acknowledge that, throughout history, far fewer Investment Grade (IG) bonds have defaulted then high-yield, no argument there. The historical average is a little less than 1% of investment grade bonds default. However, this number can be a little misleading. Should an IG rated bond get downgraded, even a short time before the bankruptcy filing, it would be considered a high-yield bond default rather than an IG default. Hypothetically speaking, if Toys R Us had been IG and sold off from $.96 to $.20 on the dollar, was then downgraded to junk by ratings agencies, and weeks later filed for bankruptcy protection; that bond would have been considered a high-yield default, not an investment grade default. The damage was already done – the value of the bond was destroyed while it was rated IG.
Let’s take a step back…
Bond ratings 101… Let’s take a quick look at bond ratings so we’re all on the same page. The below image is an easy way to visualize and understand our current bond ratings system. The rating scale in the example is that of S&P’s, with Moody’s being the same concept…
An upside down triangle is what was once used to represent the size of buyers purchasing bonds given their respective ratings. Triple-A (AAA) representing the “safest” of bonds, which in theory, should represent the greatest demand for those bonds (biggest wedge of the triangle – the base or foundation if you will) with safety and demand declining with every notch down; AA+ is considered safer than AA which is considered more safe than AA- which in turn is safer than BBB+ and on down the list.
As denoted in the chart below, Investment Grade Bonds (IG) are those which are rated BBB– or greater. Anything rated below the Triple-B minus (BBB-) is considered a high-yield or junk bond. I have segregated the IG market from the high-yield market with a black and red line in the image below. Anything over the red line is investment grade (IG) – anything below the line is high-yield/junk, fair?
Decades ago, when first growing up in the business, IG bonds were primarily referred to as Bank Investment Grade Bonds (BIG). There was a simple reason for this; Banks (financial institutions), insurance companies, pension funds, thrifts et. al. (as a rule) could buy them, and nothing below. These companies could not buy junk bonds. A “safeguard” put in place by regulators preventing these companies from taking on undue risk.
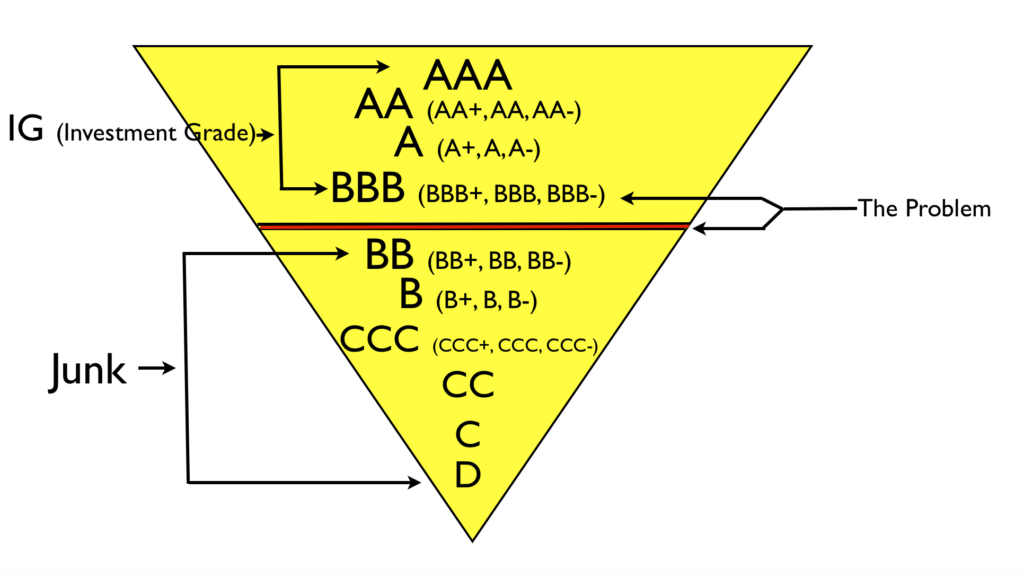
The overall dynamic of the credit markets have changed drastically over the years, as even the rating on US government debt was downgraded to AA+ by S&P back in 2011. However, the crux of our discussion today will focus around the quality of the BBB tranche, which has 3 subsets, Triple-B+, Triple-B and Triple-B-; (BBB-) being the lowest tranche assigned a bank investment grade rating.
Should a bond be downgraded from its Triple-B rating, it will then fall into the high-yield/junk category. It is the Triple-B tranche, which brings me sleepless nights as more research and reporting shows and acceleration of growth with a steady deterioration in credit quality within this tranche. Both the size of this tranche as well as the overall market share it represents should raise eyebrows for anyone in the investment community.
We’ve been talking about this for some time now; Per our 2Q2017 note:
In that January note, I also spoke of the dangers of Bank Investment grade bonds, i.e. the bonds we’re led to believe are the safest! (For those with a short memory – the AAA rated Collateralized Mortgage Obligations was the 800-pound gorilla that nearly collapsed the economy – not junk bonds).
Continued…
Corporate bond analysts at Morgan Stanley anticipate the default rate among junk companies to reach 25% within 5 years. The lowest “rung” of high quality bonds or BBB Rated bonds used to comprise roughly 17% of the market now represents nearly 30% of all bond issuance.
What does this mean? It means BBB credits may not be investment grade credits anymore?! In a recent report from Bloomberg found here – both Moody’s and S&P have been “cutting companies slack on mergers and acquisitions.”
“Over the past year and a half, both have bumped up their ratings by two, three or even six levels on a majority of the biggest deals, the analysis found.”(Emphasis mine)
Morgan Stanley has done some extensive work on this and have been ahead of the curve, they recently provided an update on these markets and the size of the Triple-B tranche; on April 1, 2018 the Wall Street Journal reported:
One slice of the high-grade corporate bond universe is fast becoming the epicenter of these concerns. There is $2.5 trillion in outstanding U.S. debt rated triple-B, according to Morgan Stanley, up from $1.3 trillion five years ago and $686 billion a decade ago. That is the most ever for companies rated triple-B, which is the lowest rung of the ratings ladder for companies that are above more speculative, or junk, bonds
They continue…
“Triple-B rated bonds, which now account for 50% of the investment-grade market, have weighed on overall returns for high-quality debt this year. They returned negative 2.2%.”
If this isn’t a sobering chart from the Journal, I don’t know what is (click the link above to read the entire WSJ article, this chart becomes interactive by clicking the Journal’s link):
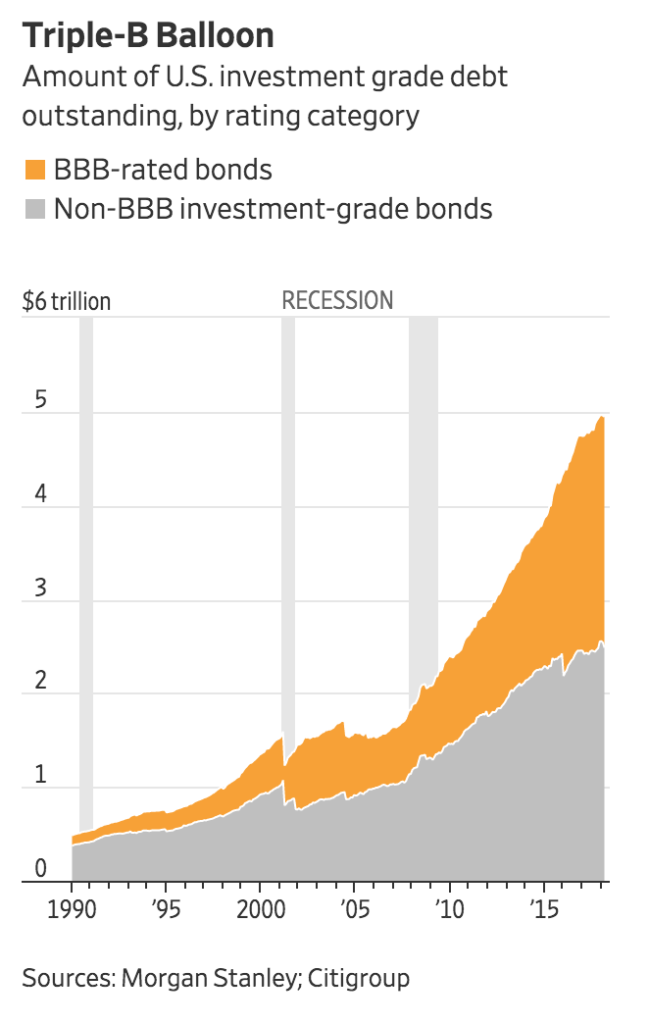
The Triple-B tranche has grown by nearly 200% in 10 years (up over 100% in the last 5) and now represents 50% of the investment grade market; while over that same time span we have not had a year where our economy has grown over 2%.
Pacific Investment Management Company (PIMCO) joins the discussion.
For those who don’t know, PIMCO is regarded as one of the world’s “premier” fixed income investment mangers, with over $1.75 Trillion dollars under management. In a recent January 2018 note, PIMCO just added to this discussion, echoing much of what we have been writing about for quite some time; is anyone listening?
The U.S. corporate bond market is a massive, diverse asset class that has seen decades of significant growth. In the past four years alone, the market has increased from around $4 trillion to $5.8 trillion. This growth, however, has been accompanied by a steady decrease in overall credit quality. Investors should watch this trend closely, especially when weighing the potential risks and benefits of passive versus active management in their credit portfolios.
PIMCO’s piece, drills down further:
- BBB rated bonds (i.e. the LOWEST credit rating still considered investment grade (IG) makes up over 48% of the U.S investment grade (IG) nonfinancial bond market, up from around 25% in the 1990’s
- Average credit fundamentals have been declining
- “The riskiest part of the BBB market segment, the universe of low BBB rated bonds is now bigger than that of all BB rated bonds (i.e., the highest-rated speculative grade bonds) combined.”
Additionally, PIMCO specifically calls out “fallen angel risk” (something we dedicated an entire section to in our 3Q2017 note sent out on October 16, 2017). I honestly don’t care if you listen to PIMCO or myself, its at least time to start listening to the number…
In 2016, 18% of low BBB rated companies were downgraded below investment grade and became part of the high yield sector, mainly due to lower commodity prices. (Corporate bonds that have been downgraded from investment grade to speculative grade are known as “fallen angels.”) Based on historical issuance averages and migration statistics, this suggests that close to $80 billion in BBB rated bonds potentially could be downgraded in 2018. In many cases, downgrades and even just negative outlooks from the rating agencies have an outsized effect on spreads…
To avoid the potentially negative impact on returns, it is important for investors to recognize fallen angel risk.
These are tremendously important points to understand. While the Triple-B market is 50% of the entire IG market (as mentioned above), the lowest tranche of Triple-B, which used to be roughly 17% of that segment, is now estimated to be over 40%. Something the PIMCO and the WSJ article fail to mention that the Triple-B market is nearly two and a half times the size of the ENTIRE high-yield market.
A quick summary of what we’ve already discussed.
- The Triple-B market has become 50% of the entire US Investment Grade market
- The lowest tranche of Triple-B (BBB-) has grown from what was 17% to 40% (plus)
- Bloomberg’s analyzed 5 of the largest deals done between 1/2015 to 6/2016 and found these companies were getting ratings 4 to 6 notches higher than what they should have received had the deals been based solely on their financials – utilizing Moody’s own valuation metrics. (Moody’s stated ratings are “subjective” and “discretion” was the determining factor). We’re in 2018 with numbers showing the size of the Triple-B tranche is accelerating and credit quality is deteriorating more rapidly; per Morgan Stanley and PIMCO
- PIMCO is now warning of “fallen angels”
- Passive bond ETF/index funds have become the largest of bond buyers
- Investors had been frozen out from redeeming their holdings in certain high-yield bond funds as recently as 2015 due to massive price disruptions and liquidity issues in bond markets given a sharp rise in yields at the time
- The 2-year Treasury note yield has moved from 1.26% to 2.48% over the previous 7 months (and still climbing on final edits…) with the 10-year touching 3% yesterday.
- These massive bond ETF/funds market have DAILY liquidity obligations
Admittedly, PIMCO approaches the discussion from an “Active vs. Passive” manager discussion. Some might suggest they are biased towards what will maintain and grow their asset base, and in turn, grow their revenues. Try to separate the “noise”; active manager or not, does it change factual information? Does it make the Triple-B bond market any smaller? Does it make credit quality within the Triple-B tranche any better? Does it alter their “fallen angel” risk perspective? The answer to these questions are no.
PIMCO also wrote a research piece back in April of 2017 discussing Active vs. Passive bond investing, which I thought important to share… While PIMCO manages bonds, their point # 8 touches on equity markets as well. The authors of this piece couldn’t have been more accurate in what they wrote. I wish I had seen this prior to sending Part 1, as these words ring true for both parts of our 2018Q1 pieces.
“Point #8 – A Purely passive market would cause severe market risk and resource misallocations.
What would financial markets, including equities look like in a world where asset management is purely passive? Not very compelling, it turns out, and for a reason: In a world where every asset manager is passive, the asset management mandate is to replicate the market. Therefore, all assets get absorbed without due consideration of their characteristics – cash flows, governance and broad risk/return parameters. Prices would cease to be informative the day assets got bought without being analyzed. The market would be subject to a degenerate form of Say’s law, under which supply creates its own demand, yet suppliers of securities – bond and equity issuers – are better informed about these securities than are purchasers, in this case passive investors. One can easily see how the market equilibrium would become inherently expensive as passive price takers kept buying everything on supply and correlation across securities increased. This would, of course, lead to capital misallocation on a grand scale (with money chasing expensive assets), to a market crash of sorts and to a collapse in confidence.”
Horse, meet water… Are things starting to become clearer?
This ties back to our quarterlies discussing, “the boiling frog analogy”; the distortion of European junk bonds having lower yields than our US treasury, negative interest rates, and the lack of anything “normal” going on in our financial markets. Global central bank intervention via purchasing absurd amounts of passive ETFs has been astronomical. We’ve discussed the Bank of Japan (BOJ), ECB (European Central Bank) and the SNB (Swiss National Bank) over the past years. The SNB has purchased nearly $1-trillion of financial assets via ETFs over the last 3-4 years. There is simply too much money being thrown at the current supply and it’s no more evident then in distorted bond yields. While the ECB has been delving into junk bonds, the Federal Reserve cannot. The natural buyers of high-yield/junk, nearly evaporates relative to the IG buyers based upon covenants, regulators and prospectuses here in the US.
PIMCO’s Active vs. Passive note also ties back to our “closet indexer” discussion from 1Q2018 Part-1. The asset management mandate of passive investing is simply to replicate the market; couple that with our “closet indexers” discussion (many active managers who don’t want to lose their jobs by veering too far from their benchmark index) the amount of money simply attempting to replicate the market becomes staggering… Money is then thrown at companies with complete disregard for anything fundamental. (Companies are now bought because it’s in the index or mirror it)
Let’s add a few more thoughts and then pull it all together…
The first question most investors ask when pondering whether or not to buy a bond is “what’s it’s rating?” the importance of the BBB rating story is MUCH larger than most understand. Think back to the beginning of this piece, the engineer designed the home; the permits were pulled, the inspectors signed off on the work, but the engineer could have never have imagined 5 people getting into that bathtub nor did s/he foresee 4” of snow per day for an entire month; nor a brigade of tanks driving into the living room or a fleet of Chinooks landing on the roof.
The point loads of the financial system are under a tremendous amount of stress. As we can see by the Morgan Stanley and PIMCO reports, the point load in today’s market IS the Triple-B tranche. There is a mountain of debt lining up at this tranche and investors are once again, relying on ratings agencies that no more than a decade ago, rubber-stamped Triple-A Collateralized Mortgage Obligations, which was at the heart of the worst credit crisis since the Great Depression.
“The Big Short” is a movie every single investor should watch. Yes, I know it’s a move… It is, however, based on real life accounts of the 2007-2009 mortgage melt down; told from the perspective of billionaire hedge fund managers who capitalized on the collapse of the housing market and the worthless mortgages underwritten on these homes which were packaged and sold as Triple-A rated products. These are the guys that did their own research; they looked beyond and dug into the rating; they saw the crisis coming.
While I don’t believe our current underlying issues will stem from mortgages, the Triple-A ratings, collateralized obligations received from the ratings agencies played a significant roll in the last crises. To their detriment, investors focused on “ratings” (they assumed and trusted the structure of the system) rather than the underlying securities within packaged investments. After all the bonds were rated Triple-A, they could never default; mortgage defaults would have to reach over 8%, which could never happen). Living in a world of absolutes can be very dangerous…
My extremely large fear is our propensity to have very short memories. We have not learned from history and seem to be again, turning a blind eye to underlying fundamentals, merely focusing on a “rating”; please watch this short clip, its 96 seconds and then think about where we are today. Is there any chance this could be happening again?
“If we don’t give them the ratings they’ll go to Moody’s right down the block. If we don’t work with them, they will go to our competitors. Not our fault! Simply the way the world works”. (Source: the “Big Short”)
Now think back to Bloomberg’s study as I’ve referenced this piece put together by Bloomberg dating back to October 25, 2016 numerous times in this note as well as in previous notes hoping you will click on it.
Using Moody’s own ratings metrics to value the top 5 deals from 1/2015 – 6/2016, Bloomberg’s analysis came up with ratings 4 to 6 notches lower than what Moody’s rated the debt on these deals.
“Discretion” – with the ratings process being “subjective” was the difference.
“History doesn’t repeat itself but it often Rhymes”… (quote attributed to Twain but never proven)
The Triple-B market
Why is the Triple-B market and its current size so important?
The answer to this question is also my “personal opinion” as to why this tranche has grown exponentially so rapidly and how everything we’ve spoken about ties together?
The consequences. Devastating consequences.
We’ve already discussed who are arguably the largest buyers of bonds in today’s financial markets; ETFs and bond funds (passive), followed by insurance companies, pension funds, active bond funds and banks in no specific order.
A prospectus determines the rules the ETF/funds must follow, while corporate covenants dictate what corporations can and can’t do. Banks and Insurance companies are overseen by government regulation. These documents can also dictate what these companies can or cannot invest in. Triple-B or higher is where the line is drawn for many of these institutions; hence the old term, Bank Investment Grade.
There may provisions buried in a prospectus allowing certain ETFs/bond funds to allocate a specific percentage to high-yield, However, Triple-B or higher is where the bulk of the natural buyers stop and cannot purchase below. These collective funds/ETFs and companies represent the absolute largest pool of bond buyers in the market, period.
In the end, the bonds which these companies can ultimately buy, are determined by (in the case of Moody’s) a publically traded rating agency that gets paid for the rating it provides, has shareholders to answer to and earnings estimates to hit. They have options to price for executives, and incentive plans (MRPs) in place. While there is theoretically “competition” out there among these agencies as 10 names sit on a government-approved list, Moody’s, S&P and Fitch dominate the space. A report published December 2016 show the big 3 listed above accounted for roughly 2.3 of the 2.42 million credit ratings outstanding.
Passive bond ETFs/funds grow based upon the volume of money invested in these products. The more money invested the greater the need for additional product, and in most cases, it can’t be below BBB.
The Structural Flaw…
(most are looking beyond!)
In understanding the largest bond buyers in the financial markets (less central banks) are primarily tied to owning IG bonds and the Triple-B market now represents nearly 50% of all IG paper with the lowest tranche representing 40% of that segment, should a greater percentage of these bonds be downgraded ‘one single notch’ to BB, it is very likely high-yield markets won’t be able to absorb such volume; large price distortions (think Toys R Us bonds) could become more the rule vs. the exception.
This comes down to simple supply/demand economics – too much supply/significantly fewer natural buyers suggests a very real potential to set off a firestorm should a catalyst of sorts force this debt to be judged based upon their financial numbers (per Bloomberg’s analysis). You name the catalyst, there are plenty that exist none more obvious than the most recent move in rates (which is why I doubt this is the eventual trigger – maybe next quarters note?)
If a bond ETFs mandate is to mirror an index and that index doesn’t allow for junk bonds, should an investment grade bond become a “fallen angel” as described above by PIMCO, a massive amount of bonds will be sold into the (much smaller) high-yield market.
PIMCO noted above, downgrades from Triple-B to junk do happen, their assumptions suggest the possibly of $80 billion in “fallen angels” adversely affecting credit spreads (which in turn would affect price) this year (2018). Though, AT&T alone has current debt of roughly $180 billion, with $250 billion anticipated post merger (should the deal be allowed to move forward).
What happens if/when AT&T loses their Triple-B (Baa1) status on the roughly $250 billion (post Time Warner merger) bank investment grade debt? That can never happen you say… How did Lucent (LU) turn out for people? Or Global Crossings? AT&T is in a highly competitive market where price wars are now the norm. Their market share in just about every segment shrunk last year and they can’t just increase prices to service their debt as interest rates move higher; customers will simply migrate to other carriers. What about CVS as they just borrowed $40 billion for their Cigna deal? What do you think Amazon is about to do to the pharmacy industry? Why do you think CVS is diversifying out of the pharmacy space and moving into healthcare? How many billions in real estate leases will be defaulted on as Amazon cannibalizes this industry as they have every other industry they have taken on (a problem created by unlimited access to virtually free money, unintended consequence and story for another time). I shutter to think what street corners will look like in 5 years as larger pharmacies often open locations across the street from each other.
PIMCO is basing their 2018 – $80 billion dollar “fallen angel” number on “historical issuance averages and migration statistics”. I would challenge this assumption, as the law of averages tends not to apply in times of market bubbles. As well written as their piece is; our belief is the assumptions are grossly understated.
We’ve noted a single example of AT&T: you choose which debt numbers we use, the $180 billion pre-acquisition or $250 billion post-acquisition? It’s still 2.25 to 3 times the $80 billion PIMCO is using. If AT&T has issues, you’ve got to look at Sprint who hasn’t made a profit in over 10 years and has over $35 billion in debt, then Verizon. Look at General Mills or Viacom ($10billion), General Motors ($95-billion) or Ford ($154-billion) Capital One ($55-billion). These companies are heavily leveraged now, what happens if they are placed under tremendous amounts of stress over a prolonged period of time? What did the mortgage meltdown do to Ford and GM in 2008? Just glance at the highly leveraged energy and gas space has me shutter and now your talking about a number that makes $80 billion look like a joke. Throw that stress onto a high-yield market, which is a fraction of that size and has an extremely limited amount of natural buyers.
Supply/demand economics would have Bond managers left holding positions arguably with a fraction of their value and limited ways to provide redeeming shareholders with liquidity.
The market reaction to the Toys R us, could have easily been a precursor of what’s to come, and while high-yield markets have been able to absorb the more recent bankruptcies, the volume of debt which has the potential to become high-yield very quickly with a single notch downgrade is literally mind numbing. As interest rates continue to rise, bond prices will continue to fall; large price dislocations will become more normal. As bond ETF/fund investors begin to see loses, they will get nervous; which perpetuates selling.
As stated in a bullet point above, the 2-year Treasury note yield has moved from 1.26% to 2.48% in 7 month (and still climbing on final edits…) this benchmark yield has nearly doubled in just over half a year! If this happened in the Equity markets the media would have had to create terms bigger than crash or plummet to describe the magnitude of this move.
The tide is rolling out and if this trend continues we will definitely learn who isn’t wearing any bathing suit, very quickly. (paraphrasing Porter Stansberry)
Adding insult to injury
Let’s touch upon net sellers… If the index doesn’t allow for junk bonds to be held, the ETF must sell as well. The many of the largest buyers mentioned in this entire piece then become net sellers.
Now let’s talk money center banks, Insurance companies, corporations. I recently spoke with retired banking CFOs, large private wealth managers, corporate finance executives, analysts and attorneys on this subject and while many could not point to a specific rule which would “force” selling newly “fallen angels”. Many pointed to the fact that regulators keep a very watchful eye on a banks balance sheet. Some of the CFOs (retired and active) said that based upon such heavily scrutiny in the past, they wouldn’t even wait to talk to a regulator given this scenario; they would sell. Others said in they past, they have been strongly “advised” to sell, while others have held on and written the loss down taking an OTTI charge (Other than temporary impairment charge). Some attorney’s suggested there may be “regulatory discretion” allowing for the institution to work things out, though; it could depend on the situation and regulator.
There was some consensus suggesting in a time of distress, should there be any liquidity it would be very difficult, but not impossible for the financial institution to plead a case as to why they should be able to hold a junk bond if markets are falling apart. What if a regulator allowed a financial institution to hold junk bonds because the company “believed” the price would rebound and it turned out those bonds eventually defaulted with the underlying company going bankrupt? That wouldn’t look too good.
Whether some financial institutions attempt to talk regulators in to allowing them to hold “fallen angels”, some decide to be prudent and sell on their own, or regulators attempt to force sales, it would be nothing more than added fuel to an already roaring fire in the Bond ETF/fund markets.
Put it all together and this is how contagion begins.
If the values of bonds slump due to downgrades, increased interest rates, deteriorating credit (insert viable reason here) so will the value of bond ETF/funds. As we’ve seen in the past, bond managers will search their governing documents in an effort to find clauses allowing them to place a freeze on redemptions; my bet is some will, while others won’t. ETFs will follow mandates and it begins…
Investment and prime brokerage firms will likely revisit margin/borrowing requirements (this is the percentage % brokerage firms allow investors to borrow against a specific position). The safer the investment, usually the higher percentage a firm allows an investor to borrow off of that particular position. Investment firms tend to give a larger borrow to bonds and bond funds as they are considered “safer” than equities, my opinion is they will regret this decision given our current environment, as margin calls are likely be triggered, forcing investors to sell where there is liquidity; if investors are frozen out of bond ETF/funds, they will find it in equity ETFs, Index funds, mutual funds, individual stocks; anything liquid.
PIMCO stated above: In many cases, “downgrades and even just negative outlooks from the rating agencies have an outsized effect on spreads”. Outsized effect on spreads means the buyer of a downgraded bond would want a greater return for the risk they are assuming in purchasing the bond; Increased rate would mean “outsized” lower price. As lower prices begin to hit the passive bond ETF/fund markets, retail investors most often panic, panic frequently leads to selling, selling means is added pressure on bond markets leading to further deterioration, margin calls, (everything described above still holds true); the snowball effect might just take longer to unfold?
If bond ETF/funds didn’t have to answer to redeeming shareholders, the ballgame is likely different. This is why the hedge funds like Third Avenue froze investors from selling, it gave the managers the ability to work through the liquidity crunch, which, as you can see, can hit the bond markets in times of tremendous stress.
It all keeps coming back to “structure”; the volume of debt stressing the point load of the Triple-B/junk line is massive, downgrade(s) trigger sales of bonds and dislocation in markets as the volume of bonds being sold dwarfs the size of the natural buyers able to purchase; price drops in fund values panic investors, investors attempt to redeem, the outsized effect on spreads eats into value and dries up liquidity, which places managers in a terrible position making it difficult to provide the necessary liquidity. Shareholders see margin calls and attempt to redeem those funds (you can’t draw blood from a stone), the managers will be at the mercy of the redeeming shareholders – they won’t have the option to hold anything unless they freeze redemptions (if they even have the ability). Investors then need to find liquidity to cover their margin calls which likely carries this over into the equity markets and the snowball begins to roll down Mt. Everest.
Corporations and consumers are tapped out, borrowing/margin relative to GDP are at all time highs, should the value of these bond funds “gap down” people won’t be able to borrow to cover their margin calls; a very plausible scenario is a gridlock in the bond markets as if every NYC street was jammed with cars and people with every bridge closed.
What once began with good intensions (low cost diversification via Index/ETF) has now become the new “800lb chameleon” in the room as it’s nearly invisible to the vast majority of investors and professionals out there.
While the above PIMCO and WSJ pieces are a step in the right direction, my belief is our issues go far beyond their assumptions. They fail to attempt to address why the wall of debt is mounting at the Triple-B level or consider what could happen if just one company with 2.25 to 3 times the amount of debt than their historical (fallen angel) averages claim.
We’re almost done – The Good News!
As we Conclude:
Let me be crystal clear
I am NOT saying that all bonds are going to default and go bankrupt (yes, there will be carnage in the next credit default cycle, but that doesn’t mean every downgraded bond will default). What I am suggesting is the structure of our bond markets, (specifically the IG – high-yield/junk line), coupled with low interest rates, our propensity to over-borrow and our blind faith in bond ratings system have painted us into a corner.
The ratings companies could be as right as rain and their discretion warranted, just as I disagree with over $21 Trillion in US government debt, I disagree with the subjective discretion being used to rate these deals. In my opinion, given where are financial system currently is, companies should be rated as their financials dictate at the time the rating is issued, the rating can be increased should they follow a specified debt reduction plan as time moves on, not the other way around. The system is too fragile right now. Big, well-respected firms like Bloomberg, PIMCO and Morgan Stanley are sporadically reporting on this, but no one is connecting any dots.
Having said that, if we do our best to study what we believe to be the underlying issues, we should put ourselves in a much better position to take advantage of what could be a very difficult situation. It is important to discuss the fact that bonds are binary, meaning, they will either return principal and interest in full or they will default. If they do default, all equity (stock) value is wiped out and creditors then divide remaining assets.
Historically, IG bonds that have filed for bankruptcy protections have returned nearly $0.48-$.050 on the dollar for those who have “held through the process”; $.32 to $0.40 on the dollar for those companies with junk ratings…
This is an extremely salient point to understand and it’s how we will likely have an ability to capitalize on the aforementioned, while taking less risk than most investors are taking at this very moment.
It is extremely important to understand what you own.
Disclaimer: This doesn’t mean you/we will forever escape loses in the financial markets; our capital preservations strategies are not designed to sell at the very top or buy at the very bottom. Losses come to us all at some point in time; it is part of the business regardless of how careful we attempt to be. The goal is to limit losses, preserve capital, look to reduce risk and become opportunistic when we can (which will likely happen when the masses are scared).
I am currently not advocating for bonds or bond ETF/funds at this particular time as an asset class. Our belief is bonds are in a larger bubble than equities, and regardless of how I feel, if I am right on “how this all happens”, I still have no idea “when” this could happen, another scenario is I could be flat out wrong, I don’t think I am or I wouldn’t have spent weeks writing this and putting it out there.
Having said that, understanding what you own is again, in the nuances, the small things, the details. Holding individual bonds are different then bond ETFs/funds. If you own an individual bond and markets get caught up in the gridlock, so long as the underlying company of the bond you own doesn’t go bankrupt (and you’re not leveraged on margin), you don’t have to redeem your bond at fire sale prices, simply opt to hold the investment to maturity so long as you believe it will mature and the company will survive. In owning a bond ETF or fund, you’re future is subject to the emotion of the masses.
Additionally, if we stick with our current capital preservation strategies, at the point when markets do begin to really sell off, we will follow our disciplines, which should increase our cash position (or possibly add short positions for those who can or want to). If the above scenario outlined above occurs, odds are, downgraded bonds “should” trade for much less than their current value? We will then look to cycle our cash into discounted bonds, offering us what could be significant upside opportunity while limiting downside protection; difficult for a stock to offer.
If you hadn’t figured it out by now, I believe an AT&T downgrade would have larger market implications than a Tesla bankruptcy… The above scenario “could” be very real and happen, the numbers are staggering. Though, there is another scenario that could play out. In theory, the Federal Reserve could start to buy the downgraded high-yield/junk bonds to soak up the backlog and provide liquidity to these markets (while unprecedented in our markets, the ECB and other global central banks have done it). We can only work with what the system offers us, be as fluid as possible and use all tools available to create a competitive advantage. I ended Part 1 with a quote, for those who didn’t read it; my belief is its worth repeating…
I said empty your mind, be formless, shapeless, like water. Now you put water into a cup, it becomes the cup; you put water into a bottle, it becomes the bottle; you put it in a teapot, it becomes the teapot. Now water can flow or it can crash. Be water my friend. ~Bruce Lee
Good Investing,
Mitchel
Mitchel C. Krause
Managing Principal and CCO

4141 Banks Stone Dr.
Raleigh, NC. 27603
Phone: 919-249-9650 Fax: 919-249-9645
Toll Free: 844-300-7344
Mitchel.Krause@Othersideam.com
Some additional thoughts to ponder for the overachievers who made it this far… Additionally, please see our disclaimer below.
What do the vast majority of Wall Street firm “recommend” from an allocation perspective; what is their suggestion as to how much you should allocate towards stocks v. bonds? My bet is most will recommend you to take 100 and subtract your age. Others might suggest to take 120 and subtract your age as we’re living longer; the theory being we’re living longer, the older you get, the more you should have in bonds.
- Do you own any bond funds?
- Do they use leverage?
- What is the average maturity of the bond funds? The Duration?
- How many bonds are held in AAA, AA, A, BBB, etc…
- Are specific sectors weighted more heavily? Energy companies tend to have more leverage.
- Is your 401k invested in an “Age based” model?
- Do you understand how that model invests?
- Is your child or grandchild’s 529 invested in an “Age based” plan?
- Do you understand that bond index funds are likely a part of those age-based models as well?
Age based plans become “bond heavy” the closer you get to retirement or sending your child to school as historically, bonds are a “safer” investment then stocks. Though currently, we could be in as much of a bond bubble as we are an equity bubble. It is ok to question the traditional mainstream narrative; where is your money best suited?
Recently the Fidelity “target-date” funds came under fire for “ramping up risk” and abandoning “a long-held belief”, per Reuters:
“The exodus stems in part from unease with the way Boston-based Fidelity has boosted performance – by ramping up risk.
Since a strategy overhaul that took full effect in 2014, Fidelity has substantially increased exposure to stocks, including those from volatile emerging markets. The firm also scrapped a long-held belief of sticking to pre-set allocations of stocks, bonds and other assets in target-date funds.”
While I am not specifically advocating for Fidelity here, I applaud their decision to scrap a “long-held belief.” When facts and situations change, so too, should you (or at the very least, think the pro’s and con’s through). There was a long held belief women shouldn’t vote – should we not have changed that? There was a long held belief horse and buggy was the best mode of transportation – should we not have changed that? Should we not have accepted the light bulb, rather stuck with the candle and oil lamps? Running water? Refrigeration?
The investing world still views the US treasury as a “risk-free asset” – over $21 trillion in debt, with yearly deficit spending at over $1 trillion. While I still have a fundamental love for the United States, to assume “risk-free”? Eh? We assume it to be risk-free as no one, including myself, wants to even think about what the alternative might look like.
All too frequently assumptions cloud the way we view risk, often to investors detriment. Wall street “sells” ideas that many of the most successful investors disregard as false narratives. Diversification for example, many of the most iconic investors including Stanley Druckemiller or Warren Buffet successfully buck the diversification trend using larger, more concentrated investments which fuel significant growth.
I can’t say Fidelity “ramped up risk” simply based on what Reuters has reported on. I also don’t believe Reuters has the ability to say Fidelity ramped up risk because they invested differently then what the mainstream has done, there is a lot more to it than owning X% of a stock or bond. Fidelity very well might have assumed more risk, though, Reuters may also be incorrectly assuming there is less risk in bonds given an improper evaluation of our current bond market bubble?
Don’t be afraid to think differently when it comes to investing. Think outside the box and connect your own dots, don’t wait for someone to connect them for you.
Worth reiterating… the AAA rated Collateralized Mortgage Obligations was the 800-pound gorilla that nearly collapsed the economy – not junk bonds”(referring back to the 2007-2009 mortgage crisis). ~M
Disclosure: The commentary, analysis, references to, and performance information contained herein, except where explicitly noted, reflects that of Other Side Asset Management, LLC, a registered investment adviser. Opinions expressed are as of the current date and subject to change without notice. Other Side Asset Management, LLC shall not be responsible for any trading decisions, damages, or other losses resulting from, or related to, the information, data, analyses or opinions contained herein or their use, which do not constitute investment advice, are provided as of the date written, are provided solely for informational purposes and therefore are not an offer to buy or sell a security. This commentary is for informational purposes only and has not been tailored to suit any individual. References to specific securities or investment options should not be considered an offer to purchase or sell that specific investment. Other Side Asset Management, LLC does not guarantee the results of its advice or recommendations, or that the objectives of a strategy will be achieved. Performance shown herein should in no way be considered indicative of, or a guarantee of the actual or future performance of, or viewed as a substitute for any portfolio invested in a similarstrategy.
Performance data shown represents past performance, which does not guarantee future results. Investments in securities are subject to investment risk, including possible loss of principal. Prices of securities may fluctuate from time to time and may even become valueless. Securities in this report are not FDIC-insured, may lose value, and are not guaranteed by a bank or other financial institution. Before making any investment decision, investors should read and consider all the relevant investment product information. Investors should seriously consider if the investment is suitable for them by referencing their own financial position, investment objectives, and risk profile before making any investment decision. There can be no assurance that any financial strategy will besuccessful.
All data presented is based on the most recent information available to Other Side Asset Management, LLC as of the date indicated and may not be an accurate reflection of current data. There is no assurance that the data will remain the same. This commentary contains certain forward-looking statements. Forward-looking statements involve known and unknown risks, uncertainties and other factors, which may cause the actual results to differ materially, and/or substantially from any future results, performance or achievements expressed or implied by those projected in the forward-looking statements for any reason. No graph, chart, or formula in this presentation can be used in and of itself to determine which securities to buy or sell, when to buy or sell securities, whether to invest using this investment strategy, or whether to engage Other Side Asset Management’s investment advisory services. In addition to the Other Side Asset Management’s advisory fee, overall returns may be reduced by expenses that an investor may incur in the management of the investor’s account, such as for custody or trading services, which will vary by investor and may exceed the trading costs reflected herein.
Some headlines have been slightly modified, shortened, broken into multiple levels in order to fit our Web-based table of content – early PDFs are all in original form as they have no hyperlinked Table of Contents.
Additional Legal Information and Disclosures
This memorandum expresses the views of the author as of the date indicated and such views are subject to change without notice. Other Side Asset Management, LLC. has no duty or obligation to update the information contained herein. Further, Other Side Asset Management, LLC. makes no representation, and it should not be assumed, that past investment performance is an indication of future results. Moreover, wherever there is the potential for profit there is also the possibility of loss.
This memorandum is being made available for educational purposes only and should not be used for any other purpose. The information contained herein does not constitute and should not be construed as an offering of advisory services or an offer to sell or solicitation to buy any securities or related financial instruments in any jurisdiction. Certain information contained herein concerning economic trends and performance is based on or derived from information provided by independent third-party sources. Other Side Asset Management, LLC.. (“OSAM”) believes that the sources from which such information has been obtained are reliable; however, it cannot guarantee the accuracy of such information and has not independently verified the accuracy or completeness of such information or the assumptions on which such information is based.

