

In This Article

The Other Side
After having spent nearly 22 years on Wall Street, Other Side Asset Management opened our doors in early 2018 with the goal to contribute, lead and help restore certain fundamental principles we believed the industry to be lacking. With honestly and integrity at the heart of our core values, given our unique path, and in turn, perspective … it was imperative to tell investors exactly what we would want to know should the roles be reversed. Simply put, we wanted investors to understand the “other side” of the investing story, good or bad, that’s often conveniently omitted when working with larger firms.
As much as we’d like things to always be bullish, unfortunately that’s not how the world or economic cycles work.
Per FactSet, as of March 16, 2023, there were 10,966 ratings on stocks in the S&P 500. Of those ratings, 53.5% were Buy ratings, 40.3% were Hold ratings, and 6.2% were Sell ratings. Over the course of our 27 years in this industry, at any given time, equities covered by Wall Street analysts have been rated either a buy or hold roughly 90% to 94% of the time … which might lead one to wonder how this could be?!
Nearly 40% of small cap companies in the Russell 2000, alone have negative earnings?! Numerous companies in the “Profitless tech” basket, which is a real thing are cash flow negative; and many will be bankrupt as we describe below … but it’s not just small cap companies that are hemorrhaging cash, and receive Buy or Hold ratings, larger cap names like $TSLA went 18 years before reporting a profitable quarter.
May of 2019, we walked readers through the data per prospectus and statements made by their CEO Elon Musk, on earnings calls as to how $TSLA was a handful of days away from having a zero balance just before their bankers bailed themselves out of multi-billion-dollar revolving credit lines by aiding them in raising some $1.6 billion dollars. Clearly, they didn’t outright admit this … nor did the analysts who covered the name, but if you read the documents and listened to Musk it was clear … as we wrote then:
More disturbing is Tesla CEO, Elon Musk freely admitting, almost bragging to investors on their earnings conference call:
“Overseas volume strained our logistics operation and resulted in over half of our global deliveries occurring in the final 10 days of Q1.”
Delivering these cars in the final 10 days of the quarter represents nearly $2 billion in cash flows!
Why is this so important to understand? Per the most recent prospectus, Tesla ended the first quarter with just under $2.2 billion in cash?! See below…
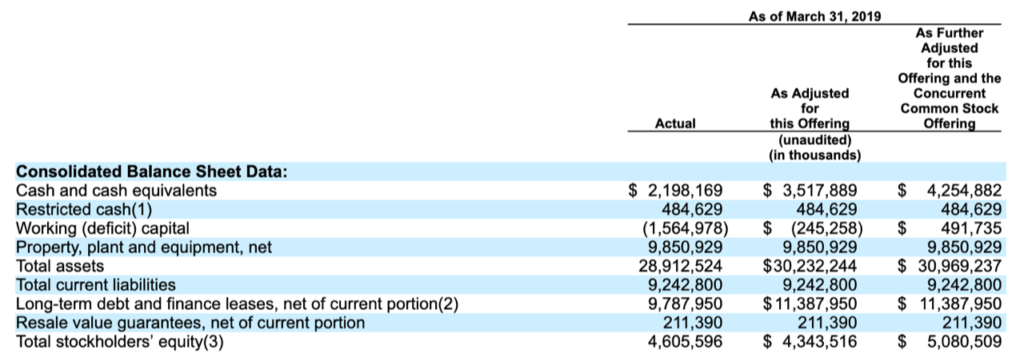
$2 billion dollars coming through the doors in the last 10 days of a quarter is akin to someone who is living paycheck-to-paycheck, finally getting paid and “hoping” their check clears so they don’t bounce the check they just wrote to their dry cleaner”; only Tesla’s “drycleaners” are their parts suppliers (without parts, cars can’t be built). These admissions coupled with the numbers from the prospectus put this company as dangerously close to “cash strapped” (pre capital raise) as it gets.
We all know where we currently are in this story … bankers were successful, everyone’s bullish, happy ending for all … right?! We’d contend that this specific story is far from over, though we digress…
Last month we informed readers that nearly 90% of those small cap companies required to refinance their debt between now and the end of 2024, at current interest rates, will no longer be cash flow positive … and yet, 94% Buy/Hold recommendations remain…
The Other Side of this story is that if an analyst cuts a stock from a “Buy” or “Hold” rating to a “SELL” … that investment bank is likely to lose up to 6 revenue streams on that downgrade.
- Institutional “nickel” business
- Corporate buyback business
- Mergers and acquisitions business (representing either side, buy or sell side)
- Future capital markets business
- equity/debt/preferred offerings, etc. (or any indirect benefits like being paid just because your name sits on the prospectus … yeah, that’s a thing, too)
- Insiders cashless options exercise
- Analyst votes
You may or may not understand what these all mean, but we do and can explain what they and how/why these revenue streams are lost, but this note is not the time or place … however, should you have interest never hesitate to reach out to discuss…
At the end of the day, you’re never being told the full story by most of Wall Street and/or the financial media – be it, a. they truly don’t understand how things really work (most don’t) or b. those who do understand will never say anything due to “career risk” (they make too much money and don’t want to lose their jobs).
I know the above to be true, I lived it, watching all of the above happen in real time for over 20 years on both the retail and institutional side of the business.
This business isn’t designed for the average broker or investor to understand how it works … it’s complicated by design … siloed, segmented, and disorganized … and unless you’ve experienced each facet of the game, you’re likely to have a poor understanding of how it works. The more confusing it is, the more individual investors feel lost, tethered to their guide (broker).
Saying things that completely contradict what the vast majority of an industry is saying is by no means easy … I could only imagine this is what a salmon swimming upstream to spawn feels like; I just pray that we’re of the Atlantic salmon variety and not Pacific. (Pacific salmon always die after spawning while Atlantic salmon often survive with the opportunity to spawn another day).
We don’t sell readers a narrative, we provide empirical facts via the data; stating that the data probabilistically wins in the end as we did last month isn’t narrative, it’s historical fact. At the same time, markets don’t always trade in lock step with the data but most frequently mean reverts as the reality of the economic cycle unfolds, which is happening.
This month, we’ll update readers on the current economic cycle, by way of the data which corroborates what we’ve been describing for readers for nearly 20 months now.
The length of this note is deceiving as we’re consciously taking the “picture is worth 1,000 words” approach!
As always, we’ll start with the data then provide a few real time examples as to how it’s flowing through to the companies, both large and small in real time.
The consumer/retail sales
There should be no surprises here … the consumer has been getting crushed. We’ve been detailing the trending deterioration in retail sales for months now … last month we noted:
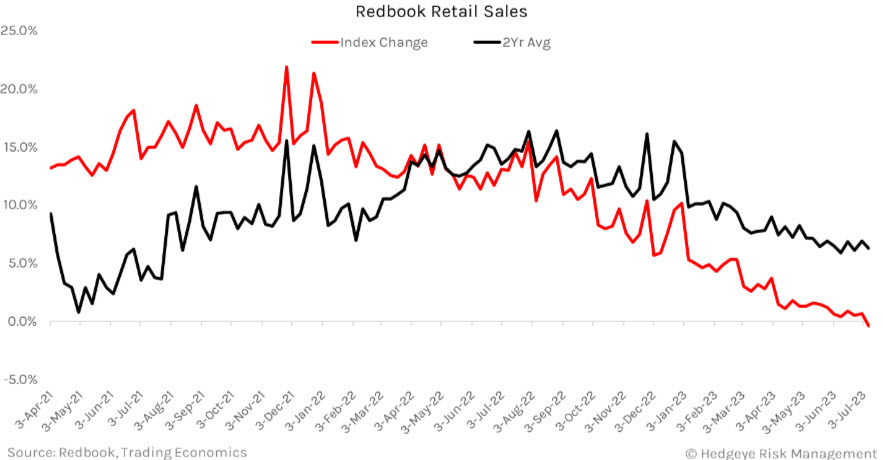
with May’s final Redbook Weekly Retail Sales data touching a new cycle low of +1.2% YoY, then subsequently making two more sequential cycle lows the following weeks at +0.6% YoY and +0.4% YoY … only to see a de minimis rebound of +0.9% YoY with the help of easier YoY comps.
Well, this month got even worse with three sequential NEGATIVE prints in the Redbook Weekly Sales data, coming in at -0.2%, -0.2%, and -0.4% YoY respectively … with June U.S. Retail Sales coming in at +0.2% vs. expectations of +0.6% … ex-Autos, retail sales fell to +0.6% YoY vs. +1.2% in May … this against EASIER comps, with comps getting much more challenging in the coming months ahead.
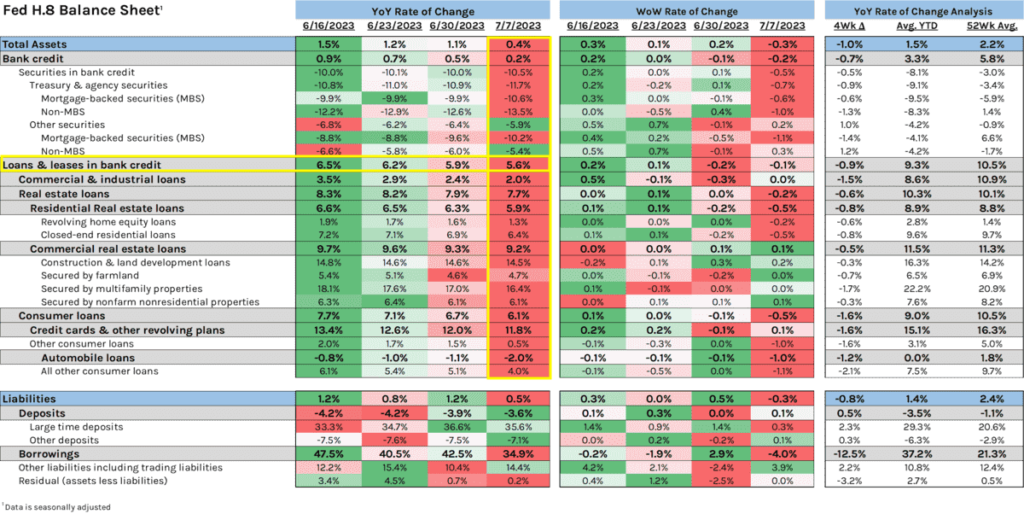
Liquidity constraints continue as the tightening of credit becomes even more apparent in the Federal Reserve’s H8 data (which tracks the assets and liabilities of commercial banks in the U.S. weekly).
While the Fed’s data can be more difficult to read, Hedgeye’s Federal Reserve H8 data tracker product, dumbs things down so anyone with a pulse can visibly see the deterioration/contraction in data via the color coding below.
While ordinarily under a paywall, one which we respect greatly as a paying customer … @Hedgeye twitter followers have recently been gifted a plethora of free data in an effort to help them protect their hard-earned wealth as we head into some pretty dark times per the data. Every Hedgeye chart used in this piece has been shared by an @Hedgeye twitter handle in the last 3 weeks … this chart included … which you can find by clicking here … they are literally providing anyone willing to follow them an education better than any PhD program out there; again … factual data visualized!
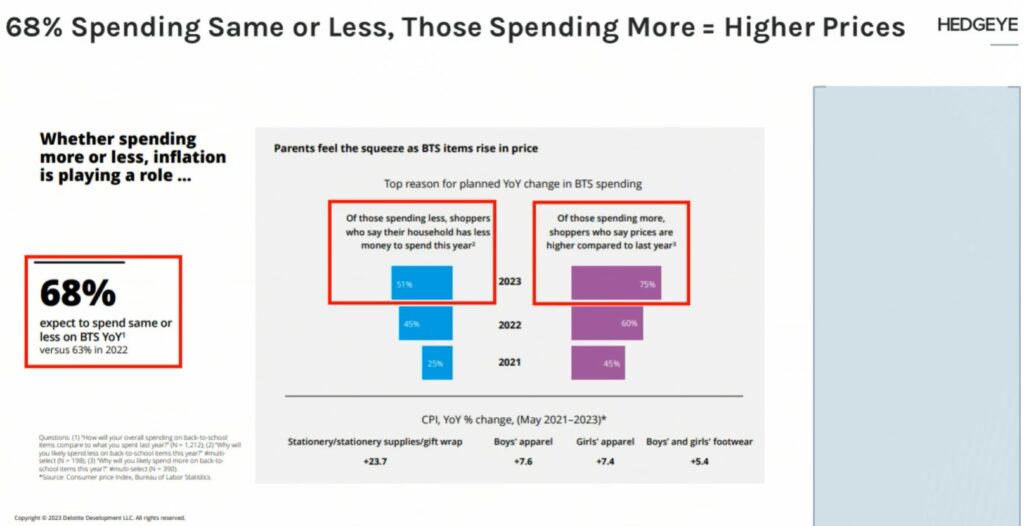
Additionally, we don’t see retail sales improving in the near future with recent survey data showing: “68% of respondents planning on spending the same OR LESS” with those planning on spending more only doing so because prices are higher; not because they want to … The below image again provided by @Hedgeye 7/19/23
This credit/liquidity crunch is also hitting the Auto markets, as above we noted retail sales ex-Autos falling to +0.6% YoY vs. +1.2% in May … which got us thinking about the crux another image provided by Hedgeye on their twitter handle … showing the Auto loan rejection rate skyrocketing relative to loans being applied for … Chart courtesy @HedgeyeUSA 7.18.23
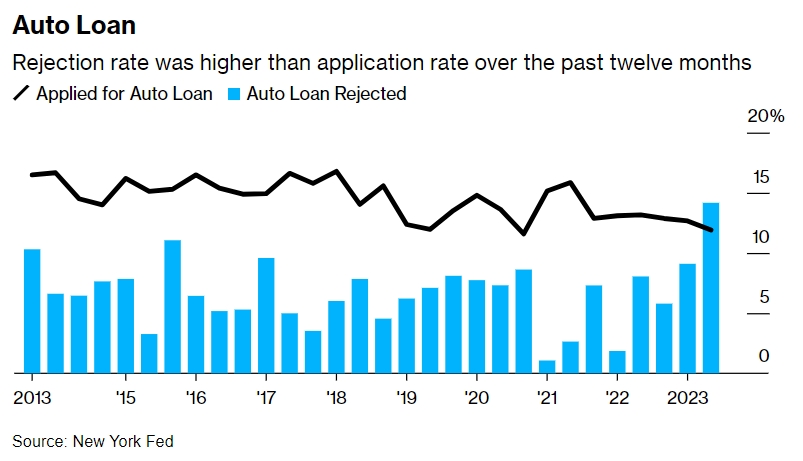
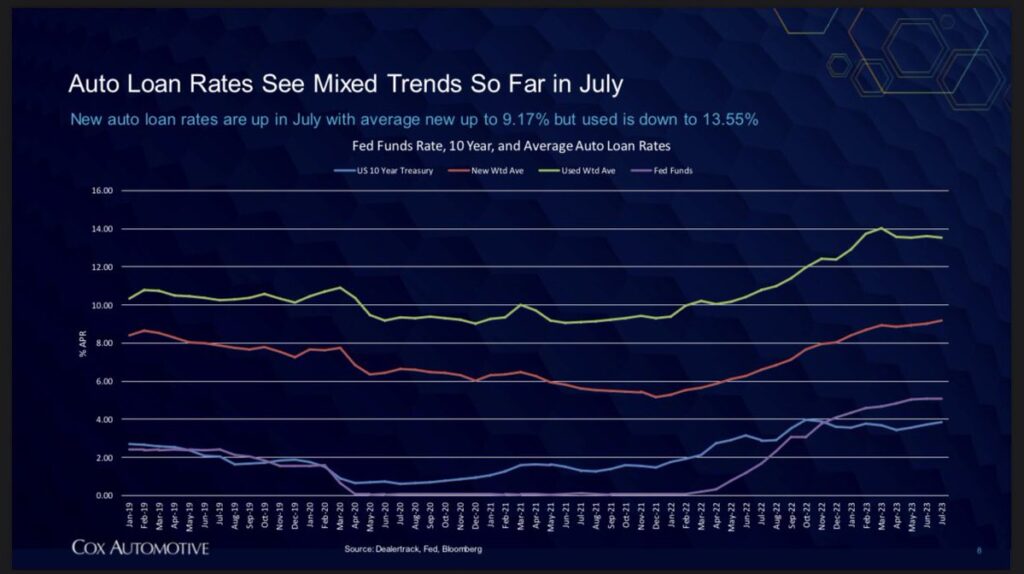
What’s taking place in auto markets is staggering, but the continued deterioration in credit quality again, is no secret to our readers. We’ve been writing about a higher cost of capital regime for over a year now and we literally just set a new multi-decade record high of 9.17% APR on new car loans per Cox Automotive.
As recently noted by CarDealershipGuy, a “$50k auto loan today (vs. 18 months ago) will cost you $7k more in interest expense over the life of a 5-year loan.” With nearly 17% of all monthly payments are now over $1,000 per month … for a car!
Is this where we mention that we just witnessed one of the fastest used car price decelerations in history, falling -4.2% from May to June per the Manheim Index; down -10.3% YoY?! Remember, 30 and 60 day delinquencies continue to Spike … No money = No car!
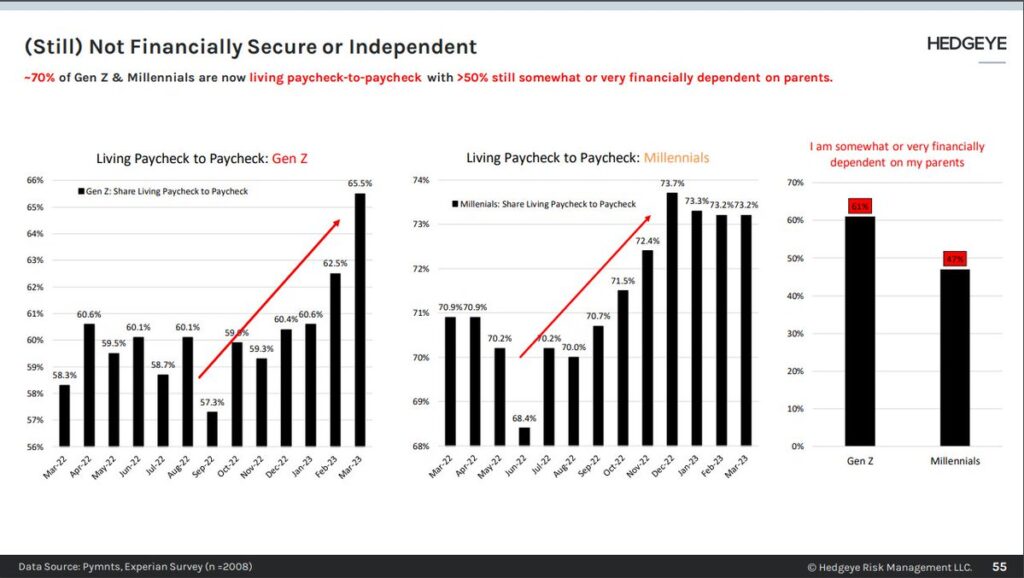
This, while “~70% of Gen Z & Millennials are now living paycheck-to-paycheck with >50% still somewhat or very financially dependent on parents.” @Hedgeye 7/21/23
The bottom line is the consumer is getting “squeezed” with “1Q data showing credit card balances growing at the fastest pace in 20 years, while the cost of revolving credit notches higher to multi-decade highs.” @Hedgeye 7/18/23
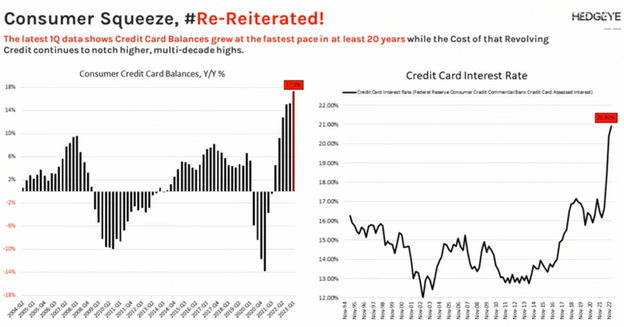
At the same time the average interest rate on commercial bank credit cards just hit an all-time high level of 22.2% in May!
Talk about people running into a higher cost of capital wall at the same time they’re running out of money with student loans set to resume (as we’ve been discussing for months) as banks pull back on lending!
The Ouroboros is literally feeding on itself, just as we wrote about in April … it’s a slow-motion train wreck happening in real time right before our eyes! Rest assured this is affecting:
Labor markets
We’re going to sound like a broken record here … while initial jobless claims came in “better than expected” on a sequential basis, these weekly numbers can be volatile … the overall TREND remains up with claims having bottomed in September of 2022 (which is bearish for labor markets).
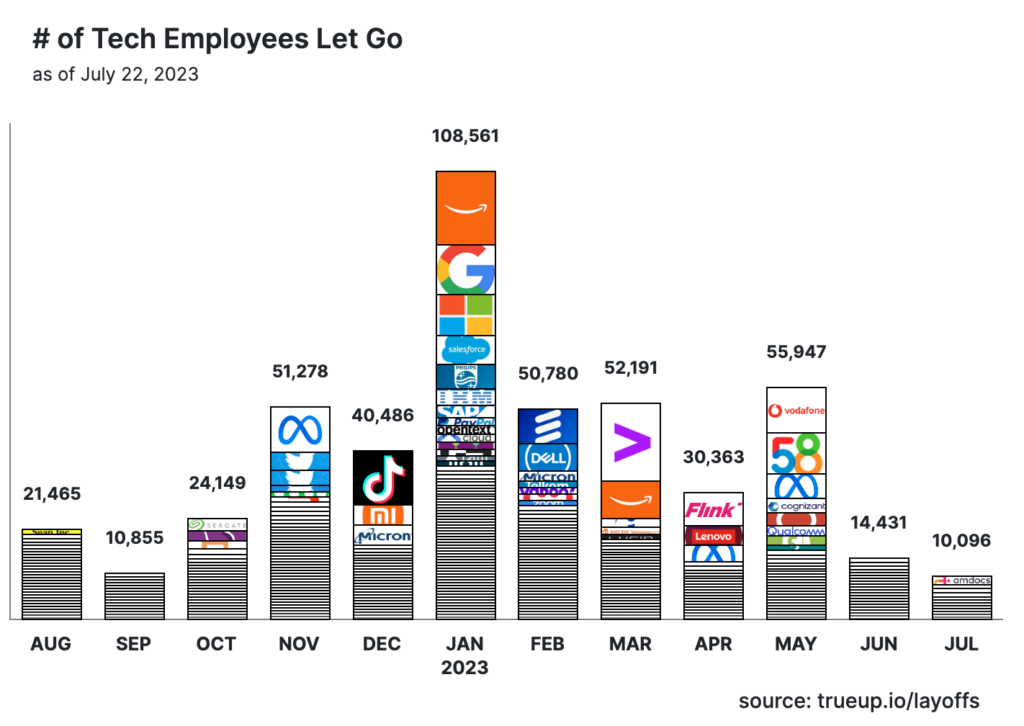
Another trend that also remains in place are those higher wage jobs which continue to be lost at a faster pace than lower wage positions … per Trueup:
“So far in 2023, there have been 1,281 layoffs at tech companies with 322,369 people impacted (1,588 people per day).
In 2022, there were 1,557 layoffs at tech companies w/243,318 people impacted (667 people per day).”
This represents a per day increase of 138% YoY.
It’s also visible in the underlying components of the ISM Manufacturing and NFIB survey data below.
Manufacturing
By the data, we’re already in a manufacturing recession globally…
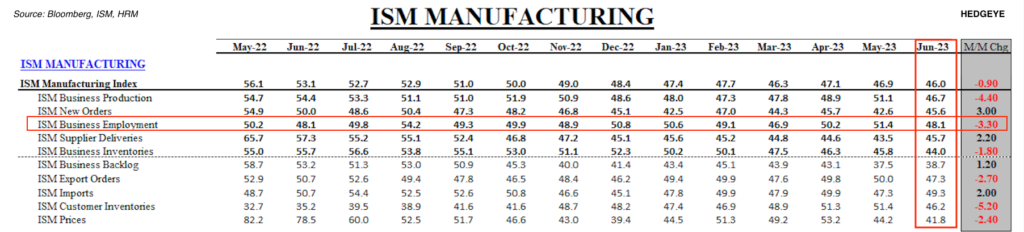
U.S. June ISM Manufacturing Index hit another cycle low, decelerating -0.9 to 46.0, from 46.9, with U.S. Manufacturing PMI’s registering another noteworthy deceleration, falling -2.1 to 46.3, from 48.4. Chart courtesy of @KeithMcCollough 7.5.23
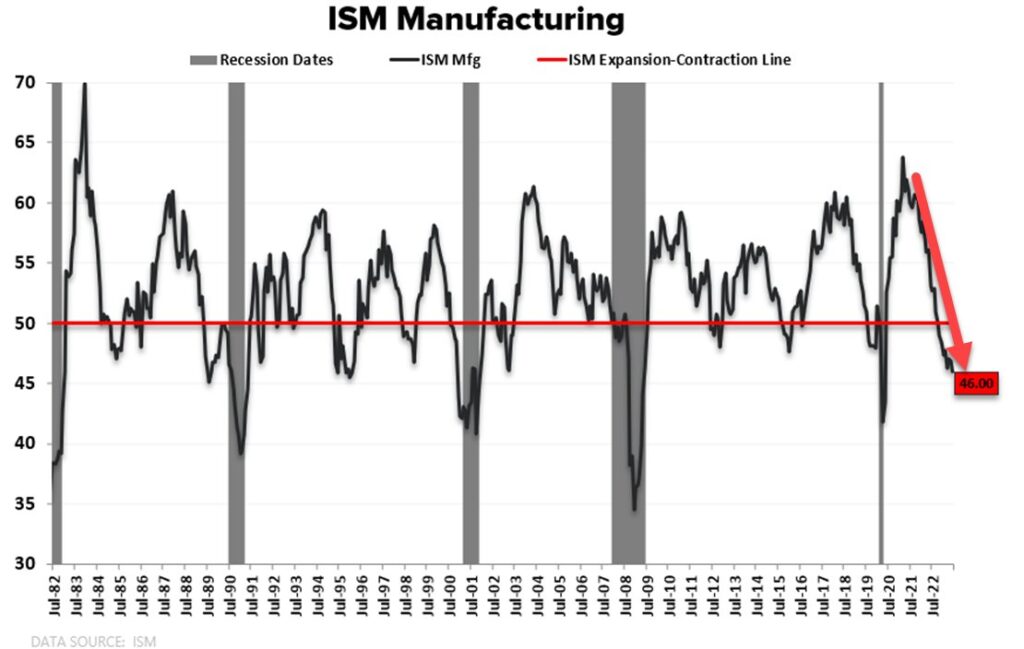
As noted above, the “employment” component of this data setcollapsed -3.3 points from 51.4 to 48.1 MoM; with every subcomponent of the group in contractionary territory with a reading UNDER 50 … again, a reading UNDER 50 means we are in a contraction!
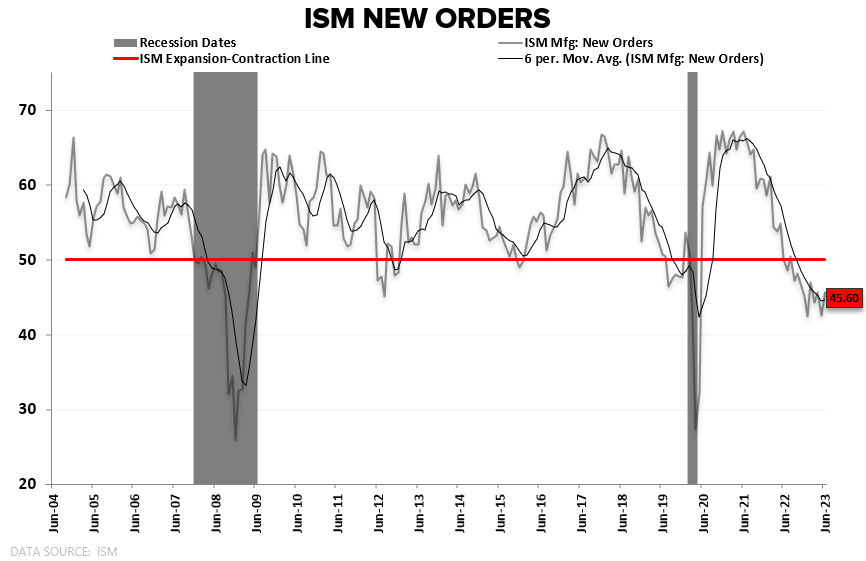
While “New Orders” bounced slightly, the TREND also remains DOWN and contractionary … the last two times new orders were at these levels we were already squarely in a recession.
U.S. Industrial Production is NOW A NEGATIVE -0.4% YoY with June coming in below expectations at -0.5% MoM with a downward revision for May to -0.5%. Chart courtesy of @HedgeyeUSA 7.18.23
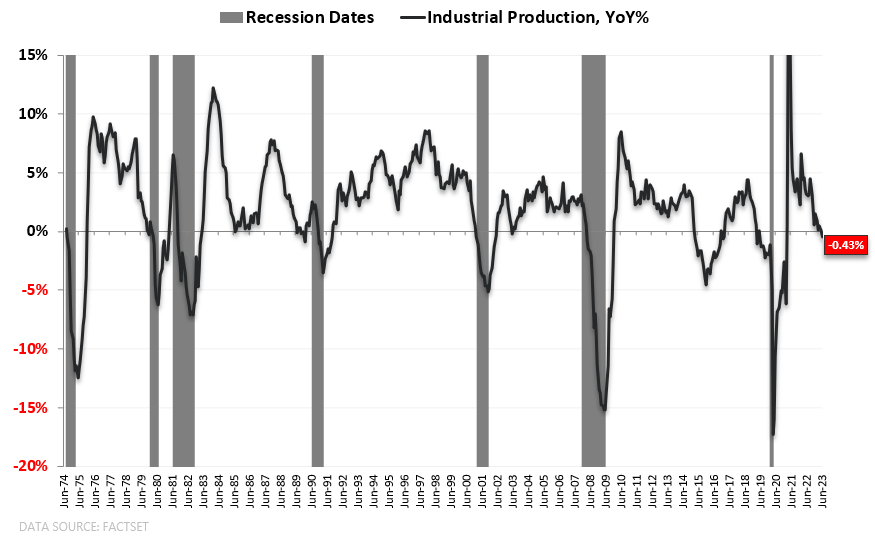
This coincides with the most recent Factory orders data coming in at a new cycle low of negative -0.98% YoY. @HedgeyeUSA 7.5.23.
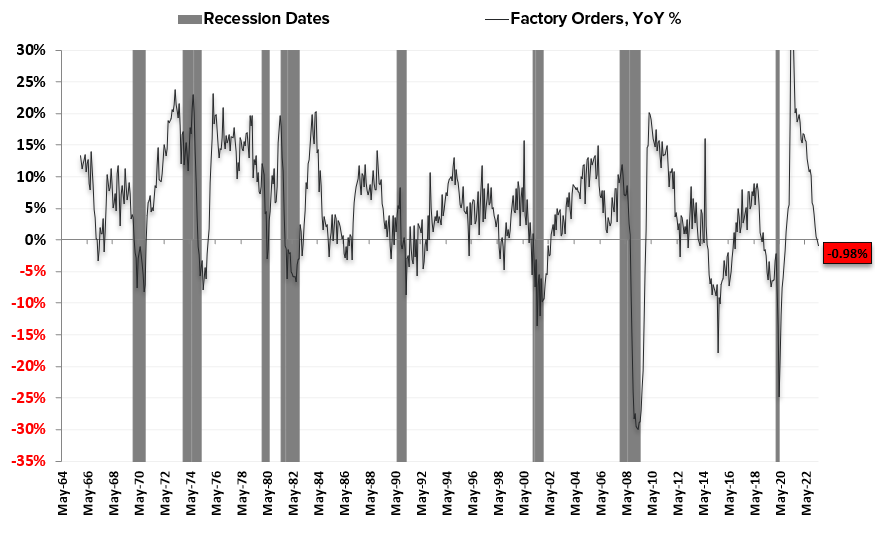
The Factory orders report or (Full Report on Manufacturers’ Shipments, Inventories and Orders (M3)) gives us an in-depth look into new orders, unfilled orders, shipments, and inventories … detailing everything from orders contracting or expanding to backlogs, current sales and again, inventory levels. As you can see above, it, too has an uncanny knack for letting us know we’re either already in a recession or that one is imminent.
This metric is about as good a recession indicator is an inverted yield curve … which, as I currently type is at a frosty -103 basis points, again, taking us back to our point last month regarding probabilities and what the data is saying.
As you can see, we’re currently witnessing a massive contraction in all things manufacturing including the most recent U.S. Empire Manufacturing data for July, which decelerated to up +1.1, vs. June’s up +6.6!
After last month’s acceleration in that single data point, every Wall Street pundit began screaming the “economy is recovering” … while it’s clearly NOT.
Two important notes:
- The intellectual dishonesty and lack of integrity by the whole of Wall Street, including financial media couldn’t be more apparent; selling the “all is clear” narrative, while anchoring on the rebound of a single data point last month. Ignoring the massive decelerations in virtually everything macro is both pathetically sad, and unfortunate.
- The 3 immediate charts listed above clearly illustrate we’re already in a manufacturing recession … and the only thing that brought the U.S. out of these recessions, was the “bail out” reaction function from the Federal Reserve … each needing to be more swift and exponentially larger than the previous!
Though, as we’ve been saying for some time now, given the Fed’s “tools” the luxury of cutting rates and providing exponential liquidity to markets will do nothing more than re-inflate the inflation that the Fed’s been “fighting” … which the whole of Wall Street is now declaring victory over following the most recent CPI print.
Most everything you’re reading to this point is the “other side” of the story, and yet there is no disputing the data, it’s unequivocally factual.
And while this next statement could be wrong, just as the masses had declared inflation to be “transitory”, manufacturing to be “rebounding” and now the fight with inflation to be “over”, the data suggests otherwise … forcing the Fed to remain firm in their higher interest rate policy stance for a longer period of time, doing even more damage when the dam breaks! Allow us to explain:
Inflation
July’s U.S. Headline CPI print for June decelerated -1.0% to +3.0% YoY, with Core CPI falling -0.5% to +4.8% YoY, both slightly “better” than consensus expectations of +3.1% YoY and +5.00% YoY, respectively.
As has been the case, energy and energy related commodities once again led the way down declining -16.7% YoY … this deceleration accounted for a net negative -1.54% in this most recent CPI data. The largest positive contributors remain Core Services (ex: energy) +3.46% with “Shelter” being the largest component up (+2.51%); and while falling, Food also remains persistently high (+0.77).
As we’ve been reminding readers over the past 2 years … each component to the CPI contributes on a lead/lag basis. In regard to oil, as stated by Hedgeye’s Josh Steiner, @HedgeyeFIG on a recent Macro Show (7.13.23 minute 3:38):
The way energy flows through to inflation is that it’s the sequential change in YoY (Year over Year) RoC (Rate of Change) on a 1-month lag, or 1-month lead from energy’s perspective…”
Follow along here … the July 2023 CPI report, is reporting June 2023 data… June 2023 data is affected by “the year over year rate of change, on a 1-month lag”. So, while some may not understand “the why”, that doesn’t change the fact that it does! The price of oil in May of 2022, which was in the $110 … actually matters for the June 2023 CPI report, which was just reported in July 2023.
So does oil up nearly 20% in the last month, not to mention the numerous other commodities which have begun to meaningfully reaccelerate, for the delta vs. the easing base affects mitigates/narrows the negative drag on the CPI, placing upward pressure on future reports.
Additionally, while “Food” (both at home and away from home) in aggregate, have been decelerating, they remains 3x higher than pre-pandemic levels with internal components now re-accelerating. For example, last month the index for eggs fell -13.8% MoM, however, this month they’re currently up roughly +21%.
While the elephant in the room, or the Shelter component (which comprises 33% of the data) remains elevated as we described here in last month’s note … this month’s Case Shiller HPI (Home Price Index) for May came in at +1.5% MoM vs +0.9% in April; home prices are up nearly 5% since the January 2023 trough.
With forward-looking base affects easing into the back half of the year, coupled with ripping commodity prices, the fight with inflation is by no means over! What is most probable is that which we mentioned above (and have been for nearly a year) … “higher for longer” (The Fed) will maintain higher rates for a longer period of time … which is NOT the current base case narrative on the table.
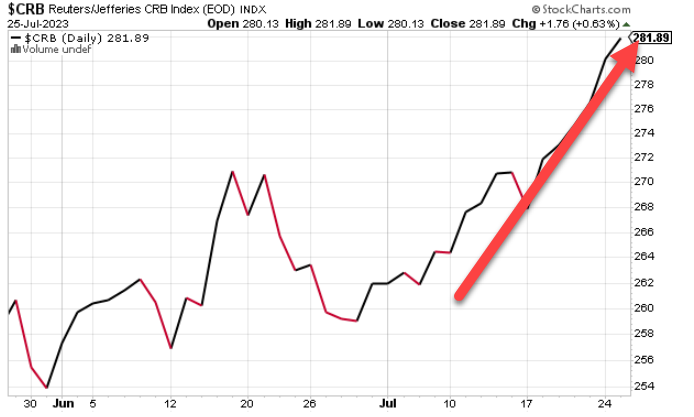
Just as most have declared the war on inflation over, stating the Fed should no longer raise rates, given the data and CPI construction, inflation as measured by the CPI will more than likely begin to re-accelerate as we head into the September Fed meeting. Does this 11% reacceleration in the commodities index look like we’ve won the war on inflation?! Chart provided by @KeithMcCullough 7.26.23
Over the last year, Nick Timiraos of the Wall Street Journal has garnered the nickname “Nickileaks” or “the Fed whisperer” by industry insiders for the timing of his articles and message accuracy vs. that of the Fed’s policy stance to be uncanny.
Given his two most recent articles this week titled, “Why the Fed Isn’t Ready to Declare Victory on Inflation”, and Fed Set to Raise Rates to 22-Year High. Here’s What to Focus On, we will assume our higher for longer thesis will be echoed by a hawkish Fed this week! (Which, while currently in final edits, it’s exactly what Powell is stating).
The bottom line is Inflation will remain high and sticky as global growth continues to decelerate, and central bankers remain firm on their path to higher rates. Given how frequently he references one of the most important lesson or take away to learn from the 1970’s (which he just did again); it’s this reacceleration that Powell is fearful of.
Reality
The economic cycle is clearly squeezing the life out of the majority of the country, and bean by bean, day by day it shows up on balance sheets as companies are forced to report reality. Accountants can finagle numbers for only so long.
We can’t write a missive on each and every company currently reporting, but there is, without question, a rhyme and reason we’re mentioning the names below that we are.
Credit card companies reveal everything from the extension of credit, spending patterns and trends, to the strength of the consumer via delinquency rates. Auto companies and lenders give us a peek at trends in larger ticket item, while truckers, shippers and rail give us a glimpse as to the volume of merchandise that’s being moved throughout the world … and more specifically to us … our country!
So, while the likes of $JPM (JP Morgan) kicked earnings season off with what some might consider to be a “strong” quarter … it’s important to remember that not every company was handed a sweetheart deal on a silver platter with federal regulators gifting them a failed $FRC (First Republic Bank), assuming zero downside risk; this deal closed on May 1st. Ex: $FRC, $JPM’s quarter was ok, but nothing earthshattering … especially when investors are forced to live in the reality of the economy SLOWING drastically as detailed above.
Sans a very few special situations, the tightening of credit is extremely visible in the Fed’s H8 data, with its flowthrough into the broader economy crystal clear in the earnings releases of both $DFS (Discover Financial) and $COF (Capital One). $DFS saw continued margin pressure, loan growth contraction, increased credit costs and expenses. Their reported $3.54 EPS was down 10% YoY, below consensus estimates of $3.67.
Net income was down 18% YoY large in part, due to their aggressive buyback program, having bought back 9% of outstanding shares over the last year.
They experienced lower than expected NII (Net Interest Income) and a HIGHER THAN ANTICIPATED LOAN LOSS PROVISION (SEE: liquidity crisis unraveling rapidly into a credit crisis).
Higher funding costs, increased reserve build and rising charge offs were only to be outdone by the only bright spot in the quarter … a 31% INCREASE in loan fee income flowing through to non-interest income. How can an increase be a negative you ask?! When it’s DRIVEN BY LATE FEES with 30-day delinquency rate up 110bps YoY (1.76 to 2.86) … their highest level since 2011 – well above pre-pandemic levels of 2.3 and uncomfortably close to their GFC high.
Do we really need to explain why increased delinquencies and LATE FEES are bad a bad thing?!
The story at $COF (Capital One) was eerily similar to that of Discover’s with Capital One reporting earnings of $3.52, which was down 29% YoY due to a larger than expected provision expense. The report echoed slowing loan growth, consumer spending and a weaker than expected NIM (Net Interest Margin). As was the case with $DFS, deteriorating credit was crux of Capital One’s report.
- Are we noticing the pattern as of yet?! You should be…
- If you’re earnings were DOWN 29% year over year, would you be able to maintain all of your employees? How about if this trend continues?! (the answer is no)
- If things weren’t bad enough, what do you think happens when a government agency (CFPB) passes regulation which will cap Late fee’s by roughly 75% below current levels … which is in the works!
Both $DFS and $COF are clear examples of a deteriorating consumer slowing alongside the now weekly contraction in lending as it accelerates the pace in which liquidity is being sucked from the system … which is showing up in large purchased as well.
$AN (AutoNation) is one of the larger Auto retailers in the U.S. and on the surface, their most recent earnings release looked OK on the surface, but a quick look under the hood showed operating income down -21% YoY, net income down -28% and a diluted EPS down -7% … the stock was met with a -16% selloff overnight.
On the higher end of “auto” and the “EV” universe, last week $TSLA (Tesla) reported auto production up around 86% with revenues only up 45-ish%, given the average price per car being sold was DOWN -20%, crushing auto gross margins to their lowest point since the pandemic … as Hedgeye Industrials sector head Jay Van Skiver recently noted:
“…operating income was down -2.6% YoY, which doesn’t sound that bad, BUT it’s down -10% sequential and down about -40% from the fourth quarter despite more factories and more production.”
…with inventory up and signaling more price cuts to come. It’s clear that the only way they can move any inventory is by cutting price and financing gimmicks, like providing 84-MONTH LOANS … think about it!
As the consumer runs out of money, and interest on automobiles continue to reach record highs as noted earlier, these products become unaffordable for the masses, which is why $TSLA has to cut price, in-turn squeezing margins … at the same time, the more money spent on a car loan with absurd interest rates over the course of 84 months, the less they have to spend on everything else … 9.17% … chart provided courtesy of @GuyDealership 7.19.23
As if it could be; even more sobering … after analyzing more than 60 years of data, Hedgeye’s Josh Steiner and his team believe the data suggests there to be a 4 o 1 ratio that exists between the growth rate in lending vs. the growth rate in GDP. Be it an acceleration or deceleration for every 1% move in lending, it would equate to a 25-basis point impact to GDP … and as we’ve been detailing, lending is SLOWING.
So, it should not surprise anyone that the volume of goods moving through the country is also slowing … as can be seen through the lens of trucking company $KNX (Knight Swift Transportation Holdings) who recently reported earnings that fell -71% YoY posting net income of $63.3 million vs. $219.5 million, translating into $0.39 vs. $1.35per share YoY. Total revenue decreased -20.8% to $1.55 billion from $1.96 billion while Wall Street expectations were set at $0.55 based off quarterly revenues of $1.59 billion (swing and a BIG MISS).
Ironically, management began the year emphatically stating their “worst case recession” scenario would be $4.00 per share in earnings while guiding to $4.15 … which they cut on last quarter’s miss to $3.35 – $3.55 … which has now been cut to $2.10 to $2.30.
Which, as noted by Hedgeye Industrials sector head Jay Van Sciver @HedgeyeIndstrls, is roughly 50% of the initial guide and management’s “worst case scenario”. Another important call out by Van Sciver is that given what the company’s already reported, the second half of the year’s run rate has to be well UNDER $2.00 in order for their year to come in at that level … signaling even more weakness in the trucking sector as manufacturing continues to contract.
This as LTL Freight carrier $YELL (Yellow) is reported to be a stone’s throw away from bankruptcy. Given Yellow’s internal woes, rumors have been swirling that both $WMT and $HD have already pulled their business from the ailing company … which would near seal their fate.
There is nothing bullish for an industry when competitors are going bankrupt, and your earnings are down 71% year over year. While you may pick up some incremental business, but you can’t maintain employees with that large of a deceleration in revenue year over year.
We are an IMPORT NATION, so when exports from China fall -12.4% YoY with exports to the U.S. being down -23.7% … we’re clearly consuming less. Singapore non-oil domestic exports just decelerated to -15.5% YoY, Indonesia exports for June slow to -21.2% YoY and Hong Kong exports, post a meager bounce remain at -11.4%YoY … as demand collapses, less then needs to be shipped; in turn, truckers have less to move … which should be crystal clear at this point.
The earnings misses have also begun to spill into tech with the 25+ technology companies who have already reported their quarter, down, in aggregate of roughly -20%.
late last week, $SAP missed on the top line bringing down their guidance by $200 million for the year with transactional revenue and weaker public sector to blame … Sinch, a Swedish competitor to Twilio, bombed last week citing tougher market conditions and cost conscious customers; IBM also missed top line earlier last week though re-affirmed their guide for the back half of the year (we wish them good luck, it ain’t gonna happen)!
More importantly, while we noted months ago that $AAPL had cut production of their newest iPhones by 30%, channel checks from Hedgeye Technology sector head Ami Joseph show iPhone production “missing on low end units due to production issues”. Apple is attempting to offset this shortfall with price increases on the newer models.
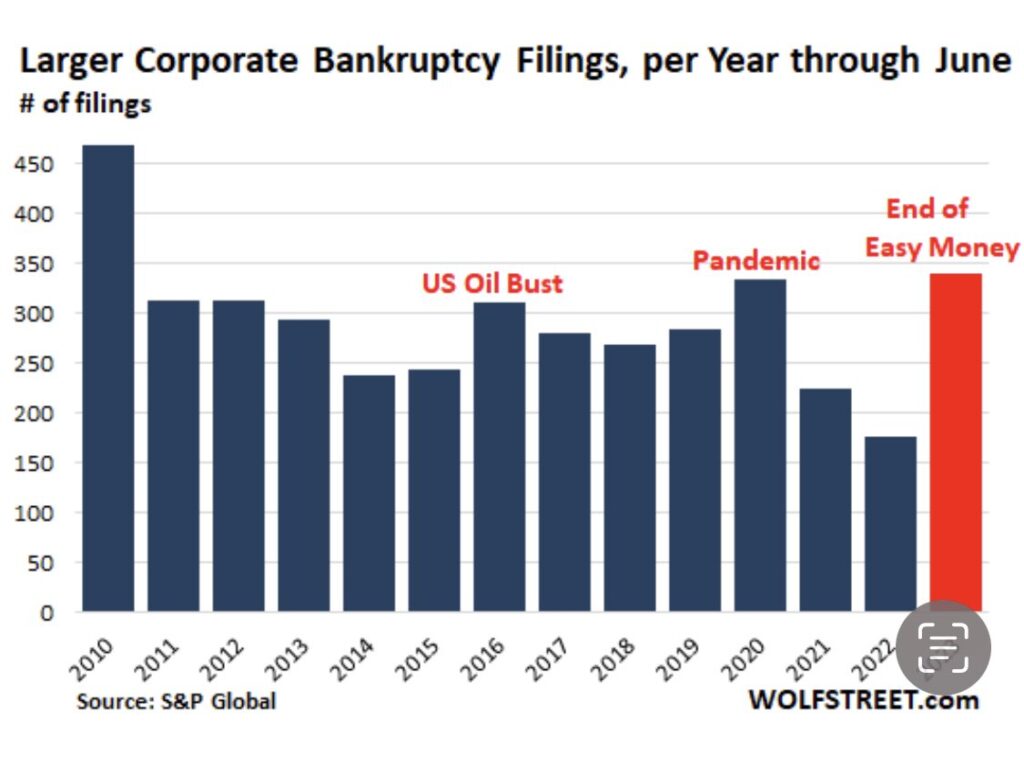
So as $TSLA is over producing and cutting price, $AAPL is attempting to raise price as consumers are choking on debt in an environment in which the cost of capital is bankrupting businesses at the fastest pace since 2010, when the economy was still reeling from the GFC (Great Financial Crisis).
Tesla, along with many other companies are attempting to wholesale their inventory out by selling $100 bill for $80 … and they’re still having trouble. Apple is now attempting to raise prices as demand is slowing and the consumer runs out of money (let’s not forget the resumption of student loan repayments in a few months).
This isn’t the sign of growth or a growth company “accelerating”, it’s the sign that the growth cycle is over, for now. If you’re wondering where we are exactly in the cycle, it’s literally the point where these companies are playing the only (very few) cards left in their hands.
It’s either this or this or they start screaming AI (Artificial Intelligence) … all will ultimately fail, succumbing to the economic cycle.
Colossal disaster
As we look to close this note, we couldn’t talk about the economic cycle and deceleration in everything growth without mentioning the massive Mother of All Bombs imploding in slow motion before our eyes … that being the commercial real estate market.
Per Cohen & Steers, who specialize in real estate securities and alternate income via REITS and preferred securities, the CRE market is roughly $4.5 TRILLION in size, “backed by income producing properties and $470 billions of construction loans. Banks hold roughly 40% of the income-producing loans and around 45% of all CRE mortgages.”
We’re not going to beat a dead horse here, at the same time former chairman of the Federal Reserve Bank of Boston, current head of construction firm Suffolk and chair of the Real Estate Roundtable think tank, John Fish was recently interviewed by Fortune in regard to the current state of the CRE markets. Regular readers will find his very first response eerily familiar (almost as if he took it directly from one of our previous notes).
The article begins:
“A slow-motion crisis is unfolding in the commercial real estate market, thanks to the double-whammy of higher interest rates and lower demand for office space”
You don’t say?! Go on…
When you talk about these large structures, especially in New York City, you get all these buildings out there, almost a hundred million square feet of vacant office spaces. It’s staggering. And you say to yourself, well, right now we’re in a situation where those buildings are about 45%, 55%, 65% occupied, depending on where they are. And all of a sudden, the cost of capital to support those buildings has almost doubled. So, you’ve got a double whammy. You’ve got occupancy down, so the value is down, there’s less income coming in, and the cost of capital has gone up exponentially. So, you’ve got a situation where timing has really impacted the development industry substantially.
Almost as if there was no better way to say what Hedgeye’s Andrew Freidman did in September of 2022, which is why we quoted it verbatim in our September note:
“The fundamental problem here is that you have entire business models and capital structures that have been built up over the past decade that were just based off of zero percent or very low levels of interest rates and now with rates and spreads where they are, and continue to go, the math just doesn’t work.” Andrew Friedman @Hedgeyecomm “The call” 9/27/2022
This is an entire industry, built on a low cost of capital model, that can’t structurally function as term loans roll-over … much of which is owned by private equity, but also by pension funds, endowments through private equity; and yes … regional banks.
While a company like BREIT refuses to admit reality and PE haven’t taken their marks (this will not end well).
Final thoughts
In this note we’ve attempted to lay out what you’re not hearing … again, good or in this case, bad, we are telling you what we would want to hear if the roles were reversed. We’re NOT writing a narrative we’re providing you with factual/empirical information supported by the data.
Banks are pulling back on lending … FACT. Consumers are running out of money … FACT; just this morning luxury brand $LVMH reported negative sales in the U.S. … FACT; this is the highest of HIGH-END SHOPPER that the economic cycle is adversely affecting, how do you think the majority of American’s are doing?! The flow through to companies’ balance sheets is happening in real time … FACT!
Even the AI narrative is crumbling for just this last night, $MSFT told the world that AI will be a more “gradual” build out over time, as they’ll be spending nearly $2+billion to get their AI projects off the ground, with incremental revenue of a few hundred million coming in to offset things in the short term (talk about selling $100 bill for $80).
But, but, but … it’s the way of the future!
- Is it?! It’s an unproven technology in many ways including accuracy.
- Then add the hundreds of billions in market cap to the stock price when they deliver the goods!
Currently, AI is losing steam as Reuters noted earlier this month:
ChatGPT, the wildly popular AI chatbot launched in November, saw monthly traffic to its website and unique visitors decline for the first time ever in June, according to analytics firm Similarweb.
Worldwide desktop and mobile traffic to the ChatGPT website decreased by 9.7% in June from May, while unique visitors to ChatGPT’s website dropped 5.7%. The amount of time visitors spent on the website was also down 8.5%, the data shows.
Again … it’s what “THE DATA SHOWS”
We’re seeing weakness in everything from luxury goods to semiconductors and the entire technology supply chain. $TSMC (Taiwan Semiconductor) saw high performance computing down -5% sequentially, a segment the high flying $NVDA is in … which means either someone else in the space (like $AMD) is getting absolutely crushed or $NVDA isn’t executing as they led on, only time will tell!
Having said all of this, our positioning is still extremely cautious with a mild bullish slant. The options gamma and 0DTE options we’ve discussed in the past is changing the investing landscape in the short term, at the same time, it’s created a casino built on a sand foundation … As the economic cycle continues, accelerating the layoff cycle, financial markets have the capacity to get very dark, extremely quickly.
As we learned in 2020, multiple limit down days are not out of the question as earnings continue to decelerate in the face of more difficult comps. Many things have the ability to dry up the current passive bid from less money being contributed to 401ks as individuals who have been fired no longer contribute, to companies needing to preserve capital reducing buybacks as capital becomes exponentially harder to raise while it costs even more to carry?!
It could easily be a continued implosion in the CRE markets as the repricing of loans at higher rates persist creating a credit crisis of epic proportions sparking a cascading liquidity event numerous financial institutions very well can fail?! The same thing can also easily be triggered by an event in corporate debt markets with nearly $1.5 trillion dollars needing to be repriced at levels the system simply can’t tolerate as detailed last month?! I honestly don’t know what the trigger will be?!
But I do know what both the data says today and how markets have historically responded to it. We also know that the Fed just raised rates again into a manufacturing recession and said they have no plans to cut rates for nearly a year. We have a very good understanding as to what the government’s interest expense will be should rates stay at these levels and tax receipts continue to plummet.
We are very familiar with the debt maturity wall in corporate bonds and how bond ETFs structurally work in the event of fallen angel risk … and then there is the mountain of adjustable CRE loans which needs to be repriced (it’s only $1.4 TRILLION between now and the end of next year)!
We do NOT believe this ends well … either way, we have a plan, and will remain data dependent!
As always … Good Investing!!

Mitchel C. Krause
Managing Principal & CCO
Please click here for all disclosures.

