

In This Article


Addicere…
The above word may look familiar to you, not because you know it’s meaning, but the meaning of the word that’s derived from it?! ‘Addicere’ is Latin for “enslaved” or “bound to” … foundationally, it is root of the word, ‘addiction’.
Merriam-Webster defines the word, ‘addicted’ the following way: “exhibiting a compulsive, chronic, physiological or psychological need for a habit-forming substance, behavior, or activity” or “strongly inclined to do, use, or indulge in something repeatedly.”
Initially, the term ‘addiction’ was solely limited to excessive alcohol use. It wasn’t until the 1980s that the word became linked to substance abuse and its recognizable patterns as a collective.
Advancements in technologies, such as neuroimaging, have opened the doors for researchers to see how the brain reacts under certain conditions and stresses and how the brain of an addict works under certain conditions. These breakthroughs have made it even more clear that “addiction” exists in multiple facets of ‘life’; including but not limited to things as simple as the consumption of sugar to smoking, gambling, shopping, sex, and on…
Addiction influences the brain and manifests most frequently in three ways:
- craving for the object of addiction,
- loss of control over its use, and a
- continued involvement, despite the consequences (which are often severe and adverse)
Tragic consequences and dire outcomes are most frequently the product of addiction.
For better or worse, I don’t drink, do drugs, or smoke … my consumption of processed sugar these days is at an all-time low and my shopping is pretty much limited to necessities; more importantly, I don’t gamble … If I’m addicted to anything it’s my process and discipline.
I apply process and discipline to all aspects of my life, putting my family’s physical and mental health first. The most affluent in the world can’t buy “health” and there is no pharmaceutical product that comes without some type of adverse event. With life being such a gift, exercise and clean living/eating are paramount!
A clear mind paves the way for better decision making, which again, pertains to all facets of life, especially when applying process and discipline to our work. Those close to me would likely suggest my work might be an addiction (second only to my family)?! I’d liken it more to an obsession/passion, as I attempt to be keenly aware as to not let it drown out the beauty of life … but managing risk is a very serious business.
Waking up at before dawn (5:00am) daily and working through the global macro data has become routine. However, when conditions, like the one’s we’re currently experiencing arise, our addiction or resolve to make sure we’re on the proper path only grows stronger.
And here’s the thing … as our relentless pursuit to figure out what, if anything we might be missing intensifies; given the severely of the dislocation in markets from the data, other than some price action is a select few securities, the only thing we can find that’s changed … is the data continues to deteriorate, in MOST cases, at a faster pace! A few other examples of this would be:
In 4Q2017, we titled a section of our note, “Cloudy with a chance of Meatballs” (an homage to the children’s film after having watched it with my daughters). In that section we said:
“If the weather report suggests a 20% chance of rain tomorrow, how many people would carry their umbrella? Be truthful – the answer is virtually no one. Human behavior suggests most people either round large probabilities up to 100% likewise, they round small probabilities down to 0%; but if it actually rained, most people would more than likely be upset with the weatherman…”
That note was written in the face of the now infamous, extreme volatility spike known as “Volmageddon” sending markets significantly lower in an extremely short period of time. As usual, most didn’t carry their umbrellas … we did.
In our August 2019 monthly, we cited World series poker champion Annie Duke and her book; “Thinking in Bets; Making Smarter Decisions When You Don’t Have All the Facts”. Again, this note was written a mere few weeks before the use of O/N Repo (or Overnight Repurchase) interbank lending markets exploded to extremes that September. We continued to educate readers on Repo markets, through our December 2019 note here)
Finally, on January 26th, 2020, we emphatically warned readers, in the face of market euphoria, about, “The Importance of History … and boy is it “Rhyming” Today”, three weeks before one of the fastest and largest market collapses in history.
There are a few important takeaways from these thoughts. 1. While the timing was impeccable in most cases, there were a few instances where a. patience was necessary and b. markets moved against the data for a brief period … MORE IMPORTANTLY:
In the face of that “market euphoria”, the data over those periods never got better … it got worse. While some investors didn’t want to ‘miss out’, we stood firm in our discipline and process; and when February 19th through late March arrived, and most got decimated … we did NOT. Then, just as is the case now, the data was/is the data which when coupled with an “event” became/will become lighter fluid on an already burning fire.
Circling back to August 2019, in the Odds over Outcomes section of our note, we presented readers with a simple question:
“If you knew the odds of any specific outcome was 85% in one direction or another, what would you do?”
We continued:
If the weatherman’s computer models called for rain with an 85% probability, we are much more likely to grab our umbrellas then if s/he called for a 15% chance of rain; 85% is a much higher probability then 15%; our risk of getting wet is MUCH greater with an 85% chance of rain then the 15% chance of it not raining …
“So, I’m going to ask again”, we wrote, “If you knew the odds of any specific outcome was 85% in one direction or another, what would you do?”
You’re going to grab your umbrella, with the understanding, “that there is always a chance of the minority percentage of any specific outcome occurring.” OSAM August 2019
When discussing thing like the SLOOS data, and the ongoing tightening in bank lending standards as we have multiple times since last August, it’s not up for debate that when 2 out of the 3 questions asked to Senior Loan officers in the Federal Reserve’s survey inflects to a net tightening, we’ve seen a recession “shortly thereafter” every single time … it’s a 100% batting average.
It’s also not debatable that currently, we’re seeing net tightening conditions in all 3 questions being asked to the senior loan officers (which will make things MUCH worse for the economy).
And while the extension of credit is a MAJOR driving force of the macro cycle, and the SLOOS data has amounted to a 100% success rate, and it’s by no means the only set of data points screaming to grab your umbrella, which we’ll discuss throughout the piece.
Markets are addicted to liquidity … it is their preferred drug of choice … they crave it, have no control over it and don’t care about or even understand the severe consequences tied to it! And while the Treasury Secretary might be able to temporarily influence flows when draining $700 billion from the TGA (Treasury General Account) while issuing no treasuries to sterilize the transaction (due to the debt ceiling) … spending down the TGA didn’t FIX the data, economic cycle or remove gravity from the equation.
With the resolution of the debt ceiling and refilling of the TGA underway, as we described last month, liquidity is once again ROLLING OVER.
It’s important to remember, while “flows” can and will impact markets in shorter term intervals (weeks to months), in the end, the macro cycle + data has been undefeated; it’s where our odds are the best, which is the very reason the data is at the core of our process and discipline … which, we’ll again present this month with comment; but without bias.
The consumer/retail sales
The consumer struggles highlighted last month continue. Visible virtually everywhere you look, but for starters … May’s U.S. Consumer Confidence, came in 102.3, down 1.4 points from April’s reading of 103.7; its third consecutive monthly deceleration with both ‘Expectations’ and ‘Present Situations’ decelerating to 71.5 and 148.6, respectively, which remain well below readings seen prior to the pandemic; which were in the 120 to 140 range at the time.
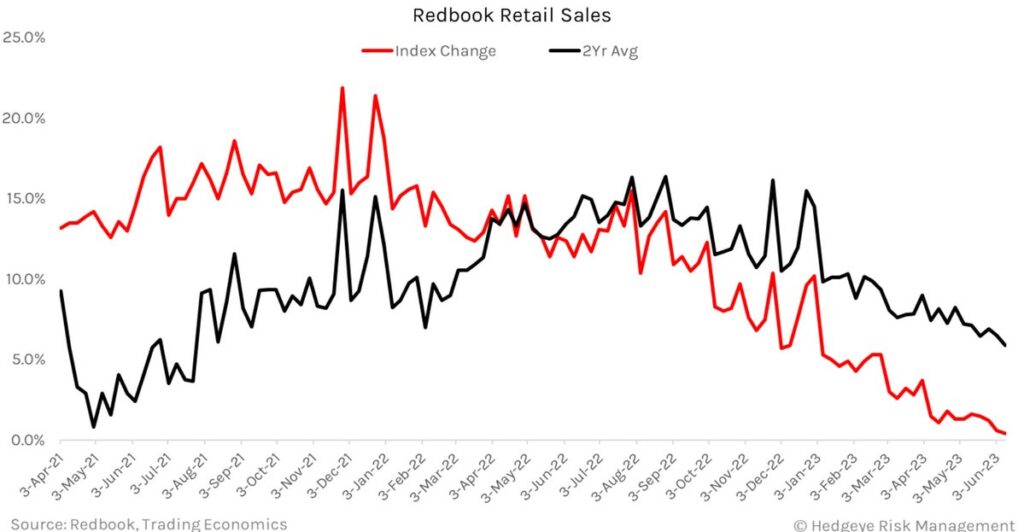
This lack of confidence (and savings) is weighing heavily on the consumer as is clearly visible in Retail Sales data with May’s final Redbook Weekly Retail Sales data touching a new cycle low of +1.2% YoY, then subsequently making two more sequential cycle lows the following weeks at +0.6% YoY and +0.4% YoY … only to see a de minimis rebound of +0.9% YoY with the help of easier YoY comps.
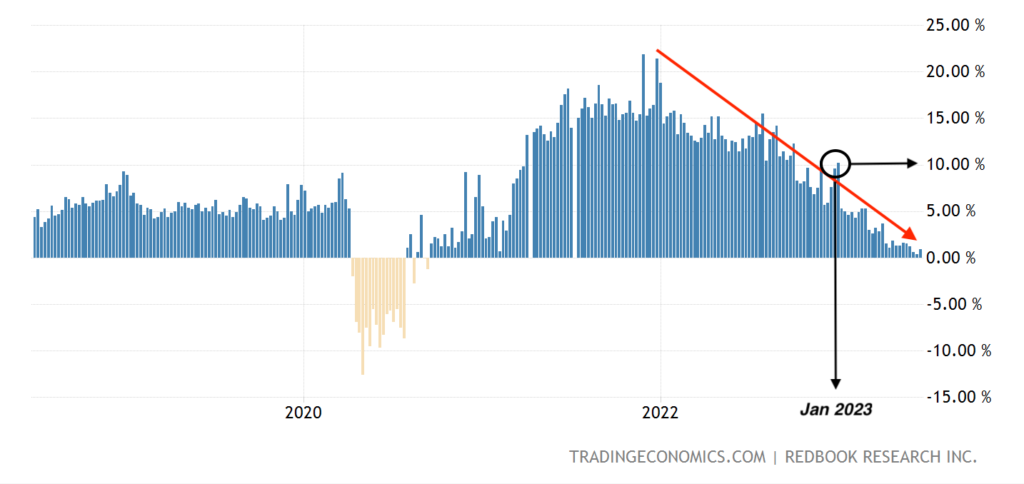
The below graphic gives you glimpse at the speed of the deterioration … courtesy of @Hedgeye’s CEO @KeithMcCullough
This data set has typically been a relatively good leading indicator for Headline Retail Sales, which came in mixed/muddled for May with a slight headline “beat”, but a net negative for the economic cycle.
Broken down, the slight acceleration in the headline number from 1.2% to 1.6% came squarely on the backs of a slight rebound in ‘building materials’ (which has been decimated) and an easy auto sales comp (which equate to roughly 20% of the index)
When looking at both, the Control Group and Retail Sales Ex-Auto, both decelerated to new cycle lows sequentially with Retail sales Ex-Auto +0.1% MoM, and 1.0% YoY, respectfully.
Higher building material costs will continue to pressure inflation higher, preventing the Federal Reserve from shifting to a lower cost of capital (which becomes more pertinent with every passing day), while Auto loan delinquencies continue to rise as interest rates on Auto loans remains pinned high.
Additionally, U.S. Redbook Weekly Chain Store Sales rests near their cyclical lows, sitting at +0.9% YoY.
This slow painful meltdown continues to manifest in small business optimism with the NFIB Small Business Index languishing, with May’s data coming in +0.4 at 89.4; it’s 17th consecutive month below the near half century average of 98.
Per the Report: “Small business owners expecting better business conditions over the next six months declined one point from April to a net negative 50% … Overall, small business owners are expressing concerns for future business conditions … Supply chain disruptions and labor shortages will continue to limit the ability of many small firms to meet the demand for their products and services, while less severe than last years’ experience.” said Bill Dunkelberg, NFIB Chief Economist
Concerns for future business conditions always lead to layoffs … which is a perfect Segway into:
Labor markets
Following a brief deceleration in Weekly Jobless Claims at the beginning of the month to +233k, the data series resumed its trend in reaccelerating to up +261k, +262k and +264k in consecutive sequential weeks.
While volatile, this data continues to support what we’ve noted for a few months now, most recently in our May note … “claims TROUGHED September 24, 2022, at +182k and is trending higher; UP 45% from the cycle low” … now sitting at a 20-month HIGH.
When you dig into the data even further, the numbers look much worse than on the surface, for example, continuing claims in the state of CA are up 20% YoY vs. the 18% YoY national average (think: Silicon Valley tech layoffs)
As we noted in our 4Q2022 note, published January 27th, 2023, this labor cycle will be much more damning given the nature of who is being fired:
“when accompanied with the fact that the majority of layoffs we’ve seen to date have occurred much higher up the wage-earning pyramid than in previous cycles, our problems are compounded even further.
Hedgeye’s Josh Steiner summed this up brilliantly in his January 6th Early look note:
“In cycles past, it has been the base layer of the employment pyramid (lower skilled / lower wage) that has borne the brunt of the fallout in the form of significantly elevated rates of unemployment, particularly relative to the higher layers of the pyramid. This time around, however, this seems less likely to be the case. The newsworthy, large-cap layoff announcements that are happening with increasing frequency are not base-layer cullings, but those squarely in the middle to upper quintiles of earners. Facebook (Meta) announced 11,000 layoffs in early December last year (13% of its workforce) and its median-paid employee earns over $280,000/year. Yes, 11k people on a labor force base of >150M is small, but on a wage-adjusted basis, it gets larger.”
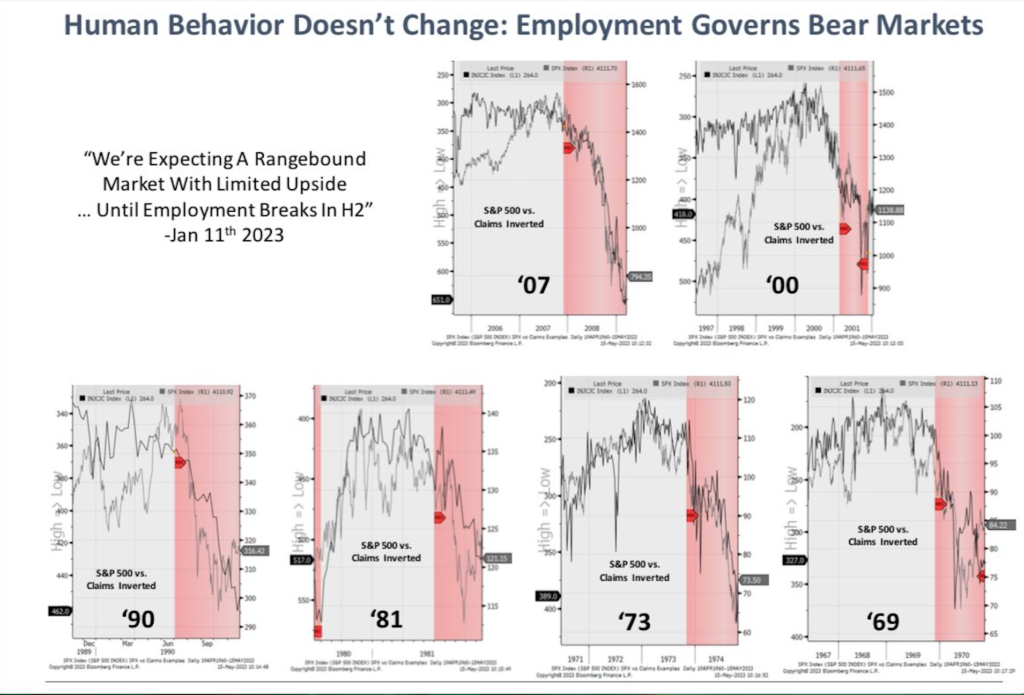
We’ve been detailing the labor cycle for nearly a year now … have suggested cycles take “time and space”, and specifically highlighted the importance of the data troughing roughly a month after it did; and will continue given it’s correlation to markets rolling over as we detailed last month with the help of Chief Investment Strategist at Piper Sandler, Michael Kantro:
Per the work of Danielle DiMartino Booth and Quill intelligence, 91% of the U.S. population lives in a state where continuing claims (the number of people collecting unemployment benefits) are rising…
The majority of the aforementioned layoffs are in a much more highly compensated income bucket, most of which will be receiving severance packages, something we were VERY SPECIFIC with in our 3Q2022 note section “Odds and Ends”:
“Two quick important notes on labor: 1. As we continue to say, it’s the latest of late cycle indicators, patience, it’s coming (unfortunately). 2. When management gets fired, they often receive severance “packages”, which means no unemployment is filed until the “package” is exhausted; keep this in mind as we head into 1Q2023.”
Point number 2. being extremely important as it’s more than likely suppressing labor data.
I want to be crystal clear with this … I am NOT rooting for any one single “individual” or “income class” to be fired over another, I’d prefer no one get fired (which is why we’ve attempted to prepare readers for over 17 months now … that job losses would be ugly and inevitable).
The fact of the matter is that higher income earners simply consume and spend more money; it’s the point we believe Steiner is driving home when he notes “on a wage-adjusted basis”. We believe the avalanche scenario we’ve mentioned, both in November and December is much larger than most are modeling, though similar to an iceberg where 90% of the danger lies beneath the water line, when this avalanche gets rolling, it will collapse in a blink taking out most in its path.
Avalanche, iceberg, sinkholes … they’re all the same analogy … the surface area is last to cave!
Readers should have a clear understanding of the labor markets; employment has peaked, unemployment has troughed and highly paid employees receiving severance packages have been taking time to show up in the data, but they are.
Citigroup just announced they’ll be laying off 1600 workers, RedHat announced layoffs a few weeks ago with very good sources suggesting there will be another round in July. Amazon just laid off AWS (Amazon Web Services) employees, with no rhyme or reason as to why those who got fired, did … leaving many within the division on edge, searching for new jobs. (See: confidence (or lack thereof))
Though what began in the higher waged, white-collar neighborhoods (as we noted nearly 9+ months ago), is now giving way in the lower income level positions as well.
Data out of Indeed.com is now showing current job openings at the lowest income levels are evaporating the fastest, per Bloomberg:
The slowdown has been broad-based across industries, but it’s been particularly pronounced in low-wage sectors — for the type of positions that saw the biggest gains as the economy recovered from the pandemic.
Indeed, is literally the number one job site in the world, they have their finger on the pulse of real time data for the entire U.S. workforce, so it’s important to pay attention when the below is noted by Bloomberg:
“Indeed says its tracker has been leading other measures by several months in the past.”
…especially when it comes to understanding the data and putting the odds in our favor.
Similar data is being reported by LinkUp, another global leader in delivering accurate, real-time, and predictive job market data to capital markets and corporations for over 20 years. They have indexed over 60,000 companies in 195 countries, it’s safe to say they have a solid grasp of labor data.
Again, risk happen slowly, then all at once!
Before moving on, it’s extremely important to understand the Fed has already acknowledged that the unemployment rate will rise … it’s part of their goal! So, this mild acceleration in the data won’t be enough to knock them off their “killing Inflation crusade”, thus maintaining the “higher for longer” interest rate mantra; choking both the consumer and businesses who need a cheap cost of capital to operate … which will ultimately be crushing to the economy.
In the meantime:
Inflation remains elevated
U.S. Headline CPI for June decelerated -0.9% to +4.0% YoY; with Core CPI decelerating by to +5.3% from +5.5% YoY, a delta of -0.2%.
While this deceleration should help most all consumers on the margin, we’re still looking at +6.0% YoY price growth in most things that matter to the consumer, (like food at home, medical, shelter, wireless and some energy related items).
With Headline CPI remaining near 4.0%, we continue to sit 100% higher than the Federal Reserve’s arbitrary target of 2.0% … used cars/trucks and shelter also remain in the positive contributor category; with cars & trucks up +4.4% MoM and shelter accelerating +0.6% MoM and +8.0% YoY.
While we’ll discuss current housing dynamics in more detail below, given shelters weighting of 33% in the CPI data … and its 12-to-15-month lag showing up in the data, any additional strength in this metric is simply working against the Fed’s ‘goals’ of a 2% inflation target.
Based on the math, we’re more likely to maintain inflationary levels in the high 3’s to low 4’s for the foreseeable future … when coupled with the superficial labor market reports, failing to catch the internal deterioration, this will continue to keep the Federal Reserve in their higher for longer missive.
Again, we consider it absurd that the Fed bases policy decisions off these metrics, as Fed policy is contributing to increased inflation as recently explained by Michael Green in a recent substack which can be read in its entirety by clicking here:
“Jerome has managed to begin creating his own inflation. Roughly 20% of the “Core Services ex-Housing” metric includes factors that are directly tied to the level of interest rates.”
The Fed’s policy is literally destroying the overall economy … the impact of raising rates at such an expeditious rate is fueling the contraction in credit (by design); when coupled with deteriorating labor dynamics, (by design) it continues to bleed through to the consumer (by design), which is clearly visible in their lack of confidence and abysmal retail sales data. These pressures are even more visible when viewed through the lens of:
Manufacturing
With the EXCEPTION of a large bounce in the June Empire Manufacturing data from -31.8, to +6.6 and minor acceleration in May’s Services PMI data which accelerated to 54.9, vs. 53.6, manufacturing data has been deplorable at best. To contextualize ‘deplorable’, sub 50 data is contractionary … another sign of a manufacturing recession in progress.
The Empire Manufacturing data set has been extremely volatile, and this “rebound” comes following a massive collapse (it’s important to remember TREND duration over short term trade duration) … especially when considering the internals of this data set, do NOT line up with any other data sets around the globe … nor does the mild acceleration in Services PMI.
For example, “shipments” were the driving force behind the Empire data set, and yet … manufacturing data around the globe has come to a grinding halt with most all data suggesting we’re already in a GLOBAL recession. (which continues from our 2Q2022 monthly)
We saw deceleration in both U.S. Import and Export Prices for May, as they turned negative YoY this month:
- May Export Prices fell -1.9% MoM, vs. +0.2%; a -10.1% YoY deceleration.
- May Import Prices fell -0.6%, vs. +0.4%; a -5.9% YoY deceleration.
As Hedgeye Director of Research recently called out: “The YoY decline in export prices were the largest since the series was first published in 1984, while the fall in import prices were the largest decline since May 2020.”
- June Philly Fed Index slowed to -13.7
- U.S. Industrial Production for May fell -0.2% MoM, vs. +0.5% MoM in April
- Industrial Production slowed to +0.2% YoY, while also slowing MoM (recessionary)
Business is contracting…
U.S. ISM Manufacturing for May slowed to 46.9 vs. 47.1 in April, (again, anything under 50.0 is contractionary), with the NEW ORDERS component of the series falling off a cliff to 42.6, from 45.7(contractionary).
New orders are indicative of future demand; new orders slowing is a sign the probability of future demand is much more likely to be WEAKER. Weaker demand and less pricing power = less consumption leading to more layoffs. (The Ouroboros continues)
It’s not as if we’re guessing here … per the report, manufacturers observed “solid contraction in new orders amid muted demand conditions.”
We’re seeing the same thing across the board in the U.S. Manufacturing PMI data for May slowing to 48.4 (also contractionary) with ISM Services decelerating AGAIN, to 50.3 vs. 51.9 (just barely keeping its nose above 50 in expansionary territory … for now).
The dynamics around the GLOBE are no better…
Business Backlogs face planted, falling to 37.5 vs. 60.0 YoY, as accumulated backlogs that developed throughout Covid have all been worked off … so, it shouldn’t surprise anyone that U.S. Factory Orders for April came in weaker than anticipated at +0.4% MoM, vs. an already downwardly revised +0.6% MoM increase, “missing market forecasts of a 0.8% jump.”
- Europe’s June Manufacturing PMI decelerated to 43.6 vs. 44.8.
- The United Kingdoms’ Manufacturing PMI decelerated to 46.2 vs. 47.1.
- France’s Manufacturing PMI registered a 45.5 vs. 45.7.
- German Manufacturing PMI for June collapsed further to 41.0 vs. 43.2.
Adding insult to injury, Germany’s April Industrial Production registered a paltry +0.3% MoM and +1.6% YoY.
South Korea exports were down -15.2% YoY in May, with semiconductors being down -36.2% YoY. Given all the recent hype in semi-conductors over AI (Artificial Intelligence (which has been around since the 1950’s, the most recent iteration since the 2008/2009)) and $NVDA, the data is suggesting a complete lack of demand in certain chips.
While May Exports for China were down -7.5% YoY with Imports being down -4.5% YoY (China imports/exports lead US data by roughly 3 months)
We’re staring at an outright Global Manufacturing blood bath with the macro data continuing to deteriorate at an unprecedented rate.
We don’t ask the data to be good or bad … that’s the purpose of a process, we just position to it. If the data were accelerating, we’d simply flip our positioning to reflect the back tests, but it’s not accelerating, it’s falling off a cliff by virtually every economic metric and data point … EXCEPT for:
Housing
Which is currently mixed and showing signs of life … but not as you may think.
From the start of this disinflationary time period dating back to the economic cycle peak of November 2021 and peak in home prices (July 2021), existing home sales have slowed, with May data coming in at a 4.3MM SAAR which are down -20.4% Year over Year … but the drawdown in home prices have barely budged as recently illustrated by Charles Schwab & Co’s Chief Investment Strategist, Liz Ann Sonders:
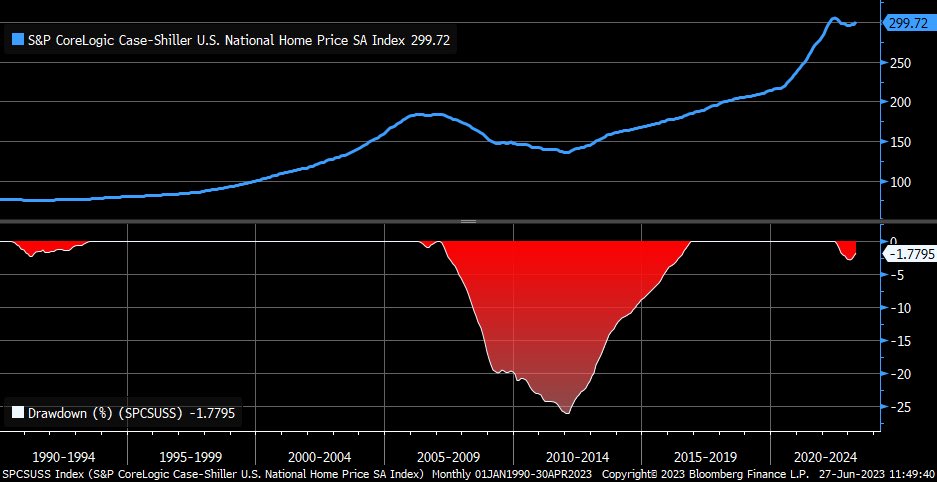
WHY?!
Given current dynamics in the housing market, an obscene number of those with a mortgage are currently “rate locked” … new inventory has been very difficult to come by, which propelled June Housing Starts to up +21% MoM. Given a very limited supply of inventory, the demand for new homes to be built, even in the face of extremely challenging borrowing conditions, has begun to accelerate.
Rate locked
[the Fed] “created an artificially low, even negative interest rate environment in many parts of the world for an unprecedented time frame.
we have stressed the importance of how that debt is used, as well as the length of time this debt has been available to access … for our opinion is the time variable will ultimately prove to magnify future negative outcomes.
The reason time (access to this debt for an abnormally long, prolonged period) is such an important factor is it has given everyone (every government, corporation, consumer, student, car buyer, etc.) with a pulse, the opportunity to lower his or her interest rate … If only a small percentage of “borrowers” were accustomed to low rates, their refinancing of debt at higher levels wouldn’t be such a big deal, the world could handle incremental increases, but when it’s the masses, it’s just like yelling fire in a movie theater.”
The product of artificially low rates available for such an absurd amount of TIME … 92% of all current mortgagees carrying a rate LOWER than 6%; last I checked, with current rates north of 6.7% (arguably higher for most borrowers based upon the tightening of credit standards we’ve been discussing and the approval process) most Americans won’t be selling their houses any time soon (as they can’t afford the higher monthly payments).
Now, you may be saying … 6.7% isn’t too far from 6.00 … to which I’d say … 82% of borrowers are sub-5%, 62% are sub-4%, and roughly 25% … sub-3%!
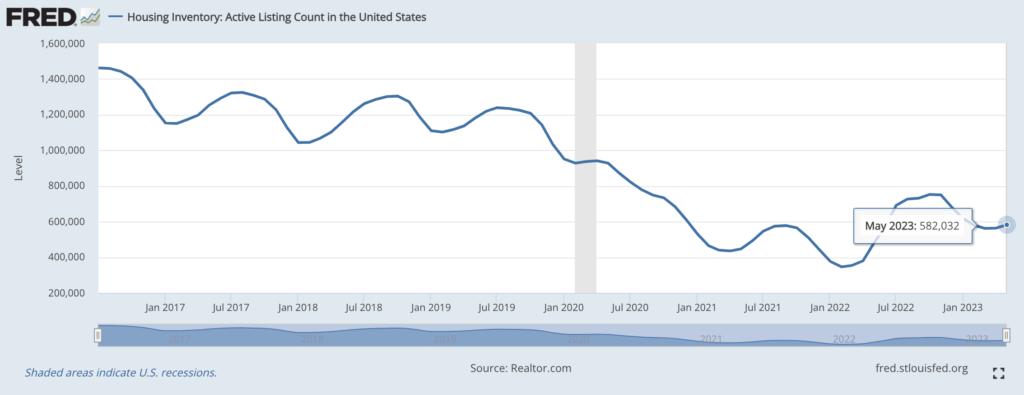
With this data in hand, is it becoming more clear why listings of existing homes for sale are at an all-time low per recent Redfin data, dating back to the onset of their data series which began in 2012.
What the already choking consumer is saying, is that they’re going to really have to love that new home and be extremely secure in their high paying job, if they plan on increasing their mortgage payment by 75% to 100%?! OR … they’ll just wait!
Which also shows up in the Redfin data:
Just over one-quarter (27%) of U.S. homeowners who are considering listing their home in the next year would feel more urgency to sell if rates dropped to 5% or below. That’s according to a Redfin survey conducted by Qualtrics in early June. Roughly half (49%) would feel more urgency if rates were to drop to 4% or below, and the share increases to 78% if they were to drop to 3% or below—a situation that is highly unlikely any time in the near future.
Existing home sales are being hit with a healthy dose of reality vs. expectations … with the Fed more likely to raise rates at least two more times this year, rates aren’t coming down anytime soon.
So, while the number of existing homes fell 6.1% YoY to 1.08MM units, which is the lowest reading since 1999 … demand for new homes troughed in December and have begun to incrementally increase … as seen in the June NAHB Housing Market Index, which accelerated to 55, from 50 MoM, its highest reading since July of 2022, alongside “foot traffic” of potential buyers visiting models.
U.S. Housing starts for May also accelerated again to 1.631MM, vs. 1.340MM in April, and May Building Permits (typically a leading indicator) also accelerated to 1.491MM, vs. 1.417MM MoM.
While 582k active listings is off the February 2022 trough, it’s still at historically low levels…
Bright spot or NOT?!
We question whether or not this data is a bright spot or not for a few reasons. 1. While this could be incrementally positive for GDP, 2. it should keep inflation at levels in which the Fed will maintain their “higher for longer” policy stance, which is both, net negative for GDP and more importantly, crippling for regional banks, CRE markets, businesses, governments, consumers, et. al, … plus the over $1.5 TRILLION in debt that needs to be rolled over/refinanced in the next year and a half (discussed in more detail below).
At the same time … there is a small disconnect in the Weekly Mortgage Purchase Applications data, which has decelerated for multiple weeks sequentially, down -2.46%, off the heels of a -1.4% slowdown which followed a -3.7% deceleration; this series is down over -30% YoY, so while there has been some positive housing data, it’s too early to tell how things move forward … especially in the face of what could be massive layoffs.
And we almost forgot … as recently reported by the USA today:
“Among homeowners who bought in the past year, 46% say they are struggling to afford their monthly mortgage payments due to high interest rates.”
Yea, seriously?!
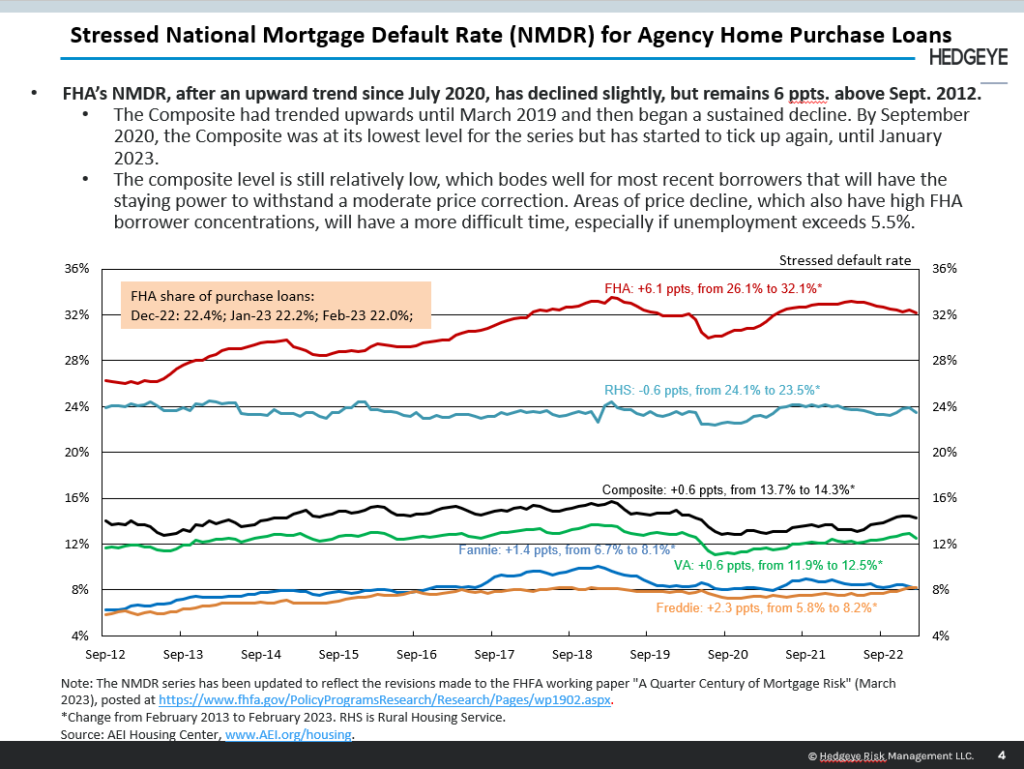
With this in mind … Hedgeye financial sector head Josh Steiner recently sat down with Senior Fellow and Director at AEI Housing center, Ed Pinto. The below slide shows that currently, mortgage defaults are not of primary concern. As Pinto notes on the slide:
The composite level is still relatively low, which bodes well for most recent borrowers that have the staying power to withstand a moderate price correction. Areas of price decline, which also have high FHA borrower concentrations, will have a more difficult time, especially if unemployment exceeds 5.5%.
Now, we don’t know if unemployment will reach north of 5.5%, at the same time, with 46% of those who recently bought in the last year already struggling to afford their mortgages … with auto loans and car prices at nose bleed levels … interest rates on credit cards at ALL-TIME-HIGHS … credit standards tightening in every metric of lending … the balance sheets of financial institutions on life support … commercial real estate imploding, and layoffs en masse on the way … in the words of boxing legend Mike Tyson:
“Everyone has a plan until they get punched in the mouth!”
Here’s the thing … NO ONE has planned for this elevated interest rate environment; let alone for any prolonged period of time; they’ve all budgeted off of monthly spend, which is spiking … while monthly incomes across the board are falling (be it household income negative for 26 straight months or corporate earnings collapsing).
Again, remember how addiction is defined: exhibiting a compulsive, chronic, physiological or psychological need for a habit-forming substance, behavior, or activity.
Both individuals and businesses are addicted to spending through the assumption of debt via the extension of credit and liquidity is their preferred drug of choice … but just like anyone addicted to something, there is an insatiable need for more in order to satisfy the high, be it alcohol, crack, or spending, there is never enough.
Bountiful liquidity is present in a substantially lower rate environment, or when central banks are providing such a tailwind … which they are no longer doing. As recently noted by Bank of America strategist, Michael Hartnett (who’s was right with his timing early on in the year) as reported by @ZeroHedge:
(Liquidity) “is set to collapse more than $1 trillion next 3-4 months” as follows:“$100bn QT from Fed/ECB/BoE/BoC/RBA/RBNZ per month + $1tn T-bill supply + $200-300bn rise in TGA + MMF outflows (from RRPs to T-Bills) = could approach a $1.5tn liquidity drain.“
Again, the addict needs MORE of their drug to achieve new highs, not less … and the same holds true in markets.
Mispriced risk … 2.0
The Federal Reserve’s role in the mispricing risk is too large to dissect in a single section of one of our monthlies, broadly speaking, QE (quantitative easing) and ZIRP … the Fed’s (zero interest rate policy) was pushed for such an extended period of time, it has mispricing risk for investors across all markets; for the longer rates were artificially suppressed, and the lower they went:
“everyone (every government, corporation, consumer, student, car buyer, etc.) with a pulse”
As we detailed in our 4Q2018 note … we would urge you to read it by clicking here.
QE and the obscene amounts of MBS purchased by the Fed drove mortgage rates to levels that created an environment in which the vast majority of mortgagees are “rate locked” given current mortgage rate levels (as described above). This is not up for debate, and it’s just one of many markets that’s been distorted and mispriced.
More importantly, in the section titled, Understanding the game, we were clear in explaining that corporations, most frequently, do NOT pay off their debt … they ROLL it; and Wall Street is glad to oblige … funding their insatiable addiction to spend, we stated:
Investment Banks will raise hundreds of millions to billions of dollars for a client via a bond offering. The client can use this money per the prospectus to run or grow their business. Prior to that bond maturing (or if interest rates are significantly lower), the investment bank will raise more capital to refund a maturing bond or replace the current bond at a new, lower yield (providing the company with a lower interest rate and, in turn, lower cost to carry).
ZIRP has afforded businesses to raise record amounts of debt … based on … their ability to afford it – due to this lower cost of carry)
In that piece we also asked, what happens:
“when investors demand more interest for the risk they are taking what do you think happens to companies who borrowed, overspent and over-levered in a raising rate environment?”
At the time the question was meant to be a rhetorical one, we believed most understood the answer to this question … but were quickly finding out that many actually don’t … at the same time the data is suggesting we’re all about to find the answer out together … in very short order.
This also bleeds into a very important topic we’ve written about in the past … we call it the mispricing of risk … April of 2020 we explained:
But what does mispriced RISK really look like?!
Argentina literally just defaultedfor the 9th time in history a few days ago – on a CENTURY BOND no less. A
century bond is as it sounds, it’s a bond that matures in 100-years (a century). This country had defaulted 5 times in the last 70 years, this most recent being it’s 6th since 1951. Who in their right mind thought it to be a good idea to buy a 100-year Argentinian bond due in 100 years when the country had defaulted 5 times since the 1950’s, most recently 2014?!
…The largest holder of a fairly recent Austrian century bond trading with negative yields was Vanguard Total International exchange traded fund… One of the largest bond funds out there owned by retail investors. Got Junk?!
MISPRICED RISK … 7.9% for 100 years is mispriced risk – negative yielding bonds maturing in 100 years is MISPRICED RISK … and most people have not a clue as the Federal Reserve is burying and hiding this risk, again…
The vast majority of borrowers around the globe have budgeted based upon monthly cash flows. Can I afford the monthly payment? Any interruption to that cash flow would have created this credit default cycle!
There are a few key things to understand here. The zero-interest rate policy of the Fed provided copious amounts of liquidity to flood a system dominated by algorithms and flows that buy things because they have to, not because they are priced properly (or not). (i.e., passive investments)
An example of this would be, in 2020 the Vanguard Total International exchange traded fund became the largest owner of an Austrian century bond with a negative yield … they HAD to buy the bond based upon their operating rules … which then forced any active manager who mimics an index to purchase it as well (closet indexers).
That’s how the mispricing of risk becomes pervasive throughout an entire system, everyone is forced to buy the same sh*t due to market structure, not because it’s a good or bad company – valuation doesn’t matter to an algorithm … and this problem has only gotten progressively worse since we originally wrote on the subject over 5 years ago.
The $5+ trillion in liquidity via “covid relief” perpetuated, prolonged, and exacerbated the problem … on every level, from the consumer, corporations, and governments, virtually everyone increased their indebtedness.
Passive funds bought, for it’s what their algorithm tells them to do, and now interest rates are roughly 52,000+% higher (0 to 5.25 … you do the math) … with nearly $1.5+ Trillion dollars of corporate debt NEEDING to be refinanced in the next 18 months, which is priced off of a “spread” to government rates … the majority of these companies won’t be able to handle this … and again, the high-yield market is mispricing this risk!
Per Mike Green of Simplify, the average coupon on this $1.5+ Trillion was issued at 4% – 5.5% (an artificially low number), most of this debt is currently trading in the secondary markets with an 8% to 8.5% yield to maturity. Remember, these bonds already exist, and are held by many passive funds who know nothing about fundamentals.
When money flows into the “passive” fund to buy, they buy … the passive investment could care less about the internal fundamentals of a specific company.
So, how do we know the risk in these bonds are being mispriced?! Because NEW PAPER of the same quality, is being priced between 12.5% to 13%. Which means that would be the NEW rate these companies, who NEED to refinance in the next 18 months, will be borrowing at assuming rates remain elevated.
Why is this so important?! Because nearly 85% of high-yield companies are currently operating profitably given their current cost of capital structure … BUT as these companies are FORCED TO REFINANCE in the face of their upcoming maturities, with new issue debt currently pricing around 12.5% – 13% … again, per Mike Green’s work, only 7% of these companies will be operating profitably, assuming the money will even be extended to them?!
We began discussing with our client, Toys R Us needing to refinance their debt in March of 2017, which they failed to do in September of 2017 … as we wrote then:
Toys R Us bonds had been trading around the 95 level until very recently when, bids fell off a cliff just days before the company filed for bankruptcy protection.
They filed for bankruptcy protection because they couldn’t refinance their debt … and again, at the time, the bonds were trading between $0.95 – $0.96 cents on the dollar and were trading below $0.22 on the dollar in under 36 hours. “Markets” didn’t see it coming because, again, they are dominated by passive investments which have to hold … until every other holder wants out and the bonds go no-bid.
How many Toys R Us(es) are in that pile of $1.5+ trillion that need to refinance?! How many companies currently trading around par value will collapse as liquidity is sucked from the system and these deals just can’t get done?! Credit markets have been trading by appointment for months, they’re virtually closed…
Companies are waiting until the very last minute to refinance their debt, because they’ve done this calculation … just like those with “rate locked” mortgagees … but there is a big difference between someone in a 30-year fixed mortgage vs. corporate debt that NEEDS to refinance in a rate environment where 93% of companies won’t be profitable.
The 30-year mortgage holder doesn’t need to sell their home, which will create its own issues in the housing markets, where as this corporate maturity wall is set in stone … again, these companies NEED to refinance.
If you were a company that NEEDED to refinance your debt, and knew you were about to go from a “profitable” capital structure to one that will most likely bankrupt you, you would be holding off, praying the Federal Reserve lowered rates, too … and yet, the Fed remains firm in their resolve to best inflation, with Jay Powell stating just this week that we should expect at least two more rate INCREASES this year.
As we noted in September of 2022:
“The fundamental problem here is that you have entire business models and capital structures that have been built up over the past decade that were just based off of zero percent or very low levels of interest rates and now with rates and spreads where they are, and continue to go, the math just doesn’t work.” Andrew Friedman @Hedgeyecomm “The call” 9/27/2022
In a single sentence, Andrew Friedman summed up what we’ve been writing about since we began writing in 2015. Our over-leveraged system can’t handle higher rates, especially not with rates at current levels … the bankruptcy cycle is just getting started as the clock is ticking on these maturing bonds.
Remember, Toys R Us was attempting to refinance roughly $400 million in debt, last I checked, $1.5 Trillion was quite a bit more?!
Final thoughts
The disconnect in data vs. price is at unprecedented levels … and still, price action doesn’t remove us from the economic cycle. An economic cycle can take multiple years to work itself out, in some cases it boils down to the reaction function of central banks.
The vast majority of the world is addicted to spending, much of which is accomplished via the accumulation and rolling of debt … which is all measurable, it’s what we’ve been mapping out for 18+ months now. Household balance sheets are deplorable, credit and debt has grown to all time highs, as real wages when adjusted for inflation have shrunk for the last 26 months now.
Lending has grinded to a virtual halt while at the same time, savings have been depleted pushing consumers to max out credit cards (with borrowings at all-time highs), coupled with average yields on credit cards also at all-time highs as are interest rates on car loans and corporate/government debt.
The amount of wasteful spending across the board is incalculable and when liquidity is plentiful, it matters, but much less then when liquidity is sucked from the system like a massive vacuum, which is happening as the TGA refill is draining liquidity from the system and global central banks are shrinking their balance sheets as they continue to turn the screws on borrowers.
This squeeze is hitting consumers and businesses alike, which is crushing personal and corporate balance sheets which is visible in all of the data we reviewed in this note … retail sales are abysmal, industrial production (recessionary), capex spending is in the tank, manufacturing is in recessionary globally, corrugated box sales are plummeting (which is visible via the continued deceleration in global shipping) and GDP is heading to 0 … (the list of decelerations/recessionary data is near endless).
This decelerating economic road leads to an acceleration in bankruptcies (which are spiking) and layoffs (which have troughed) which reduces the passive bids from the system as both 401k contributions and corporate buybacks dry up … just another example of more liquidity being drained from the system as the cycle marches on.
It’s no secret to our clients that we’re down on the year. I don’t like it, am not happy with it and take ownership. Though, we have always on the economic cycle; those who have been with us over the course of many cycles have a better understanding of this. Last year we were down a FRACTION relative to most all sectors and indices.
We felt a scratch, vs. massive flash wounds most felt with indices being down 24%, 28%, and 33% in the S&P 500, Russell 2000, and Nasdaq, respectively. Many software companies lost 60% to 80% of their value, while bond investors got crushed, too with bond proxies, $ZROZ, $TLT, and $IEF down 42.1%, 32.2%, and 16.2% respectively!
This is not an easy business, and over the course of my 27 years, one thing frequently remains a constant and unfortunately, it’s often black or white when working with new relationships … that being the concept of timing… regardless of how well we’ve managed assets over the course of cycles, the time when a client comes to us often forms a good or bad opinion based on shorter term performance.
Some new clients who came into our model’s mid-way through last year have not performed as well as those with us from the onset of this disinflationary cycle. Business cycles can take time to unfold – over that time frame, there may be some underperformance as markets skew from economic reality.
Again, there is a reason we stick with the data … for in the end, over the course of time (history) … it’s undefeated.
We won’t always be right in the short term … but, historically we have largely side-stepped the largest of recent market declines.
The process we’re following today is the very same process that protected us when the majority of Wall Street got absolutely smoked … we have no bias as to whether we’re fully long, partially short, or mostly in cash … the data and process dictates this … and based on the history and the data, the odds remain in our favor than most understand.
A longtime client recently asked, “why do most investors never see “it” coming”?! My response, right or wrong, is that most focus on shorter term price action vs. the data.
Given all of the data we presented in this note and look at daily, we find it troubling the majority of financial professionals are investing clients as aggressively as they are while claiming to be “fiduciaries”. “But we’re up year to date”, isn’t a risk management process, especially when they got crushed last year. What will they say when markets go limit down for consecutive days & weeks as is often what happens during credit events?!
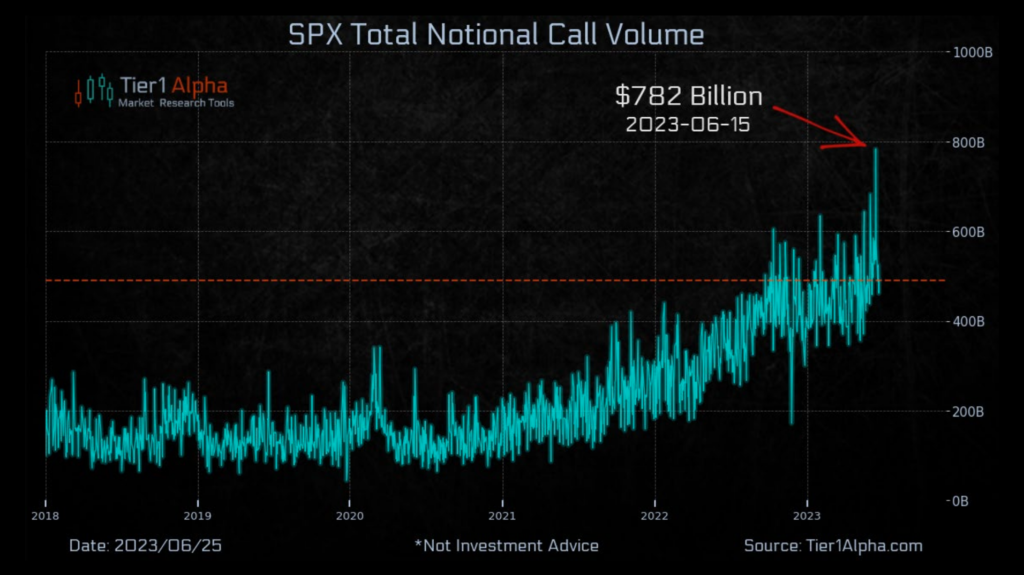
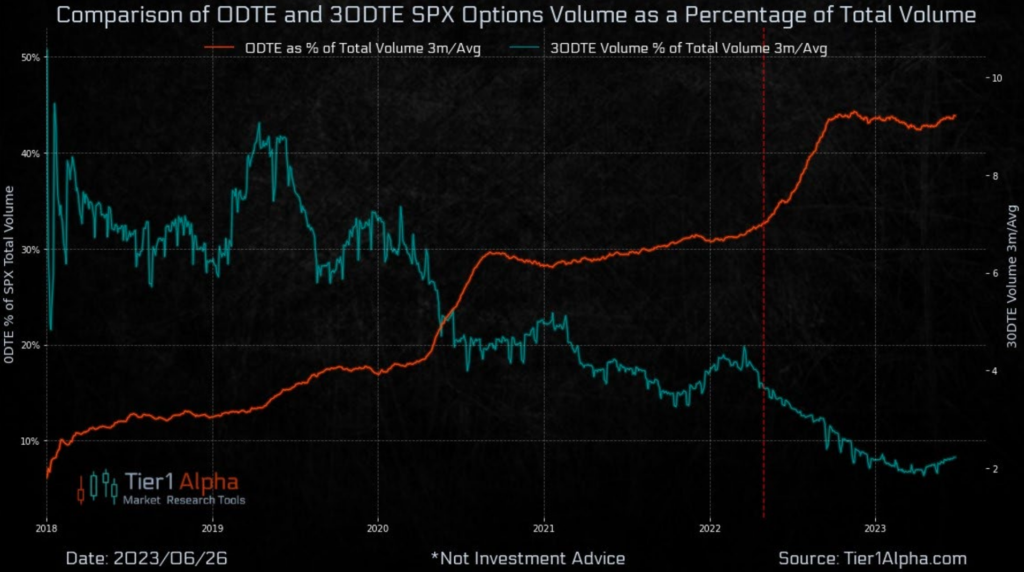
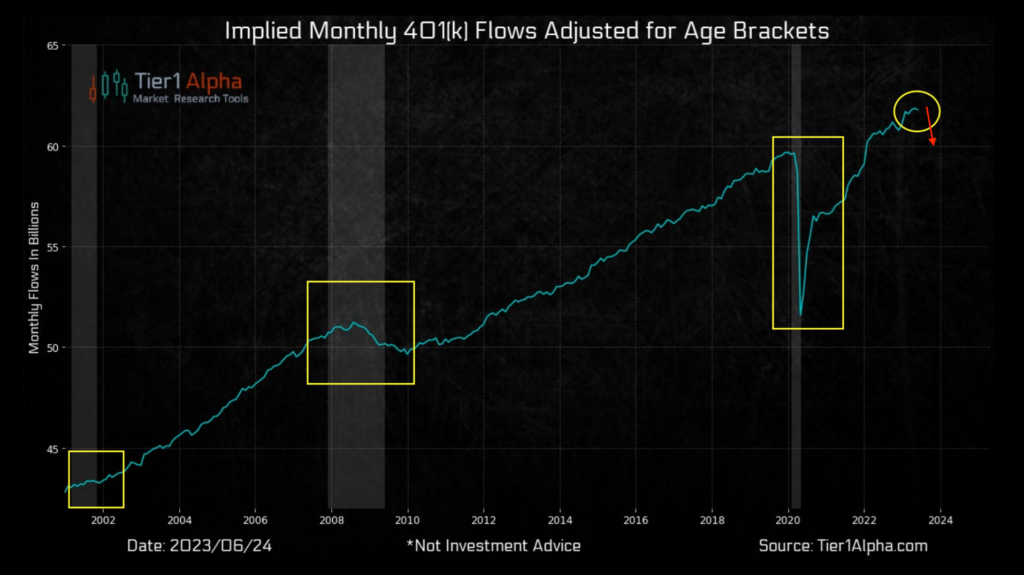
As we sign off, I’d like to present you a FLASH CLOSE! Some images of where our current odds lie regarding market directionality relative to extremes and history … courtesy of Mike Green and Tier1alpha: Euphoria in call options volume (primarily 0DTE) hit a massive all-time record highs last week.
0DTE options participation has spiked from sub 10% to greater than 46% over the past few years with a massive ramp since markets began to rally last October/November.
Markets don’t like when people lose their jobs (and stop contributing to their 401k’s) as noted both last month and above … and while they may not appear on the chart as dramatically as they occurred, 2001-2003 and 2008-2009 were crippling to most investors.
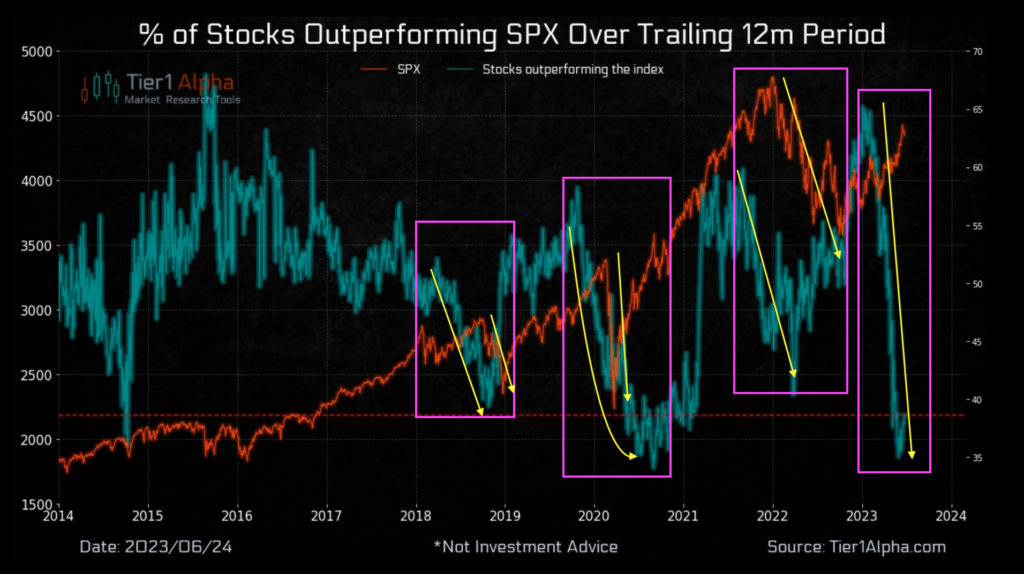
Moreover, equity markets really don’t like when rallies come at the hands of so few companies (as we detailed last month).
We noted the way addiction influences the brain and manifests in our opener … people crave their addiction; they lose control over them … they continue to do participate despite the consequences!
“More” isn’t always better … neither are extremes when it comes to markets … which is what you’ve just looked at.
Virtually everything we’ve laid out over the past year and a half is lining up exactly as we said it would, we question how any investment professional who considers themselves a fiduciary could chase markets led by 7 names while willfully ignoring the copious amounts of data and history?!
The addict wants MORE, then people wonder how (s)he could have possibly overdosed?! The gambler doesn’t want to miss out (and then wonder why they’ve just gotten crushed with many hedge fund managers crying on TV). It should surprise no one that we remain in the ODDS over outcomes camp for now.
Please exercise some patience, as we noted last month, we’ve seen this story play out multiple times throughout our career; over confidence in the belief that we have the “all clear” in markets due to the price action in a few names that are holding up two broader indices. This can and often does lead to significant pain when the above-described liquidity games can no longer be played, and economic gravity becomes reality.
We don’t know the exact day when, but given the data, history and liquidity set ups, it is our opinion that the addicts are about to have a very bad day … we suggest proper investors prepare accordingly!
Good Investing,

Mitchel C. Krause
Managing Principal & CCO

4141 Banks Stone Dr.
Raleigh, NC. 27603
phone: 919-249-9650
toll free: 844-300-7344
mitchel.krause@othersideam.com
Please click here for all disclosures.

