

In This Article


“Der Teufel steckt im Detail”
While nearly impossible to pinpoint with 100% accuracy its origin, historians suggest it was the controversial German philosopher and poet Friedrich Wilhelm Nietzsche (1844 – 1900) who uttered the above phrase in the late 1880’s … most likely a variation of French novelist, Gustave Flaubert’s (1821 – 1880), “Le bon Dieu est dans le detail” … or “the good God is in the detail”!
Conjecture or not, you’ve all heard this quote at some point in time over the course of your lives: “The devil is in the details”!
It’s a phrase from which so many other phrased are derived; think the ROOT that so many other branches grow from. Consider: the smallest of things often make the largest of differences … little things matter the most … at times, slower is faster … there are just so many variations of the phase which can be used in countless scenarios, yet at its core, they boil down to saying the same thing:
Slow down, take a breath and pay attention to all the components of a situation to ensure safety and success … net net: pay attention to ALL of the details!
How many have looked at their gas stove and considered that the difference between their beautiful blue flame or possibly burning your entire house down are … MICRO-PINHOLES?! That’s right, the micro-pinholes in the orifices your liquid propane (LP) or natural gas flows through.
You better hope your plumber or appliance installer understands the importance of detail in regard to conversion kits?! It’s the little things many never pay mind to, but significant importance most frequently exists!
Month in and out we make all efforts to pay attention to the details the majority overlook. Our time is spent sifting through, analyzing, and subsequently presenting our readers with as much of the data as we can; tying it to the business cycle in real time … from what drives the cycle (credit) to who spends it (the consumer) and how it flows through the economy.
At the same time, we also do our best to do it in a way as to where we’re showing you what’s under the hood of the car rather than just showing you a blemish free body and a shiny coat of paint. Plenty of cars can be dent free and shine but did you take the time to see if the check engine light is on possibly revealing a bad catalytic converter?! Did you drive the car?! Did the transmission fluid temp move through 205° reaching 220° suggesting you’re about to lose your transmission at any second?!
While that cherry vehicle may have some life left in it … details like these suggest it will most likely become an extremely costly endeavor in the VERY near future; this analogy holds true when investing, too (merely substitute “markets” for “that cherry vehicle”).
This is why we present the data in a way that not only shows you the rate of change directionality, but also how the numbers are derived … early warning indicators do exist and are extremely important!
While we normally walk you through as much of the economic cycle as we can in our monthly notes, today we’re going to try to narrow our focus, trying to get a bit more granular on some details we believe to be very important. We hope this note helps you contextualize some of the things that might not be making sense to you?!
Labor
On the surface, labor markets are tight. With the unemployment rate near historical lows (cough) most recently ticking down to 3.5% from May’s 3.6% … life is good in the eyes of the Fed! The labor force participation is hovering around 62.6% given July’s Non-Farm Payrolls coming in at +187K and the slight miss on expectations, which sat at the +200k level did, in fact, equate to an acceleration off of June’s +185K print (cough … cough)
And sure, both the household survey and private payrolls beat estimates as well … coming in at +286K and +172k respectively, with more good news in private payrolls, also accelerating against June’s +128K (yippee).
If that’s not enough to prove to you just how fantastically wonderful the labor market is at the moment (cough … cough … cough), the ADP Employment report for July just trounced consensus estimates of +183K, coming in at +324K, albeit slowing from June’s +497K; ironically, both June and July were the highest readings in the last 12 months … even average hourly earnings were better than expected, up +4.4% YoY (insert eyeroll here).
Have you ever heard the saying, “There are three kinds of lies: Lies, Damned Lies, and Statistics”?! Many credit Mark Twain with this quote, though even he’s given credited former British Prime Minister Benjamin Disraeli (who also may have not been the first). At the end of the day, as we noted in our introduction, even this quote can be broken down simply into, “the devil is in the details.”
We’ve been writing about the distortions in labor markets for well over 18 months now, screaming (as you can see below) “Labor is the latest of late cycle indicators”; that by the time the Fed (or most anyone else for that matter) acknowledges we’re in a “recession”, the reality is that we’ve, most likely, already been in one for some time?! In our 4Q2022 note we warned:
“The majority of the aforementioned layoffs are in a much more highly compensated income bucket, most of which will be receiving severance packages, something we were VERY SPECIFIC with in our 3Q2022 note section “Odds and Ends” … “The fact of the matter is that higher income earners simply consume and spend more money!”
“Two quick important notes on labor: 1. As we continue to say, it’s the latest of late cycle indicators, patience, it’s coming (unfortunately) … when management gets fired, they often receive severance “packages”, which means no unemployment is filed until the “package” is exhausted (in most cases) …
Point number 2. being extremely important as it’s more than likely suppressing labor data.”
So, what becomes a common theme in this note … nearly a year ago we not only nailed where the job losses were coming from, but where they continue to trend today (and why it’s so important). Additionally, all else we wrote above remain true as well. This has been supported by the internals of the labor data for months which have been suggesting that the data was being suppressed, which was echoed by the very well-respected industry veteran, Mike Green of Simplify Asset Management, who’s now written extensively on the subject … from our May note:
From last week’s YIGAF in reference to the oft-cited Atlanta Fed Wage Tracker:
“Does anyone else see a problem in the data series that ignores the top 15% of workers in a recession that appears to be LED by the top 15% of workers losing their jobs and facing diminished earnings prospects?”
This, of course supporting our points from 3Q’22 and 4Q’22 in regard to the higher wage earners losing their jobs at a faster pace as pertinent data continues to be suppressed on the headline level (clearly shown below).
There is a reason why we not only focus on the data, but the details within … it’s why we’ve remained consistent in citing the weakness and deterioration in data despite headline numbers “beating expectations” … again, bringing us back to Mike Green!
For some time, Mike has been extremely critical of the BLS’s use of its Birth/Death modeling (for good reason). From Mike’s May 7th “Yes, I give a FIG!”:
My critiques of the Birth/Death model for payrolls is well known, but suffice it to say that we know it does a terrible job at economic turning points due to its use of a trailing trend (ARIMA) approach. This maximizes estimates of jobs created by net firm births at precisely the point the economy is entering a recession. Post-pandemic estimates of the proportion of jobs coming from new businesses being created are the highest in history. Fodder for future downward revisions.”
What is the Birth/Death model one might ask?! Statistics!!!
Per the BLS: “(The) Birth-death adjustment is an adjustment made to survey-based estimates to account for the net effect of businesses opening and going out of business … “They are model-based estimates. They are based on the history of business births and deaths as observed in the Quarterly Census of Employment and Wages (QCEW).”
Also, per the BLS: “Birth/Death forecasts are NOT seasonally adjusted … they are calculated using population data that is not seasonally adjusted, and the forecasts are applied to the sample-based not seasonally adjusted estimates. Months with generally strong seasonal increases such as April, May, and June generally have a relatively large positive forecast.”
In these two quotes directly from the BLS, we learn the Birth/Death model is a gu-“estimate”, basically allowing them to adjust or “play with” the raw data. Stated slightly differently … “lie with statistics”.
Again, please note the BLS freely admits these numbers are NOT seasonally adjusted, so months “with generally strong seasonal increases” like the ones we’ve recently just experienced, may be able to come in “hotter” than expected without too much scrutiny, which … as Mike notes in his above referenced quote from May, is “Fodder (food or fuel) for future downward revisions.”
With that in mind, not only have Non-Farm Payrolls for both May and June been revised LOWER by roughly 25K jobs respectively; per the most recent BLS report:
“The change in total nonfarm payroll employment for May was revised down by 25,000, from +306,000 to +281,000, and the change for June was revised down by 24,000, from +209,000 to +185,000. With these revisions, employment in May and June combined is 49,000 lower than previously reported.”
But EVERY SINGLE PAYROLL REPORT IN 2023 HAS SEEN A DOWNWARD REVISION?! Chart courtesy of @ZeroHedge
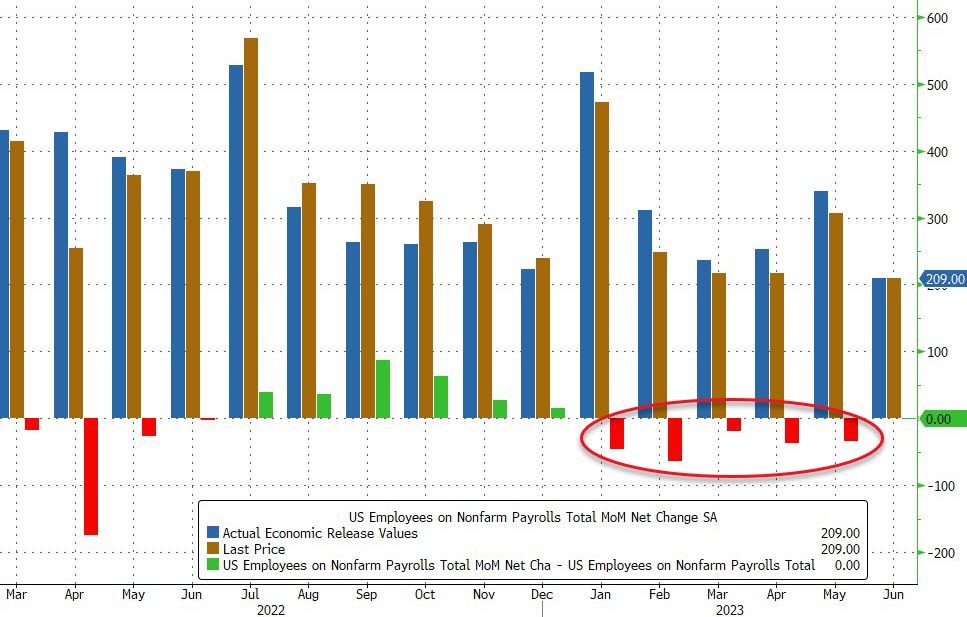
So, when one starts to get a bit more granular, sifting through the data via a different lens, and not just focus on the headline number, a MUCH different story begins to unfold.
These downward revisions are taking place at the same time the Birth/Death adjustment for July juiced numbers significantly higher by +280k new jobs; this being the second largest Birth/Death adjustment to be reported in 2023 (remember, that whole, fairly important: non-seasonally adjusted numbers with generally strong seasonal increases) … like the months they’re currently reporting?!
Consider, all these new jobs the BLS arbitrarily claims are being created … coming at the hands of recently “birthed” businesses, as both personal and corporate bankruptcies are accelerating at their fastest pace in nearly 13 years (2010); a time when businesses were still in recovery from the GFC (Great Financial Crisis), as we detailed last month (and again, update/discuss below).
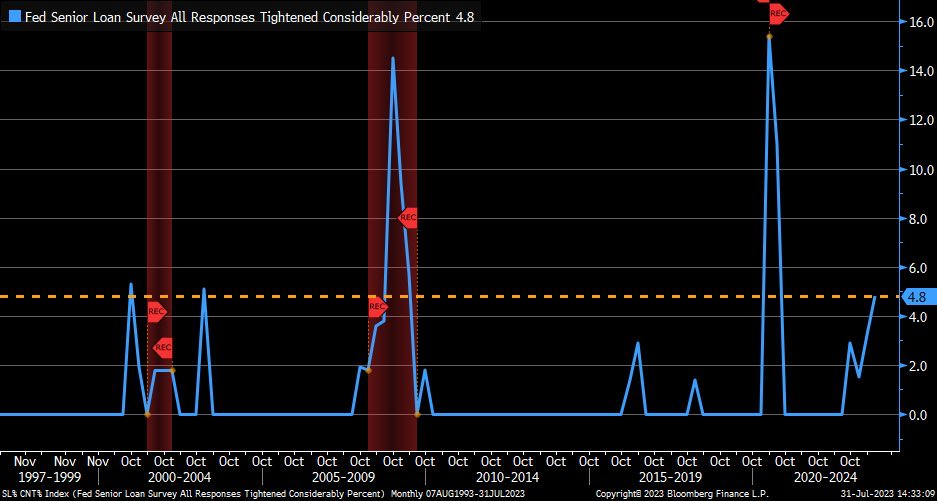
Moreover, we’ve been highlighting both the SLOOS (Sr. Loan officer opinion survey) and the Fed H-8 data for over a year, which is clearly signaling one of the fastest tightening cycles in bank lending, i.e., credit extension, EVER … with any lending/borrowing that is taking place being done so with the cost of capital at levels not seen in decades … of course it makes perfect sense (insert eye roll / palm to forehead emojis here).
Something Charles Schwab Chief Investment Officer @LizAnnSonders just recently echoed, too stating:
“Noteworthy in last week’s update to Fed’s Senior Loan Officer Opinion Survey (SLOOS: % of respondents that have tightened considerably jumped to 4.8%, which is just slightly below peak % right before 2001 recession.”
Furthermore, an even deeper dive into the labor data suggests a more disturbing trend.
Remember that “Household survey” we noted above which came in at +286K?! Well, per the Household Data report: Table A-9; Selected employment indicators [Numbers in thousands] this headline number might just be slightly misleading and it’s definitely where the details matter for the underlying data is truly more unsettling than headlines suggest.

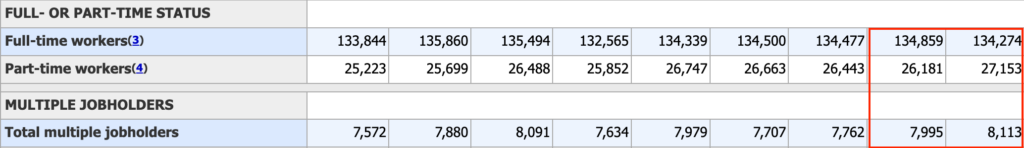
For those unfamiliar, what you’re looking at is a staggering decrease of -585k FULL-TIME JOBS (LOST) vs. an increase in part-time jobs “gained” of +972k, with an additional INCREASE of +118k multiple-job holders MoM (Month over Month), respectively … from June to July 2023 … which should make everyone reading this data extremely uncomfortable; please consider:
- Who do you think makes more money?! Full-time or part-time employees?! Thus:
- Who do you think spends/consumes more?! (We answered that above) Then:
- Who do you think contributes more to their 401ks fueling the passive bid?!
- Why would the number of multiple job holders be accelerating so quickly?!
This entire note could be questions raising concerns about the internals of this data, though when considering the ‘positive’ headline data vs. the underlying trending data (which is stark), it might just lead those who peak under the hood of the vehicle to wonder … what’s going on?! Is it intentional?! Malicious?!
As noted in our opener, it’s the granularity of the data that leads us to early warning signals and the importance of such data as it relates to labor markets cannot be overstated.
Whether it’s a phrase we’ve borrowed … such as, “first things happen slowly, then all at once” ala Keith McCollough, or analogies we’ve used to describe warning signs just prior to specific moments in time where stress points matter … such as the cracks we’re seeing in labor markets being akin to the loud sounds made just prior to an avalanche outright burying you … these signals do exist.
Again, think small/granular having a massive impact on things; we cited David Rosenberg in April noting:
Companies reduce “hours worked” before they lay people off; and based upon the “Index of aggregate hours worked”, total labor input into the economy has been -0.1 two months in a row and while that might not sound like much, when considering 150MM workforce army … payrolls, when adjusted for hours worked, have been negative -140k.
Negative -140k is massive … now, can you guess what happened in July vs. June in relation to the average work week?! Did you guess it?! Hours DECLINED … AGAIN … by another -0.1 hours! And as Rosey said in April, it might not sound like much, but as the RoC (Rate of Change in data) continues to deteriorate on a trending basis … and when this compounds month over month, it’s bad … really bad!
Trending deceleration in hours worked, overtime hours worked, temp staffing needs … coupled with a RoC (Rate of Change) climb in continuing claims that has never ended without a recession … all things we cited in May:
The YoY change in continuing claims has NEVER been this high without a subsequent recession and “warn notices” are pointing to an acceleration in initial claims” Hedgeye CEO Keith McCollough, 2Q2023 Macro Themes Update
And followed up with:
“… JOLTS job openings for March just registered its lowest level since April 2021, decelerating to 9.59mm, (-18.4% YoY vs. 11.755mm April 2022), with both “overtime” and “temp” staffing collapsing!These are not numbers to be ignored.”
The wheels are literally coming off that used car with the shiny coat of paint, and rapidly!
Who’s your mechanic?
Look, we get it … you shouldn’t have to be a forensic accountant to understand what’s really going on, at the same time, those in a position of power/control will do just about anything they can in an effort to prevent a collapse on their watch … the future of our country/society be damned!
Rapidly deteriorating GDP, no problem, just insert copious amounts of government spending to juice a number keeping us out of a “technical recession” (discussed below). Labor deterioration, no big deal, just tweak the Birth Death guestimate and revise them later, no-one is paying attention (except the handful of us who are paying acute attention).
There is a very good reason we stress the importance of internals … why? Because data doesn’t lie on its own, it’s those who manipulate the data who do … and they should be called out for their lying/manipulating at worst or ignorant misleading at best.
Bringing us back to the used car analogy we’ve been using throughout this note. It’s extremely important to have that well seasoned mechanic on your side; someone who really knows what they’re looking at; willing to look under the hood and get that car up on a lift in an effort to make sure you’re buying that “as advertised” pristine vehicle or a well dressed, shiny piece of **it?!
So, if we’re not your mechanic of choice when it comes to the LABOR markets, how about the #1 rated “hiring site” in the United States with the LEADING “job search” app on both iOS & Android?! Do you think they might have some fairly good insight as to what’s going on underneath the hood of labor markets given, their intimate relationship with them?!
$ZIP (ZipRecruiter) recently release earnings earlier this month … and while their numbers were BAD, we believe them to be far less important than their insight into current (and forward looking) labor market conditions. Q2’23 revenue was DOWN an eyewatering -29% year-over-year … which is terrible, but their forward outlook on the industry, per their Shareholder Letter was dire:
“We had 102k Quarterly Paid Employers in Q2’23, a decrease of 35% year-over-year. The decrease in Quarterly Paid Employers is primarily reflective of weakness among small-and-medium-sized businesses who make up the vast majority of our Paid Employers.
Employer Demand Continues to Soften
Our prior guidance was informed by the atypical softness in job postings in April and our view that those trends would continue through the end of the year. We have seen this softening continue in Q2 and in July. Demand
among both SMB and enterprise employers continues to contract as thy reduce the number of jobs they post and the amount they spend for job advertising.
These trends inform our guidance. We acknowledge that the macroeconomic uncertainty remains and that macroeconomic changes (including interest rates), both positive and negative, will impact our 2023 revenue. However, we remain committed to managing operating expenses and ensuring that our investments are prudently allocated to build our long-term strategic advantage.”
If anyone was wondering?! When revenue shrinks due to “weakness among small-and-medium-sized businesses who make up the vast majority of our Paid Employers,” and management says, “we remain committed to managing operating expenses” it means a. the core of their operations are deteriorating and b. JOB CUTS are coming to $ZIP, but this, while terrible is less the point to the much more important c:
In a nutshell, what the company is saying is that … THE ECONOMY AND LABOR MARKETS HAVE COME TO A SCREETCHING HALT AT A FASTER PACE THAN EXPECTED!
This real-world data out of ZipRecruiter aligns much more closely with the loss of -585k full-time positions last month than the masterfully crafted guestimate out of the BLS with the help of their arbitrary Birth/Death models (and continued negative monthly revisions).
Again … the “weakness” is” among small-and-medium-sized businesses who make up the vast majority of our Paid Employers.”
As we remined readers in May … “33.2 million small businesses represent 99.9% of all businesses in the U.S. – (they) contribute ~ 45 to 50% of GDP … these businesses employ 500 or fewer employees.”
This trending weakness is a continuation of what we’ve been saying for well over a year now … the labor market data is always late, but the early warning signs are embedded within the data … you just have to look for them!
The proverbial “heartbeat of America” is currently on its knees while a bunch a bureaucrats lie with statistics as “better than expected” headlines prompt algorithmic traders to bid equities higher, only to be chased by CTA’s, momentum players, and options dealers given the rise in 0DTE options, which then forces other players to chase (hedge funds, etc.) … only to have the data quietly revised lower months later with few paying attention … almost as if someone is attempting to game the system (until it can no longer be gamed)!
Following the data requires more work than blindly buying an index that’s “marketed” as “up” on a year-to-date basis, while hiding the facts of how badly those very indices are down on a cycle to date basis (i.e. when the collapse started) … not to mention how most are also radio silent on the train wreck that continues to be the bond market which comprise 30 to 50% of the typical 60/40 Equity/Bond portfolio.
You can only lie with statistics for so long, and we remain firm in the camp that, in the end, it’s the data that historically wins.
This cycle is unfolding exactly as we’ve been laying out since September of 2021, when we warned readers of the disinflationary market to come 2Q22 (which is why we pivoted January of 2022), trading it has been a challenge, but when the credit event happens, we contend, the current set-up has all the marking for a massive deleveraging of sorts, one which can freeze a structurally unstable system … and those unprepared won’t know what hit them, in our humble opinion! (Backed by data, already frozen asset classes (private REITS, BREIT/SREIT) and structural flaws in markets we’ve written about for over 5 years (“Fallen Angels” in passive bond instruments))
Connecting the dots
Famed investor Mario Gabelli of GAMCO (Gabelli Asset Management Company) is known for frequently saying, “you’ve got to connect the dots” … which is exactly what we attempt to do in these monthly notes. We provide readers with thorough, yet verifiable empirical data; then systematically “connect the dots” as to how this information is manifesting in real time.
We’ve presented you with the tables above (links included) showing the labor market is not as advertised … the loss of over -585k full-time jobs last month replaced by +972k part time jobs with 118k people picking up multiple part time jobs in order to make ends meet is verifiable … the BLS suggesting +280k jobs were created at the hands of a Birth/Death model is arbitrary … it’s a guess … it can NOT be.
We know full-time positions are in the higher paying “white collar” space and the loss of these positions are largely being ignored by certain data sets … as noted above per MG, “Does anyone else see a problem in the data series that ignores the top 15% of workers in a recession that appears to be LED by the top 15% of workers losing their jobs and facing diminished earnings prospects?”
While at the same time, these are the individuals who typically spend/consume more!! We also know that while consumption is slowing (per trending retail sales) CASH purchases/expenditures are dwindling with credit cards (or revolving credit) having now eclipsed $1 trillion dollars … increasing by north of 16% YoY which is in the top 3 fastest growth rates … EVER!!! While the AVERAGE interest rate on credit cards just eclipsed 24.37% (per LendingTree).
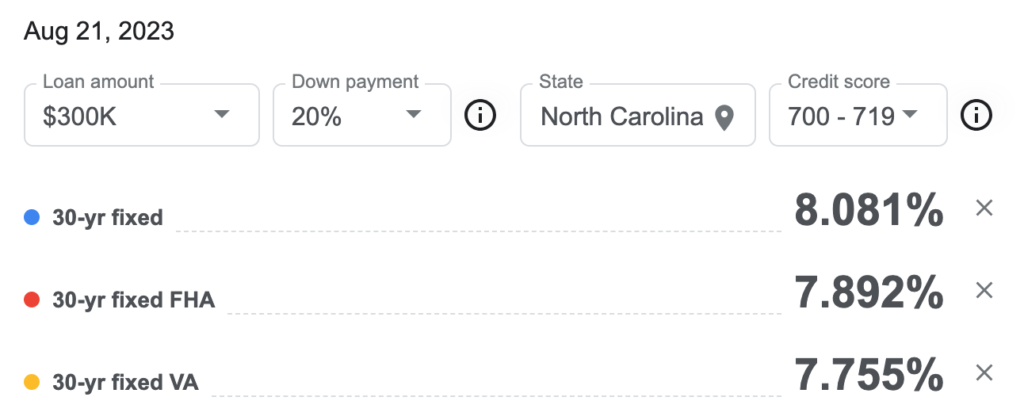
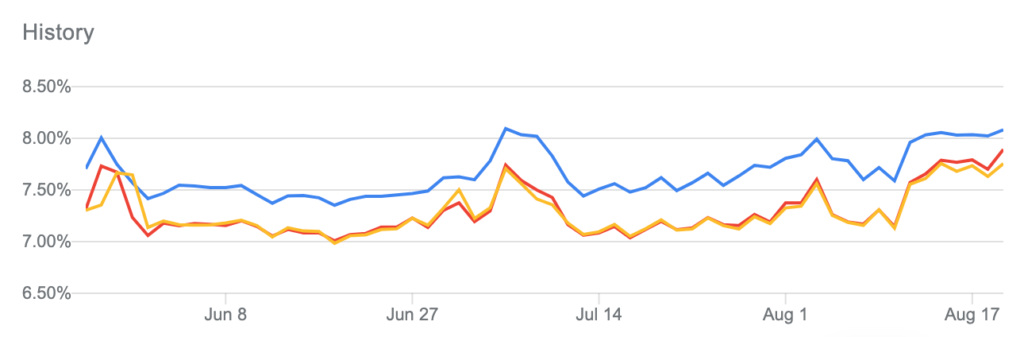
As we began noting last April when mortgage rates had just begun to rise, the elevated cost of capital would begin to choke businesses and consumers alike … which is happening and conditions just continue to get worse. With the Fed purporting the average 30-year mortgage to be 7.09%, reality suggests them to be full of **it, too.
If you thought the 23 year high of 7.38% for a 30-year fixed rate mortgage a few weeks ago was bad … today, the average 30-years mortgage for those with a credit score between 700 – 719 has eclipsed 8.00%. Roughly 60% (62.8%) of Americans have the privilege of borrowing around 8% while nearly 40% (37.2%) will be tethered to even higher rates.
At current levels, on average, homeowners are spending in excess of 40% of their GROSS income on their mortgage with the median mortgage payment reaching a record level of $2,700 (excluding taxes/fees) … while the median rent has moved through $2k per month … and there is NO relief in sight!
Housing has gotten so unaffordable, Zillow recently announced 1% down mortgages. A $418,000 home (median home price nationally) with 1% down at 8% interest including taxes, fees and PMI, given a credit score between 700 – 719 equates to a $3,934 payment ($47,208 per/year), while the median household income was $70,784 as of April … that’s 67% of gross income (assuming a single income household)?!
While we’re on expenses, per Experian, the average payment on a new car is $725 per month! Shall we talk state/local taxes, food, gas, insurance, internet, cell phone, heating/cooling, too?! Ahh, details … details!
You shouldn’t need the aforementioned FHFA data to tell you we’re in a worse position than 2006/2007 which led us directly into the GFC. Affordability is so bad, other mortgage companies are now offering 40-year mortgages. Near zero down, no doc, 40-year mortgages … I know many have extremely short memories with patience levels slightly greater than NONE, but for those who don’t recall … we’ve seen this movie before … the GFC was bad … EXTREMELY BAD!
The elevated cost of capital is omnipresent in all aspects of finance today … it’s not just credit cards, mortgages or rent … corporate debt levels coupled with local, state, federal/sovereign borrowing rates are nearing nosebleed levels as tax receipts plummet.
In our June note we detailed the number of companies which face a high probability of bankruptcy if forced to refinance at current levels between now and 4Q2024 … in a section titled “Mispriced risk 2.0” we wrote:
“Companies are waiting until the very last minute to refinance their debt, because they’ve done this calculation … just like those with “rate locked” mortgagees … but there is a big difference between someone in a 30-year fixed mortgage vs. corporate debt that NEEDS to refinance in a rate environment where 93% of companies won’t be profitable.”
The rate of change in the cost of capital relative to how much money has been borrowed vs. the incremental revenue gain is simply unsustainable.
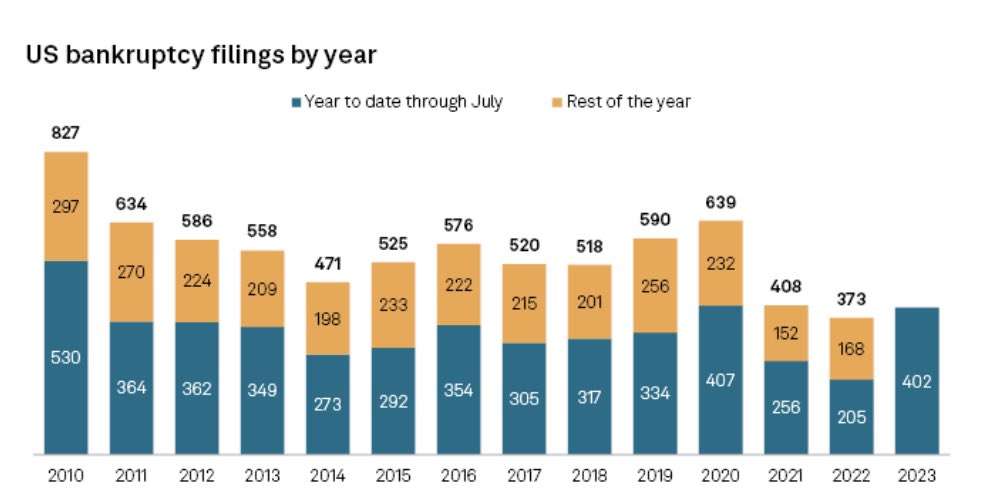
Speaking of bankruptcies, we mentioned corporate bankruptcies above as well as last month, though it’s worth elaborating on, for again the RoC (Rate of Change) in data continues to get worse at an expedited pace. As reported by @KobeissiLetter we’ve witnessed more bankruptcies through the first 7 months of 2023 than we saw in all of 2022 (205), placing us 6 away from 2021, but more to the point.
We’re currently on pace to eclipse 687, which would make it the highest level since 2010 with consumer bankruptcies & foreclosures up in excess of 17% YoY!
We shouldn’t need to remind anyone that an expedited pace of bankruptcies will directly correlate to an acceleration in layoffs and, in turn, a rapid spike in unemployment … cue: Avalanche analogy from November 2022:
“The best analogy that comes to mind regarding what we’re currently witnessing in labor markets is the sound one hears when ice and snow begins to crack just before they’re about to get crushed by an avalanche … at first things happen slowly, then once in motion, the speed at which snow, and ice falls increasingly accelerates destroying just about anyone or thing that gets in its way!
There is no stepping in front of an avalanche! The cycle is much like gravity, it just is … and there is little to nothing that anyone can do in an effort to stop it; and at this point the carnage will be ugly.”
For as we also noted back then … (the) Fed won’t alter their path as they will view this as “expected”. Which just about sums up exactly what Fed Chair Powell just said during his Jackson Hole speech last week; citing, “the risk of doing too little” (as we’ve written/warned all too many times over the past year).
By the time those who never saw inflation coming to begin with (and were wrong), and then suggested it was transitory (and were wrong), and then (were wrong), and then (were wrong again) … by the time they realize what stage of the cycle we’re in, they won’t be able to hide their panic, nor will the BLS be able to mask the carnage in labor markets via their Birth/Death guestimates.
A quick side note on the Birth/Death adjustments. Let’s assume for the moment there is nothing nefarious going on (I place this probability as EXTREMELY LOW to ZERO) but, for a moment, let’s just assume.
As a direct result of the American Rescue Plan Act of 2021, the IRS created a new rule which states anyone who now receives over $600 of income for services needs to register (birth) as a “new business”.
Prior to this Act, (for reporting purposes to the IRS) third-party transactions for business owners and those attempting to earn a little extra income on the side followed different thresholds: individuals only needed to report gross payments exceeding $20,000 and report earnings if they had more than 200 such transactions (according to the IRS).
Now, regardless of number of transactions, the reportable figure is $600. Which does beg the question?! How many uber drivers, Esty sellers, VRBO owners, etc… have had to “birth” as an “entity” due to this new law?!
Those in control will always attempt to give themselves ‘cover’ in an effort to hide their indiscretions, though as we noted above, “the data doesn’t lie on its own, it’s those who manipulate the data who do” … and the facts remain … a newly ‘birthed’ job for an individual making between $600 and $20,000 isn’t a substitute for a full-time position being lost, nor is it new income being spent into the economy, it’s now just being “reported” and in some cases “taxed” providing less velocity to drive the economy; bringing us back to our above quote from our 4Q2022 note:
“The fact of the matter is that higher income earners simply consume and spend more money.”
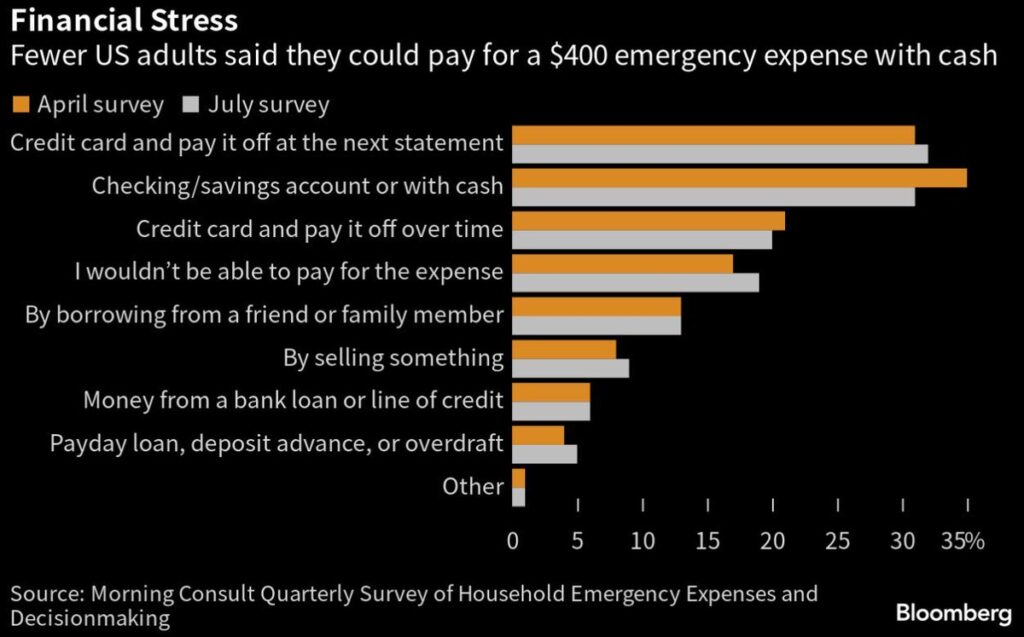
This as fewer adults in the U.S. can afford to pay for a $400 emergency with cash. We referenced this via the Prudential pulse survey in February, though just as we’ve said they would, things are deteriorating at a faster pace.
Per Morning consult as recently noted by @LizAnnSonders “46% of respondents said they could cover surprise expense (down from 48% in prior quarter); >1/3 said they’d need to use some sort of debt” … this debt, of course, now with a cost of carry EXPONENTIALLY HIGHER, squeezing disposable cash even further.
This seems like a good spot to remind readers that $400 is the average student loan repayment for tens of millions of individuals, which is set to resume in October.
The Biden administration’s newest student loan forgiveness plan recently released on 8/23/23 will again, likely head to SCOTUS and fail given its lack of Constitutionality (for countless reasons, the primary being that a loan is a contractual obligation, as is the Constitution … ahh, those pesky details).
While we’re discussing pesky details, here’s one more re: the consumer … per PR Newswire:
“Sixty-nine percent of consumers in urban areas live paycheck to paycheck, which is 25% more than their suburban counterparts, 55% of whom live paycheck to paycheck. Additionally, 63% of rural consumers reported living paycheck to paycheck.”
The ‘consumer is strong’ narrative holds zero water given the numerous data points we’ve already shared. As the increased cost of capital further squeezes the majority of Americans, spending will continue to contract, corporate earnings will further collapse and in turn, labor markets will deteriorate, and banks will further tighten lending standards … rinse repeat!
As we’ve been reminding people for YEARS, [Credit], is “the primary fuel, which makes our economy function”! We wrote those words 2Q of 2017, followed by:
“The Credit/Debt dynamic is without question, THE PRIMARY driving force behind our economy; without credit, the vast majority of American consumers wouldn’t be able to spend a fraction of what they do … This dynamic is the lighter fluid on the U.S economy’s campfire.”
This credit tightening has been confirmed week after week by the Fed’s H8 data, and quarterly by the SLOOS survey; financial institutions are constricting the extension of credit like a massive Anaconda wrapped around the consumers neck, sucking the life out of them … and without credit the consumer can’t survive, nor can an economy be healthy.
We are literally witnessing our reflexive loop/Ouroboros eating it’s own tail/cannibalizing itself example, as we wrote in our 1Q2023 piece, unfold right before your eyes.
“…without the consumer spending the economy is destined to shrink; when you remove their access to cheap capital and lifelines to credit … their confidence erodes (they without question spend less)!
When Americans lose their jobs, most will change their spending habits immediately (obviously spending less). Individuals watching friends and colleagues getting fired has a similar affect, as many often become fearful of suffering the same fate, thus, putting further pressure on corporate margins.
As the corporate earnings recession gets deeper, these businesses will cut more costs which ultimately equates to firing more employees … talk about the ouroboros eating its own tail, it’s all just one big reflexive loop!
Making matters worse, we haven’t even touched on the re-acceleration in inflation data (w/CPI up +0.2% to 3.2% vs. 3.0% MoM, which is transpiring exactly as we said it would last month (see: OIL, ENERGY, & COMMODITIES).
So, buckle up, things are about to get a whole lot worse!
Back to reality
We’d argue it’s difficult for anyone who focuses on the data to not reach our current conclusion. Last month in the section titled, REALITY we showed you in real time as to how the weak consumer is flowing through to credit issuers:
“the tightening of credit is extremely visible in the Fed’s H8 data, with its flowthrough into the broader economy crystal clear in the earnings releases of both $DFS (Discover Financial) and $COF (Capital One). $DFS saw continued margin pressure, loan growth contraction, increased credit costs and expenses. Their reported $3.54 EPS was down 10% YoY, below consensus estimates of $3.67.
They experienced lower than expected NII (Net Interest Income) and a HIGHER THAN ANTICIPATED LOAN LOSS PROVISION (SEE: liquidity crisis unraveling rapidly into a credit crisis).
And the only “bright spot” in their data was, in fact a negative as it was DRIVEN BY LATE FEES!”
Side note: after publishing last month $DFS CEO departed the company abruptly (never a good signal).
This month we’ll quickly point to Macy’s following their earnings release, per their investor call transcript:
“While we had expected credit-card delinquencies to rise as part of our “normalizing” credit environment, the SPEED at which the increase occurred … for us and across the broader credit card industry … was faster than planned.”
Let’s quickly address a few things:
First: “faster than planned” … why are these deteriorations always faster than what management teams and all of Wall Street “plans” for, but not for those of us who follow the data?! Answer: financial incentives (and it will never change so long as the incentive structure and C-level accountability remains untethered).
There’s not a single reader who can suggest that we, with the likes of Hedgeye and a very select and limited group of others haven’t been screaming that the rate of change in data will continue to decelerate at a faster pace ending in an eventual “credit event” for multiple quarters now. We will continue to caution investors who allow price action dictate where we are in the economic cycle to be very careful, though, I digress…
Bringing it back to Macy’s … Second, if you’re wondering why a retailer like $M (Macy’s) is worried about credit card delinquencies, it’s because a significant portion of their revenue comes in the form of fee income from their Macy’s credit card (yep, a retailer more tied to the credit cycle than you think).
Some may recall it was $GE (General Electric) buying sub-prime credit card receivables from the likes of Target that buried both themselves and the short-term corporate credit market formally known as BAN (Bond Anticipation Notes – SOLD as money market alternatives) back in 2008/2009.
Sadly, this is just one more example of the ‘reality’ we pointed to last month; the consumer is on life support with no catalyst to pull them off. The underlying data is screaming the consumer is in dying on the vine as more Americans lose full-time positions (which drive consumption) … these are all extremely negative data points, and if that wasn’t enough … not only do the unemployed no longer contribute to their 401ks, but we now know that a staggering number of individuals are making EMERGENCY WITHDRAWLS from their 401ks … as noted by @CNN, per Bank of America:
“The number of people who made a hardship withdrawal during the second quarter surged from the first three months of the year to 15,950, an increase of 36% from the second quarter of 2022, according to Bank of America’s analysis of clients’ employee benefits programs, which are comprised of more than 4 million plan participants.”
As we remind readers often, the level is less important than the rate of change in data; nearly 16k can become 300k-500k+ in a heartbeat as job losses accelerate, non-performing assets spike, banks, in turn, further constrict lending, forcing the consumer to look elsewhere for funds now having less to spend … rinse, repeat … it’s literally the definition of reflexive loop!
A 36% YoY acceleration is a BIG DEAL; it not only echoes the data in regard to the state of the consumer, but it’s also incrementally eating into that passive bid we frequently discuss.
The irony … as banks continue to pull back on extending credit, their use of emergency funds from the Fed’s BTFD balloons to record highs. Current interest rate levels are decimating Held to Maturity portfolios, at the same time client funds are moving out of deposit accounts and into money market funds offering higher yields. I’m old enough to remember March and the regional bank crisis (that hasn’t been fixed) … the Fed’s emergency funding program are short term LOANS … loans need to be repaid.
It should come as no surprise that ratings agencies have recently downgraded several financial companies, the only surprise is that it’s a mere fraction of how many it should be (likely out of fear not wanting to create a run on all banks).
Consumers are scraping any and every bit of accessibility to capital they have in an effort to keep their heads above water … revolving credit lines like credit cards, HELOCs, BNPL, and now 401ks … as you read this, picture the scene in the movie, “The Titanic” as Jack is struggling to keep his head above water … while the rest of his body turns into an ice cube, eventually freezing to death.
It didn’t matter that his head was above water, it didn’t matter that he had access to oxygen; so long as his body was in the water, the only thing the oxygen did was prolong his suffering by a few hours.
In order to have a chance at survival, his body needed to be out of the water on top of the life raft … right now, we’re past the point of a simple fix, every entity needs lower interest rates and/or cash which is being sucked from the system at a more rapid pace by the day.
For years, everyone and everything got addicted to cheap capital; we’ve literally been warning readers of this dynamic since we began writing notes in 2015, though more aggressively when our muzzle was removed in opening our own firm.
We wrote “The Fed: 650… 535(+400)…250(+?)…” coupled with “Understanding the game” in 2018 which is a remedial step by step anyone can understand; the only difference between then and now is that things are MUCH worse today based upon inflation rates and even more leverage in the system.
The financial system cannot handle the speed in which rates have accelerated given the volumes of debt set to reprice at current levels … it will bankrupt countless businesses which continues to feed this vicious reflexive loop … again, April 2022:
“As margins compress – profits fall – layoffs are around the corner” … the unemployed spend less – corporate profits continue to fall – margins further compress – more employees are let go!”
Final thoughts
We’ll finish this piece as we began … the devil is in the details.
- The yield curve remains inverted with the 10 year and 2 year sitting at 4.20% & 4.95% respectively,
- New home sales have begun to weaken again with mortgage rates through 8% while existing home sales remain anemic (rate locked at MUCH lower levels as we described HERE)
- Business activity remains a train wreck.
Again, words like anemic or train wreck only have meaning when empirical fact adds context … Earlier in the week, as a proxy for housing:
- Mortgage purchase index fell from 149.5 to 142 WoW … a 28-year low … while:
- MBA Mortgage purchase applications had multiple sequential WoW declines … as:
- Existing Home Sales fell 2.2% MoM to a SAAR of 4.07MM units … and:
- The NAHB Housing Market Index for August saw another sequential deceleration to 50, from 56 in July!
(= ANEMIC)
While PMI’s, which provide a glimpse into the Global economy, scream “train wreck”! The data as recently noted by Hedgeye Director of Research Daryl Jones @HedgeyeDJ:
- “Manufacturing PMI slowed to 47.0, from 49.0 -> 2-month low
- Services PMI slowed to 51.0, from 52.3 -> 6-month low
- Composite PMI slowed to 50.4, from 52.0 -> 6-month low”
AND:
- The Empire State Manufacturing survey for August fell to -19.0, vs. +1.1 in July.
(= TRAIN WRECK)
There is no current policy in place which fixes this; that’s the thing about the Ouroboros, it will devour itself without a major intervention which becomes exponentially difficult given the re-acceleration of inflation (much of which is a byproduct of current policy).
To date, the current administration has spent north of $5.3 trillion dollars in an effort to keep the country out of a “technical recession” as we eluded too above. This, as they look to issue another $1.85 trillion between now and years end.
Deficit spending at current interest rates will continue to further weaken our country … interest expense on US Federal debt is nearly ~20% of US government revenue (well in excess of 2011 levels) as interest rates continue to rise while tax receipts plummet … in the words of David Hume, whom some credit with being THE greatest intellect of his age (as we wrote at length about in May of 2020):
“… when a state has mortgaged all of its future revenues, the state by necessity lapses into tranquility, languor, and impotence.” David Hume, Of Public Credit, 1752
To this point Lacy Hunt of Hoisington Investment management, followed with, “… and today, we know that it triggers diminishing returns and an insufficiency of saving to generate physical investment.” OSAM May 2020
In the end, those who are most “shocked” when things come crashing down are those who most often overlook the details. They lack patience and most often believe that price action dictates where we are in the economic cycle … markets ebb and flow within cycles, but it doesn’t mean the cycle is over and all is clear when the structure and mechanics of markets temporarily rally them.
These details, we’ve been highlighting without question matter, and we continue to urge those who disregard them to heed the warnings. The old market adage, “escalator up, elevator down” exists for a reason … for history shows that years of gains can be wiped away in days to weeks when structural deficiencies give way leading to massive, forced deleveraging … it’s literally brought grown billionaire’s to tears on live TV.
Do yourselves a favor, don’t take short cuts … engulf yourselves in the details or work with someone who does … “Wir sind der Meinung dass Sie uns am Ende danken werden!” (It’s our opinion that you’ll thank us in the end!)
Good Investing,

Mitchel C. Krause
Managing Principal & CCO

4141 Banks Stone Dr.
Raleigh, NC. 27603
phone: 919-249-9650
toll free: 844-300-7344
mitchel.krause@othersideam.com
Please click here for all disclosures.

