In This Article

A proactive approach
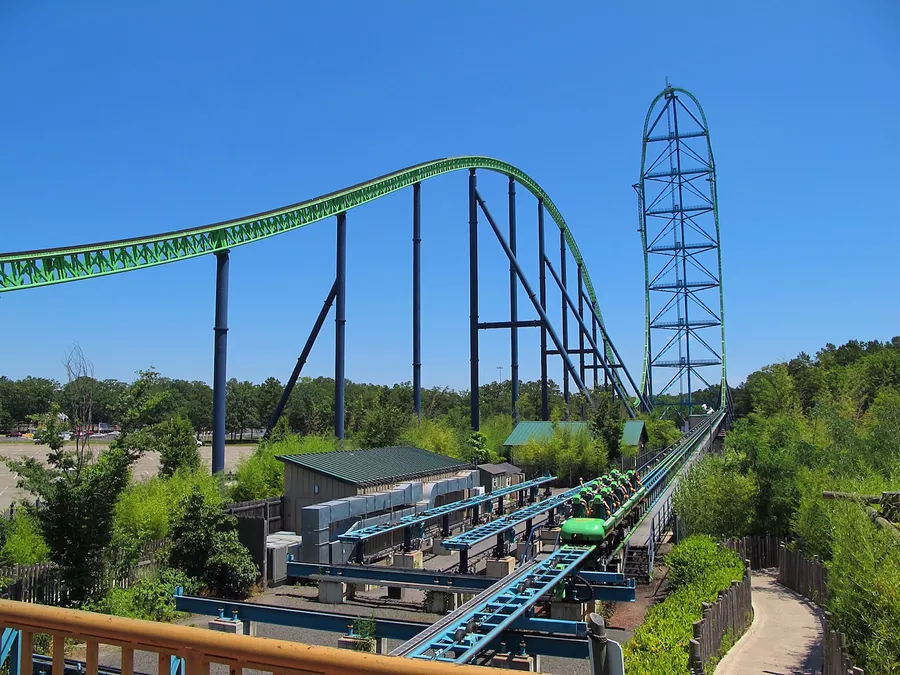
Tick, tick, tick, tick … It’s an indistinguishable sound … tick, tick, tick, tick … chains melodically ratcheting … tick, tick, tick, tick … pressure builds as you sink into the back of your seat … tick, tick, tick, tick … butterflies fill your stomach as you move higher and higher and higher … tick, tick, tick, tick … at this point, your views are measured in miles … tick, tick, tick, tick … you know it’s coming as you anxiously await that final “click” which denotes that point in time when enough of the coaster breaches the crest of the peak and the chain lift firmly places you into the hands of … gravity.
Weightlessness is what you feel in most instances as you’re literally staring straight down at the earth, a myriad of feelings follows, both emotionally and mentally: pressure, pain, uneasiness, joy, exhilaration.
In 2005, nestled in the back woods of Jackson, NJ, Six Flag Great Adventure unleashed a newer technology (at the time), replacing the iconic ticks and clicks with the faint sounds of pressure and hydraulics; leaving riders unsure of when they would be sling-shotted to record breaking speeds of 128 mph in 3.5 seconds, launched into a 90° ascent, cresting at a 456-foot peak, only to descend in a vertical drop straight back down to earth.
When it opened, “Kingda Ka” was the tallest, fastest roller coaster in the world … 17 years later, it’s still the tallest, though currently sits second fastest to “Formula Rossa” at Ferrari world in Abu Dhabi, which boasts a top speed of 149 mph.
The analog to investing is clear. Whether it be the emotional rides and drops through peaks and valleys (cyclical economic trends within longer term secular cycles) or innovations in engineering like hydraulic launchers (derivatives, SPACs, passive investing), the parallels are vast, and the adrenaline surges are equally impactful. Both rides and journeys are personal in nature to us all and each of us prefers different types of experiences. While some seek the thrill of the tallest and fastest (options, levered ETFs, margin debt), others are more comfortable with a less violent ride (unlevered accounts, bonds, low beta shares).
Still, there will always be those who stare envious of the extreme thrill seekers of both venues, believing in their heart of hearts that they, too, have the capacity to stomach the brunt of enormous pressure unleashed on the human body and mind as they encounter the extremes only to conclude … THEY DON’T!! They tremble in fear through the jolting roller coaster or lose sleep during violent drops and extreme twists of the equity markets.
If you’ve ridden a roller coaster before, in most circumstances, YOU KNOW WHATS COMING AND WHEN and still, you’re often unprepared for the ride, though once you’ve locked yourself into that seat, there’s very little you can do but sit back, unable to get off “until the ride comes to a full and complete stop”.
The parallels diverge
The traditional wall street “investment strategist” is also locked into the ride as are most 401(k) accounts; set up to take a specific amount of cash each month, investing in limited options, in a predetermined manner, regardless of market behaviour or economic phase changes. However, our approach is proactive.
When we see danger looming on the investing “ride”, we can proactively prepare. Some may recall the many back-to-back days of 1Q2020, when market circuit breakers halted trading numerous times preventing terrified sellers from getting off of the proverbial ride. Remember, it was those who proactively prepared who didn’t have a need to get off because they had the foresight to position themselves into the least volatile asset classes best appropriate to weather the drawdown. (More on this later.)
This is NOT an easy profession; indeed, it can be extremely humbling. As discussed earlier, different sectors, asset classes, factor exposures, companies, and currencies all have cycles within cycles, and I will NOT get them all correct. I’m pretty sure the last guy who claimed to get all of the cycles right all of the time died in prison for running the largest Ponzi scheme in history to the tune of $64.8 billion dollars; his name was Bernie Madoff.
Most (not all, but most) claiming to have crushed it this year, never saw the carnage of 1Q2020 coming (as we did); most don’t see what lies before them now (as we do).
The models we run always have a degree of volatility. Allowing winners to run and cutting losers before they become problematic requires holding companies through ups and downs but cutting those names that breach a level of volatility on the downside. This is paramount to capital preservation. Capital preservation is what we do.
When many micro cycles within the larger overall macro cycles begin to peak and roll over, it may affect our positions before broader indices, however, it’s also a signal to us that something much larger is close. An example of a micro cycle peaking and rolling has been the decimation of small cap companies …
In late December, with the Russell 3000 down a meager 3.5%
~76% of the index was down -10% or more below their 52-week highs
~63 % of the index was down -15% or more below their 52-week highs
~52% of the index was down -20% or more below their 52-week highs
~43% of the index was down -25% or more below their 52-week highs
~27% of the index was down -40% or more below their 52-week highs
~20% of the index was down ~50% or more below their 52-week highs
Today, the Russell 3000 is down more than 8.5% (YTD) nearly 4 times the -3.5% when this data was relevant (2021 was only 3+ weeks ago). What do you think these numbers look like today?! I’ll help you out, It’s NOT BETTER, it’s WORSE … MUCH WORSE!
When market breadth dries up leaving the fate of broader indices in the hands of a few select companies it’s very often a sign of things to come (SEE: 1Q2020)
A “sign” however, isn’t data … and being data dependent has kept us scouring both data and markets for additional “signals”. What’s been apparent? Mega cap technology joining small caps as they, too, have rolled over into bearish trends.
This alone, wouldn’t ordinarily signal an immediate end for the current bull market … typically, it would suggest a phase transition from the reflationary environment we were in to a deflationary one, as we discussed last month at length. A “narrow” deflationary regime often brings positive returns, however, as we told you then, inflation has peaked, despite what Fed officials and Wall Street continue to harp on. Moreover, 2Q2022 YoY comps (comparable data) for most companies are virtually UN-compable; as in, they can’t be beaten.
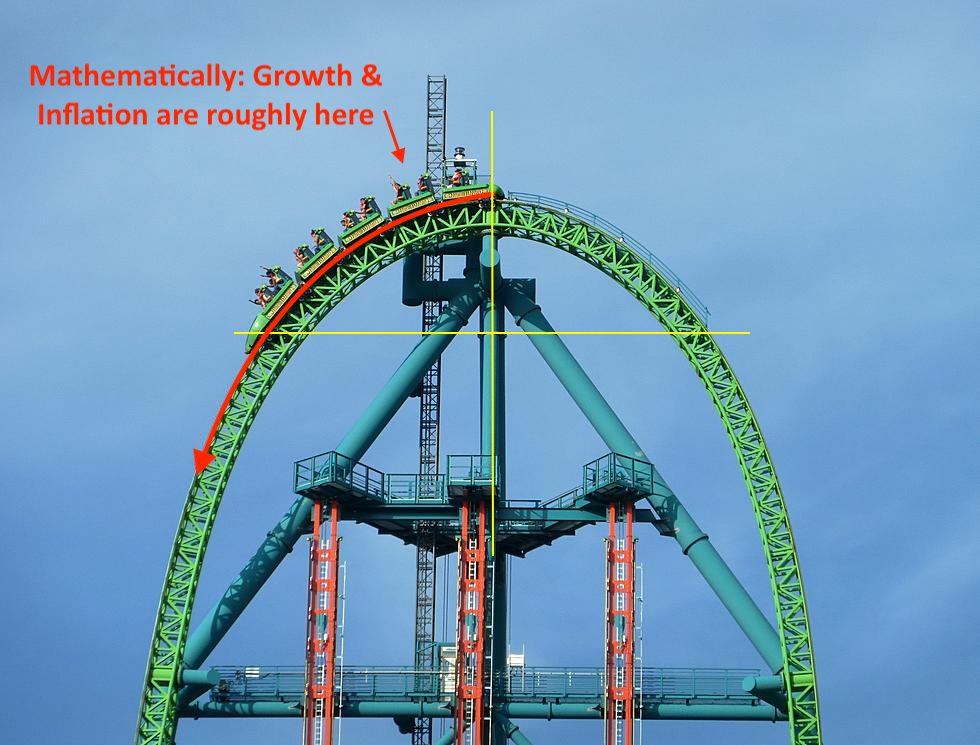
With growth having been the question mark as to which investing regime Q1 would fall, we were specific in noting that regardless of where it fell, goldilocks, narrow deflation or not, time and space would erode very quickly as we steam roll directly towards a virtually inevitable and VERY DEEP deflationary 2nd quarter. We say “inevitable” as it’s one of the highest conditional probabilities we have ever seen from a mathematical perspective.
Let’s make this easy … Inflation & Growth are HERE…
A Quick Review – Inflation Rate of Change
With inflation having peaked, the first quarter of 2022 has always been a coin toss between Goldilocks (which is generally good for share prices) and Deflation (which, if both growth and inflation decelerate minimally, is also generally positive). However, a large decrease in both growth and inflation (as measured by GDP & CPI, respectively); large being defined as greater than 100 bps, is historically VERY BAD for equity markets and share prices. We prepared you for this last month:
In a two-factor (growth and inflation) model, there are two economic environments where inflation decelerates: the first being “Goldilocks” (Hedgeye Quad 1), the second “Deflation” (Hedgeye Quad 4); in understanding that inflation is decelerating (as we explained above), the directionality of growth becomes the determining factor on which Quad we are entering.
Though, peaking is a process, it’s not a single data point, again, as we explained last month:
“for determining the directionality of Growth (GDP) it’s 30 economic data points per month, 90 over the quarter.”
As the trajectory of those data points change, we change. The beauty of the process is whether we’re talking growth and/or inflation, the data points are the same, they’re just measured and mapped directionally.
For example, LAST APRIL 2021, we told you inflation was going higher … we didn’t just spew b*llshit to “make a call” or sound crazy, we were very specific in telling you that inflation was accelerating:
“currently the data does NOT suggest this inflationary cycle is over just yet. Rather, it is accelerating — allow us to explain…” ~ OSAM April 2021
Then did exactly that, we EXPLAINED in great detail why inflation was just getting started … we highlighted shelter and energy, we discussed soft commodities and food … and we were right as every PhD Federal Reserve official, media outlet and large Wall Street firm told you there was no inflation.
But that was then and “today” is now … but again, we’re not screaming “inflation has already peaked” for our health or giggles, nor to look stupid as everyone under the sun is just now jumping on the inflation train, we’re merely following the same data points … only today, they’re decelerating … we’re citing empirical facts, not narratives!
For example, SHELTER (33% of the CPI) has peaked and is beginning to rollover, ENERGY (Oil, Natural gas, Propane, etc.) have all been making lower highs (in the dead of winter), and soft commodities are all dis-inflating … ALL ITEMS WE HIGHLIGHTED LAST MONTH!
Yes, the price of bread, milk, beef, (insert product here) are all “high”, we get it, but the price of fertilizer, wheat, corn, feed, etc. all need to fall FIRST, before price decreases begin to flow through to the end user, i.e., the consumer.
While the most recent focus of Wall Street, Fed officials, media outlets and everyone else who wants to parrot the consensus narrative has been that the January CPI print was 7%, the more pertinent question should be whether the next CPI print accelerates to a level higher than 7% or decelerates to a level lower than 7%.
The harsh reality of the math is that the 7% print, the highest since 1982, makes it quite likely that we’ll see lower CPI figures over the next few months, meaning a decelerating CPI. This negative rate of change is what matters, which is exactly what the DATA is showing.
For example:
- January 13: Producer Price Index decelerated -0.1% from 9.8% to 9.7%; (remember PPI LEADS CPI)
- January 14: US December Retail Sales were reported, -1.9% decelerating off Novembers revised up 0.2% (from up 0.3%); -2.3% Ex-Autos and -2.5% Ex-Autos & Ex-Gas;
- Used Cars as measured by “Manheim Market Report (MMR) saw a 1.3% price decline over the first two weeks of January;
- Manufacturing PMIs fell -2.7 points to +55.0 to its lowest level in 15 months;
- Services PMI fell -6.7 points to 50.9 to its lowest level in 18 months;
- January 18: The NY Fed’s Empire Manufacturing survey was just released came in at -0.7 with CONSENSUS EXPECTATIONS AT +35.1 (no, NOT A TYPO)
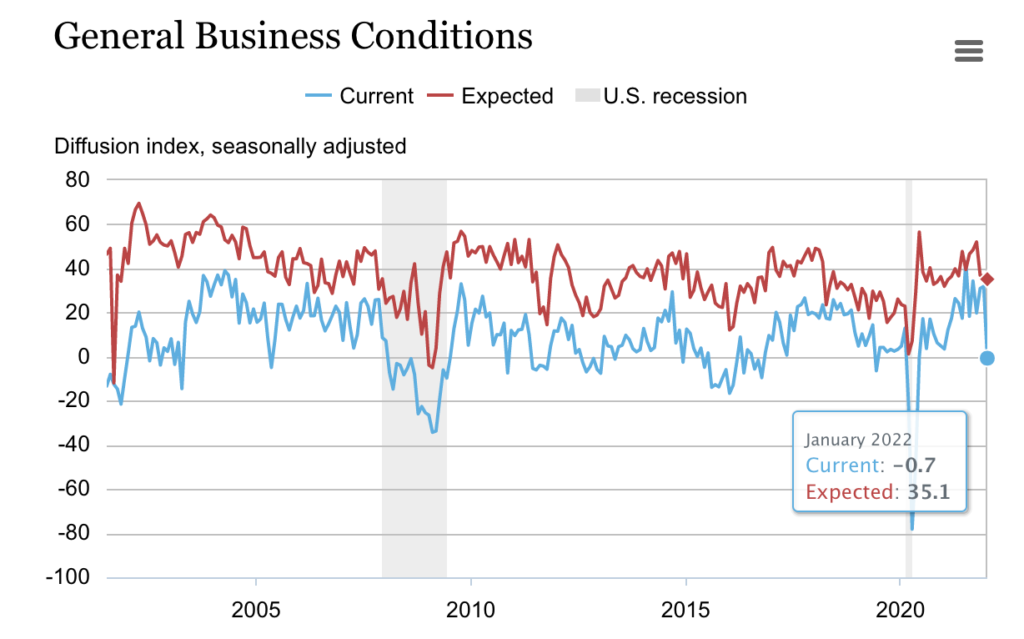
We cannot stress the importance of this enough and it’s the point we attempted to drive home above and in previous notes:
“it is NOT the absolute levels of inflation or growth that markets care about most, it’s the directionality and RoC (Rate of Change) of them.” ~ OSAM Dec 2021
A Quick Review – Growth Rate of Change
We’ve been specific for months in detailing the second quarter of 2022 as being a crucial period, reiterating the below quote last month, originally writing it in SEPTEMBER:
As is the case with inflation, we’ve known that the growth cycle is also nearing the end of its rope. As we wrote in September:
“While there is quite a bit of time between now and Q2 of next year, it’s almost mathematically impossible to see an acceleration off this year’s base effects. The imminent deceleration, coupled with a hawkish FOMC and a toxic political environment will likely collide with a deflationary economic regime at a most inopportune time!”
So, let’s talk about the imminent deceleration (in growth). Last month we walked you through how GDP (GROWTH) is calculated:
“GDP = personal Consumption expenditures + gross private Investment + Government purchases + (exports – imports).”
We were also very explicit in telling you that 2Q2022 would have a “MUCH larger shortfall in YoY government spending” with the Biden administration’s inability to secure the BBB plan. The importance of this lies in government spending being a very large input to the above equation, and while we’ve been laying the groundwork over the past few months, we were unsure of just how large that shortfall would be?!
Hat tip to Hedgeye Financial analyst Josh Steiner (@HedgeyeFIG), for he recently guided us directly to the Congressional Budget Office’s website providing us a much better picture.
As you can see below, pulled directly from table 1 boxed in red, one can see total YoY spending shortfall of $1.3 TRILLION DOLLAR in 2022, the brunt of which landing squarely in Q2 of this year. These days, we so easily lose perspective on how much is in a trillion dollars. This figure of $1.3 trillion is equal to a reduction in the US GDP of about $4,000 per man, woman, and child in the United States. Figure that out for your family, and then ask yourself what the impact will be of that reduction in GDP (a hugely negative rate of change).
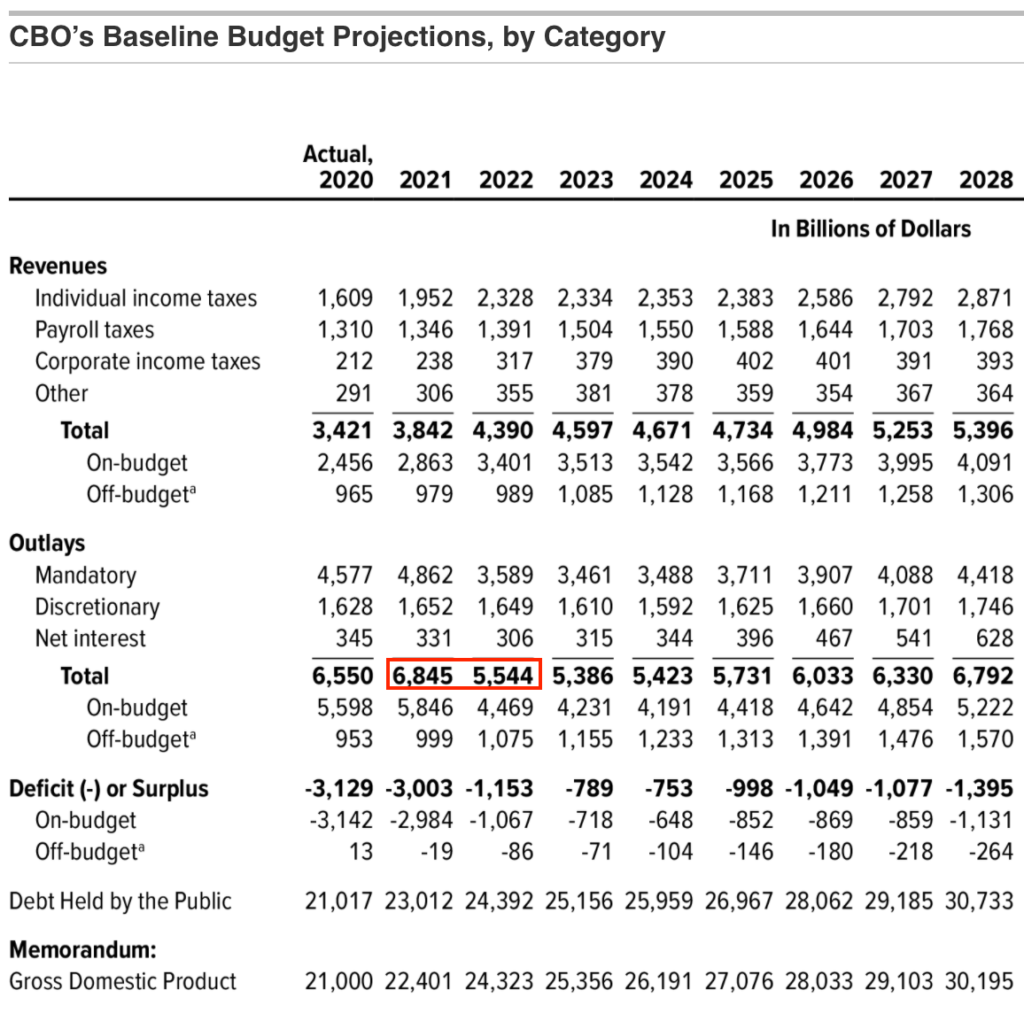
This GAP in government spending alone is what creates a virtually mathematical certainty of a deflationary 2Q2022, irrespective of other inputs; Remember PPP? $1,400 checks? Additional $600 checks? $500 monthly child tax credit?? Yeah, they’re all gone, they don’t exist anymore!
What does this mean for future GDP growth?! Per Hedgeye CEO Keith McCollough’s math:
“4Q2021 GDP will settle in at +5.51% year-over-year GDP (which imputes +7% headline). 1Q2022 GDP will most likely be slowing to +5.17%”; with 2Q2022 GDP slowing from +5.17 in Q1 to 4.04%, “which imputes +2% headline GDP”
This decline, from a 7% headline to a 2% headline in only 2 quarters is massive, epic, extremely impactful. This moves us deeply into a deflationary Quad 4 environment which is, with extensive back-testing, proven to have a very bad effect on financial assets.
And the FOMC is Hawkish?!
Despite the above real time rate-of-change data, Federal Reserve officials are calling for 3 to 4 rate hikes. This view is supported by:
- Morgan Stanley: 4 rate hikes
- Goldman Sachs: 4 rate hikes or MORE
- JPMorgan’s Jamie Dimon: “So, my view is a pretty good chance there’ll be more than 4,” Dimon went on to say. “It could be 6 or 7.”
With President Biden recently elevating “inflation” to a top priority, the FOMC will be hard pressed to turn tail and reverse course in his face. Raising the probability that they will be raising interest rates “colliding with a deflationary economic regime” as both growth and inflation decelerate at a more rapid pace … WHICH IS EXACTLY THE WRONG TIME WHEN THE ECONOMY CAN’T HANDLE IT. This scenario, of increased interest rates during a decreasing level of inflation and a decreasing level of GDP growth, is extremely hazardous for share prices.
These “experts” are consistently wrong, and yet rather than accept accountability, they make excuses in suggesting their blunders are acceptable, because, well … other economists were as well. In a recent interview, when asked how the Fed got inflation so wrong, Fed Chair Powell stated:
“We and other forecasters, we believed based on our analysis and discussions with people in industry that the supply side issues would be alleviated more quickly than now appears to be the case … Substantially more quickly.”
What, no data?! Treasury Secretary Yellen is no better stating last week:
“Inflation rose faster than most economists, including myself, predicted”
How many times can the same people miss the largest pitfalls laying right in front of their faces before they are no longer employed or considered “experts”?! You truly can’t make this sh*t up anymore …
Topping is in process…
As we move through the next few months, data points, such as the price of oil will mask the overall deterioration and deceleration in both growth and inflation; this is what Fed officials will cite they are fighting as they increase rates. We will have rallies, violent ones, but in aggregate markets know what lies ahead for the second quarter and they’ve already begun to discount these facts.
The largest bubble in history is popping, as noted above, it began with small caps (Russell), followed by large cap technology (Nasdaq), and now the S&P has just lost price momentum. Over the past two weeks:
- S&P 500 is down 8%;
- Nasdaq is down 10%;
- Russell 2000 is down 11%
With volatility now trending, the U.S economy staring at back-to-back deflationary environments in Q1 & Q2, we highly suggest you reconsider any “buy the dip” mentality to “sell and reposition into rips”. If you have not yet positioned yourself for a deflationary market outcome, we would urge you to use future strength as opportunities to do just that; raise cash and re-allocate. Deflationary relief rallies can be some of the strongest in markets history, however, the trend is still down, use them to your advantage.
How Are We Positioning?
The closer we get to 2Q2022, the faster the ride will get … which is why we’ve been proactively preparing. We’ve cut losers, have moved to interest rate sensitive sectors like Utilities (XLU), Staples (XLP), REITS (XLRE), Housing (ITB), Gold (GLD) among other things. We’ve trimmed holdings in individual names for while we have an idea as to where the grenades will lie; ala $DOCU, $NFLX, etc., no one knows for sure?!
We’ve also been building our positions in bond proxies for, unless we have another liquidity event where everything goes down, rates should plummet. Finally, late last week, while these vehicles are not ideal, we dipped our toes in the water of some inverse ETFs, this is how we’ll capture some selective and strategic short exposure; we are positioned well to both protect and take advantage of this environment.
At one point in time during Monday’s trading session (1/25/2022), all gains from 2Q2021 had evaporated in the DJIA; all gains from 3Q2021 forward were gone in the SPY; all gains from 2Q2021 disappeared from the Nasdaq; and ALL GAINS from 2021 disappeared in the Russell … Charts and observations provided by Brent Johnson of Santiago Capital @SantiagoAuFund on Twitter:
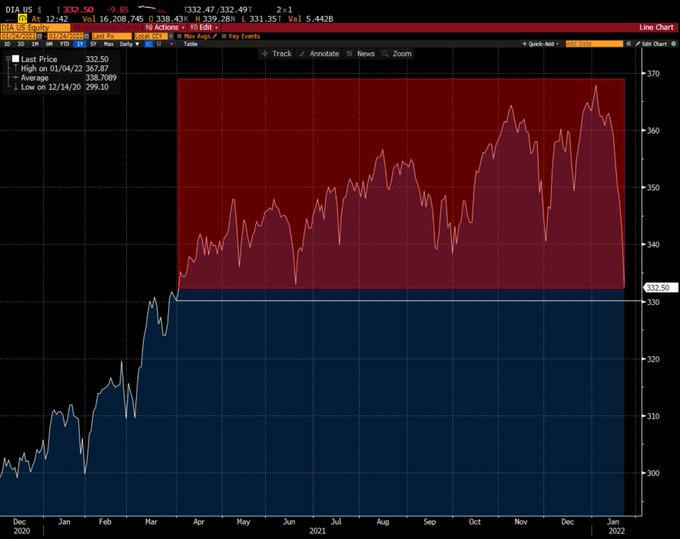
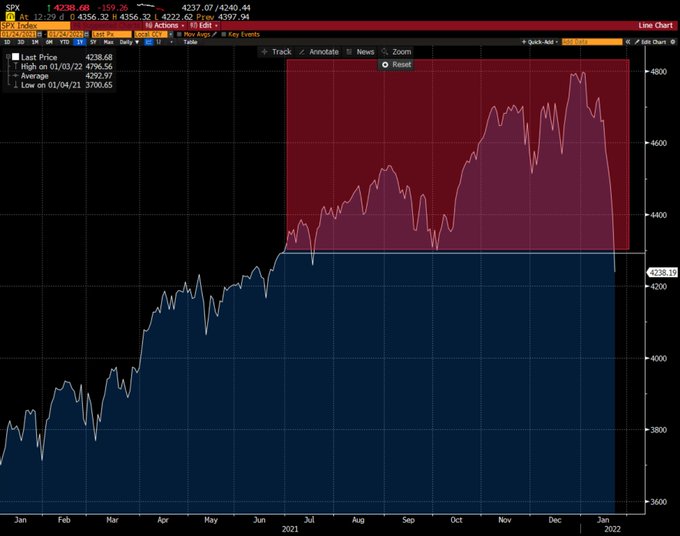
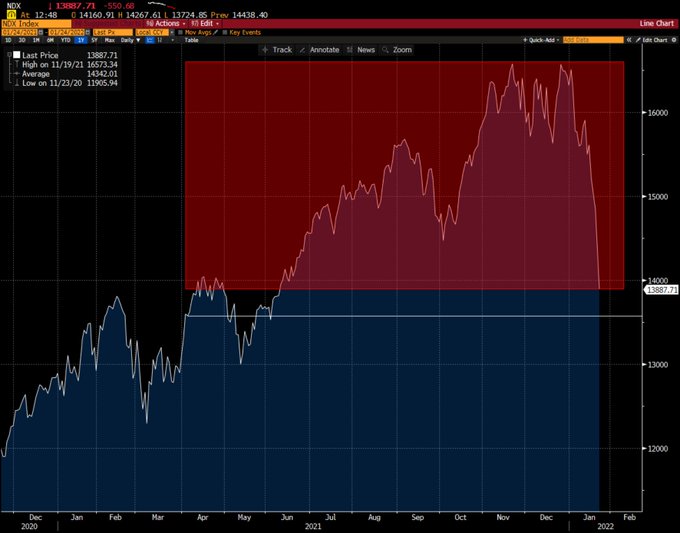
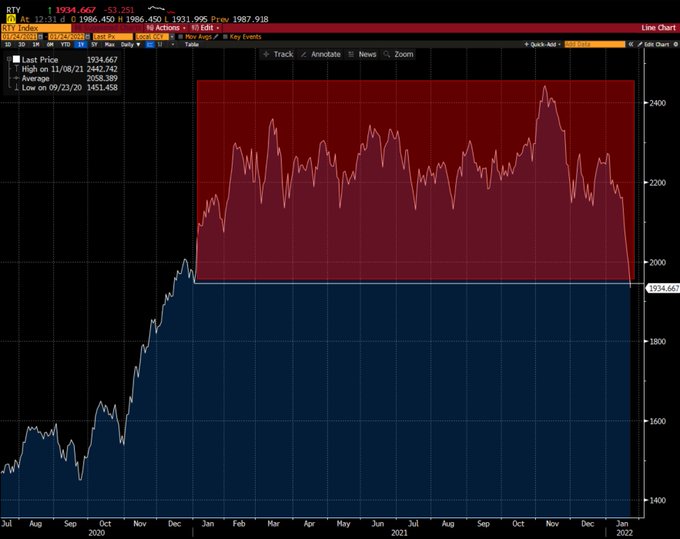
Our accounts have held in very strong over the past few weeks, with markets at their lows of the day, the NASDAQ down nearly 5.00% we were down roughly 0.55%; given the late day rally, we both finished the day in the green. We will continue to aggressively defend our capital.
In our earlier description of Kingda Ka, we omitted the fact that following the 90° free fall decent there is a 129-foot second hill designed to provide free-floating airtime. In the world of investing, that’s the pit in your stomach after you’ve watched 30+% of your hard-earned capital erode … don’t do that to yourself, it’s ok to get off the ride a little early, risk happens FAST.
One of our founding principles is the preservation of our clients’ wealth. Over the past few months, as market breadth narrowed and indices were pulled higher by fewer and fewer companies, we knew it was a sign of bad things to come. We pulled back in places and at times where we saw many people going all-in to buy the FOMO trade. Managing RISK throughout market crashes is imperative to future compounding; and as we’ve noted in the past, one last time, RISK HAPPENS FAST.
As a result, although we may have missed some profits during that frenzy, we are quite comfortable with where we are now positioned. We’ll grow our assets over time; we’ll work through our mistakes; we’ll compound our clients’ wealth.
We’ll continue focus on managing our risk, seeking out asymmetrical risk reward set ups, letting our winners run while cutting our losers before they become problematic, while we diverged, we’ve caught up quite a bit in the last 2 weeks and believe we’ll continue to do so as deflation continues to be the prominent investing regime over the next 2 quarters. We remain firm in our process and discipline…
As always, we’re happy to discuss our market thoughts along with these strategies and more, never hesitate to reach out with any questions or concerns. Thank you for your continued trust and support!
Good Investing,

Mitchel C. Krause
Managing Principal & CCO
Please click here for all disclosures.


