

In This Article

Slightly out of the ordinary…
I write these notes for numerous reasons; first and foremost, to disseminate information; educating and coaching clients is my top priority. Admittedly, there is a marketing slant; reading, research and corresponding with clients takes up quite a bit of our time, so if our work stands out and resonates with readers and we can gently nudge said readers into becoming a client; it becomes a win win.
Having said that, if this month’s note can influence any reader to do a single thing, it would be to listen to the following Podcast. The End Game w/ Grant Williams and Bill Fleckenstein featuring Mike Green of Logica funds.
If you have already, please consider doing so again! While centa-millionaires to billionaires have the ability to sit face to face with Mike, this podcast gives every investor, from big to small the ability to learn something invaluable.
It is my humble opinion that Mike Green will go down as one of the finest thinkers/financial minds EVER. This man’s work and thought process are a GIFT to anyone with an open mind.
Should you be pressed for time, skip the first 39 minutes… What NO investor should miss is the final 54 minutes.
- “Beyond limit down, they literally go to ZERO” … “There is no bid” – minute 55:12
- The problem with that is simultaneously it takes volatility through the roof” – minute 54:26
- “Because that’s what markets are; markets are the solutions for transactions. The price that you see is the intersection of supply and demand, not in some theoretical sense but the point at which buyers and sellers were able to meet and balance that book” – minute 55:18
- “There’s NO price in which that market can clear” – minute 55:40
Any brief synopsis I provide would be robbing you of an education that far surpasses an advanced level masters course and it’s only 90 minutes (there is zero exaggeration in this claim). Please rewind and re-listen often to fully digest what he is saying… I will be referencing some of his thoughts next month as I’ve been working on a piece that intersects with his work.
You’re welcome…
Halftime…
2020 has been one hell of a year. There has been enough pain, trauma, and uncertainty for a full business cycle let alone a mere 6 months! From COVID and BLM to multi-trillion-dollar bailouts, astonishing market moves in both directions, record bankruptcies, and record unemployment, … 2020 has been anything but “normal”.
Having said that, the whistle’s just blown … HALFTIME.
Halftime provides athletic coaches the opportunity to “re-group” and “re-think game-plans”. When it comes to investing, every moment markets are opened provides us with opportunity to make better decisions. For years, we’ve written about “noise” and the adverse effects it can have on decision making. Shutting out that noise to focus on process and the larger thesis is critical at times like these…
Today, we’re going to take this “halftime” as an opportunity to do a little coaching. This is a chance to think about some of the recent decisions we’ve made and why, as well as the overall indicators of market health and possible directions for investments. This is a time for strategic thinking.
Let’s start with the simple concept of “The Market” … The question we pose to you is, which market? What is it that you think about when you hear or discuss “the market”: S&P? DJIA? Nasdaq? Russell? COMEX (Commodities)? Treasuries? Gold? If you are thinking of stocks, are you thinking of Tech? Transportation? Travel & Leisure (Hotel, Cruise lines, Casinos, Airlines)? Financials? Industrials? REITs? Commercial Real Estate? Energy?
Q: What markets do you think you’re invested in?
Q: What markets do you want to invest in?
A: Just the ones going up at that moment.
OK, we get it; you want to preserve and increase the value of your capital. If we’re being intellectually honest, the vast majority of investors and the mainstream media focus only on stocks, typically measured by the S&P 500 or the Dow (DJIA).
This is one of the more challenging aspects of any true asset/risk manager’s job. On one hand, clients want to be insulated from risk, hedged if you will. While on the other hand, most judge their returns based off a benchmark like the S&P, so their focus needs to be widened. With patience and a long-term perspective, this dynamic can be achieved.
While most investors say they are longer-term investors, the first question I typically hear from clients is, “how are we doing” (inevitably: today, vs. the S&P or Dow). This focus makes it all the more challenging to manage quarterly and yearly expectations.
Let’s see if we can simply illustrate this though with the below exercise?
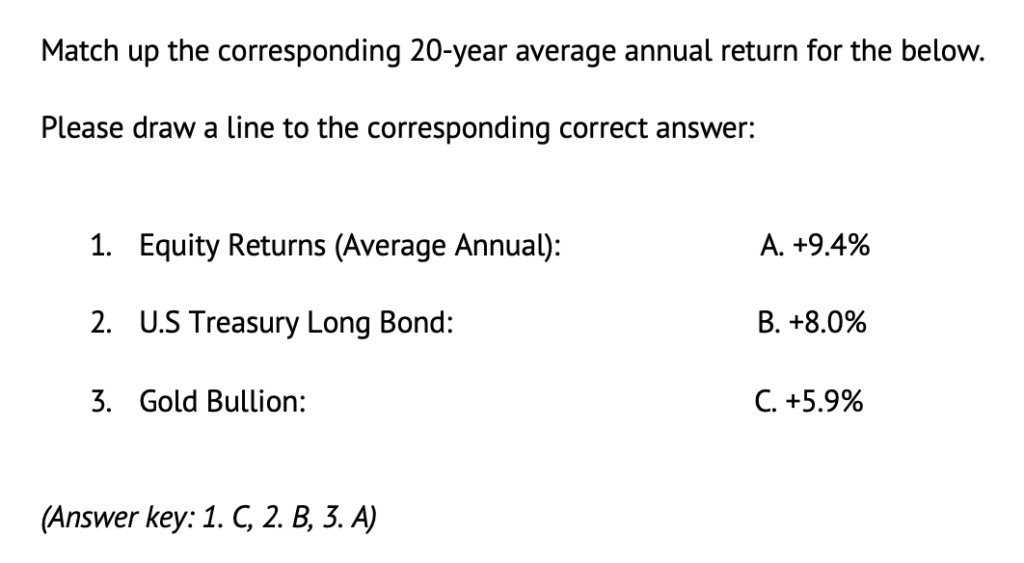
Over the last 20 years, gold has returned roughly 9.4% p.a. (per annuum), followed by bonds (in this case, the U.S Treasury 30-year Long bond), which provided 8% p.a., and US equities bringing up the rear at only 5.9% p.a.
The rub … these returns were not perfectly correlated to traditional headline “benchmarks”. There were times when gold was significantly underperforming against equities; and times when bonds outperformed, while equities underperformed, and so on… The more investors focus on a shorter-term benchmark, the more difficult it is to position for inflection points allowing us to outperform those bogeys with less volatility. Having said this, inflection points matter – and we’re currently at an inflection point.
The inquiring reader will challenge the 20-year time frame used above, but we can make the point in the shorter term as well. The Equal Weight S&P 500 has barely budged over the past 2½ years; the NYSE composite is currently trading where it was in mid-September 2017; the Russell 2000 is at mid-2017 levels… While the 30-year Treasury Zeros are up over 50%during that time. Gold has had excellent returns since 3Q2018. And both gold and long-dated bonds have performed without the extreme volatility of “The Markets”.
Of course, we don’t advocate a gold-only portfolio or a bonds-only portfolio, but there are times when skewing the weight of certain holdings makes sense. It is equally clear that a stocks-only portfolio can underperform. A portfolio strategy and portfolio performance must be more broad-minded than just the S&P/Dow. Another way of looking at this, is that if you are willing to spend a lot of time thinking about the stocks that you invest in, don’t you owe it to yourself to spend as much time thinking about bonds, gold, and commodities in an effort to smooth out performance?
Rollercoasters and thrill rides might be great vacation fun, but freefalls and extreme valleys don’t belong anywhere near one’s retirement funds.
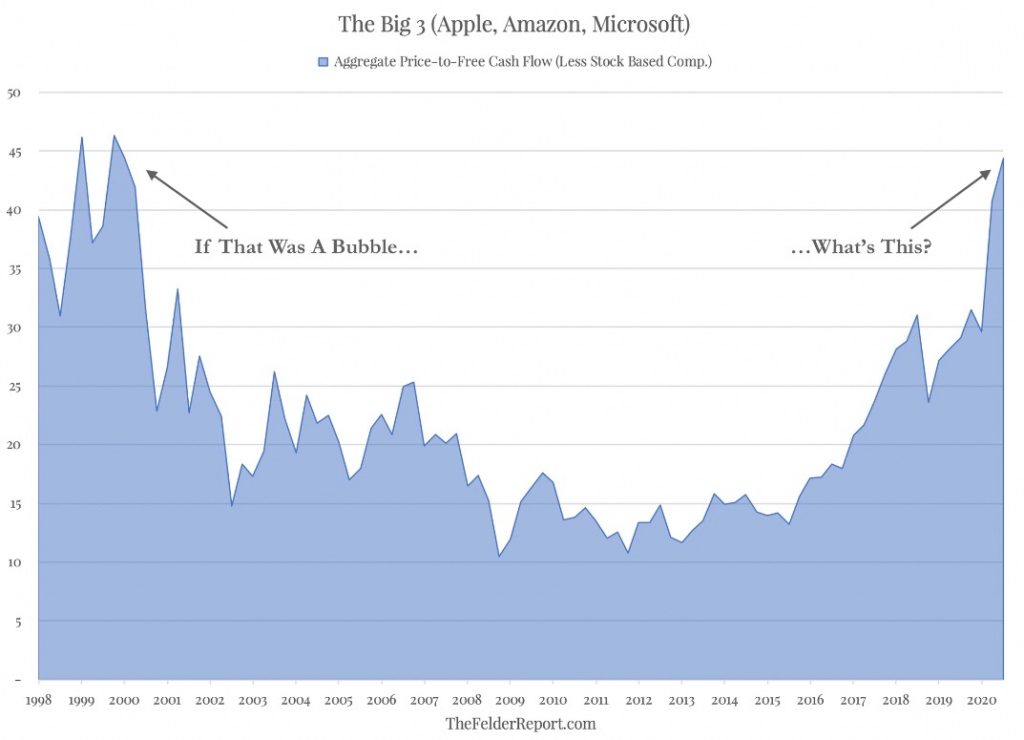
We’ve all made the mistake of watching a stock rise, feeling left behind, and buying into it near the top. It’s such a human temptation to chase the prize — the FOMO. If your goal is to chase that shiny object, then yes, the opportunities are there — Nasdaq is currently hovering near an all-time high, TSLA has been on an epic tear, AMZN is solid, etc. etc. But don’t just focus on that shiny object. The S&P 500 is not a proxy for the economy. It is too painfully clear that the stock valuations have become disconnected from underlying economic fundamentals. And, in an election year, stocks have become a tool to manipulate public opinion.
For your consideration, first from Jesse Felder of The Felder Report:
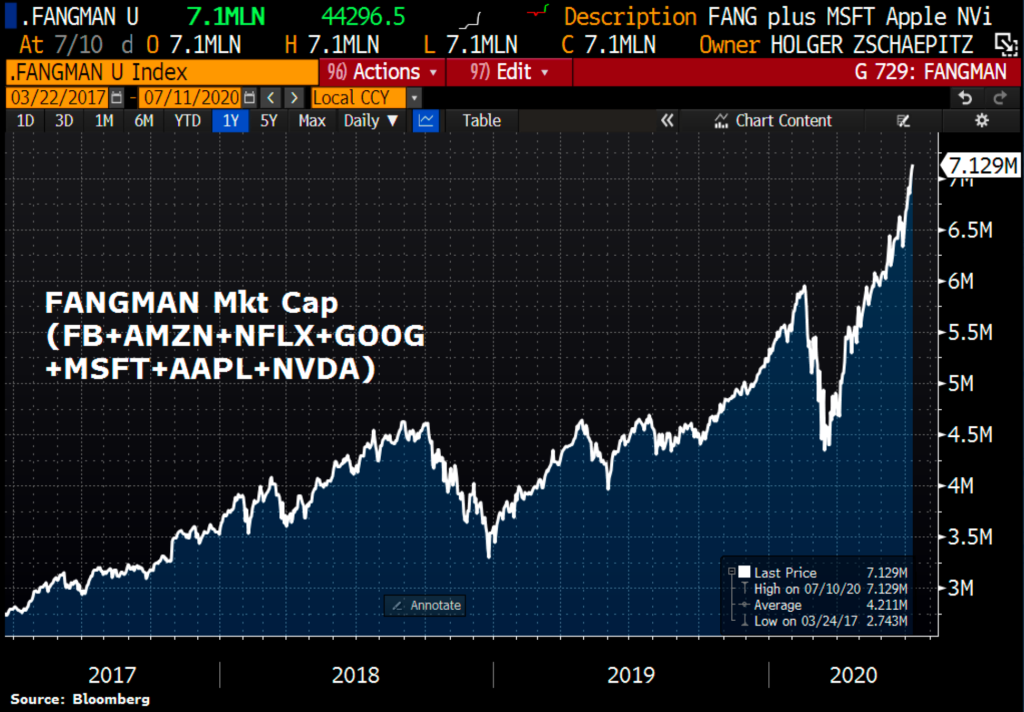
Additionally, Holger Zschaepitz @Schuldensuehner recently illustrated with the below graphic on Twitter, noting … “The combined market cap of #FANGMAN (Facebook, Amazon, Netflix, Google, Microsoft, Apple, Nvidia) tops $7trillion this week, equal to combined GDP of #Germany, #Italy, and #Indonesia.”
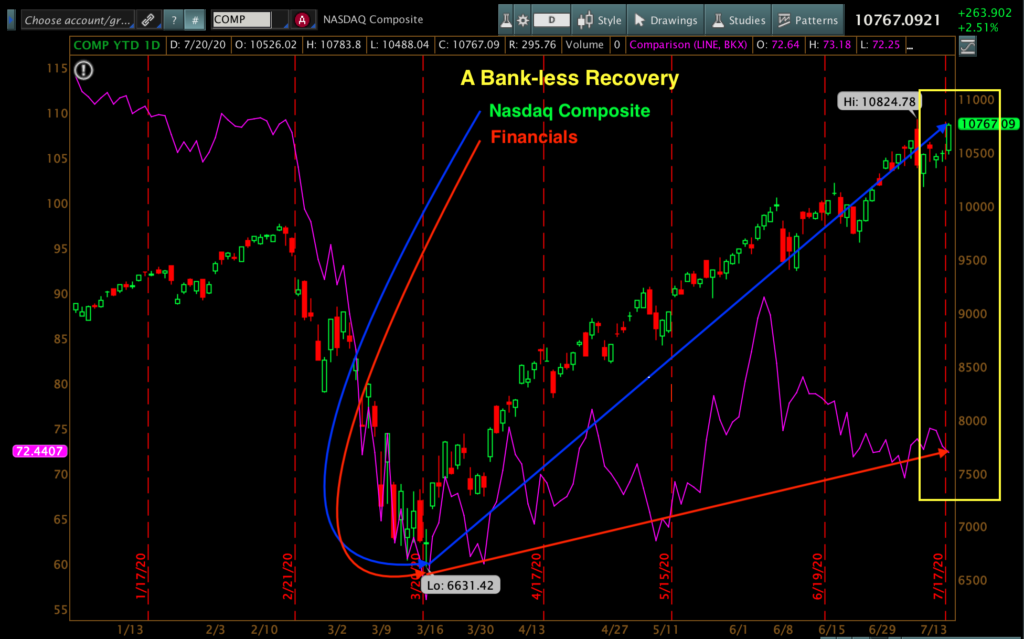
Bank of America recently illustrated this brilliantly in one simple, jaw dropping graphic, noting that 78% of the return of the S&P 500 over the last 5 years has come from Tech & e-commerce companies.
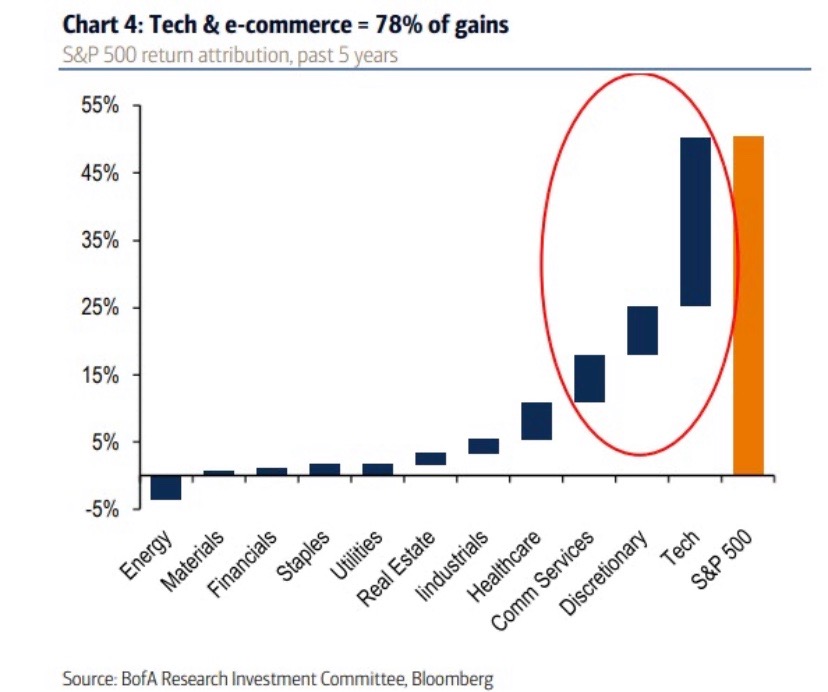
Arguably more importantly, this so-called “recovery” has been bank-LESS.
I know ZERO Wall Street models that recommend individual investors to own only two investments in the S&P and Nasdaq – and yet that’s exactly what many investors do when they chase momentum, and it is what most investors use as a benchmark for their account’s performance.
So, what’s wrong with the S&P, Dow, and Nasdaq?
Murky Water…
Simply put … the equities markets are NOT healthy.
Exhibit 1: Who knew that all you had to do was go to sleep and wake up with a greater account value than the night before?! It’s just that easy. ZeroHedge recently put pen to paper… and since the beginning of May, the S&P has gained ~314 points… Of which, “MORE THAN ALL OF THOSE GAINS HAVE COME WHEN THE US EQUITY MARKET IS CLOSED”. That is, the gains happen during the low volume overnight futures market.
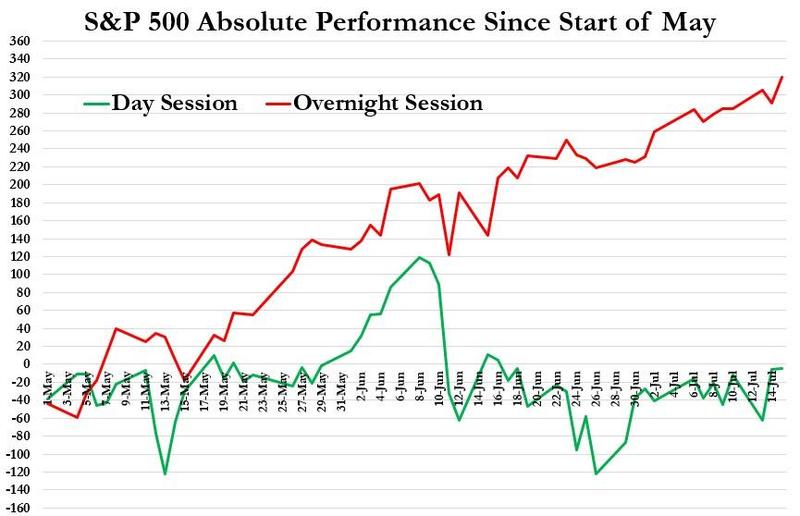
They continued, “Yes you are reading that correctly: During the US day session, the S&P has lost 5 points; and during the overnight session (from the cash close to the cash open), the S&P has gained 319 points.”
The fear is that overnight futures can be artificially maneuvered on their light volumes.
Exhibit #2 – Market Valuations: Gentle reader, we don’t need to recite here what you have seen and heard dozens of times over the past year. Markets are at excessive peaks. Period.
As reported by FactSet, “S&P 500 Reporting lowest Net Profit Margin Sincere 2009”.
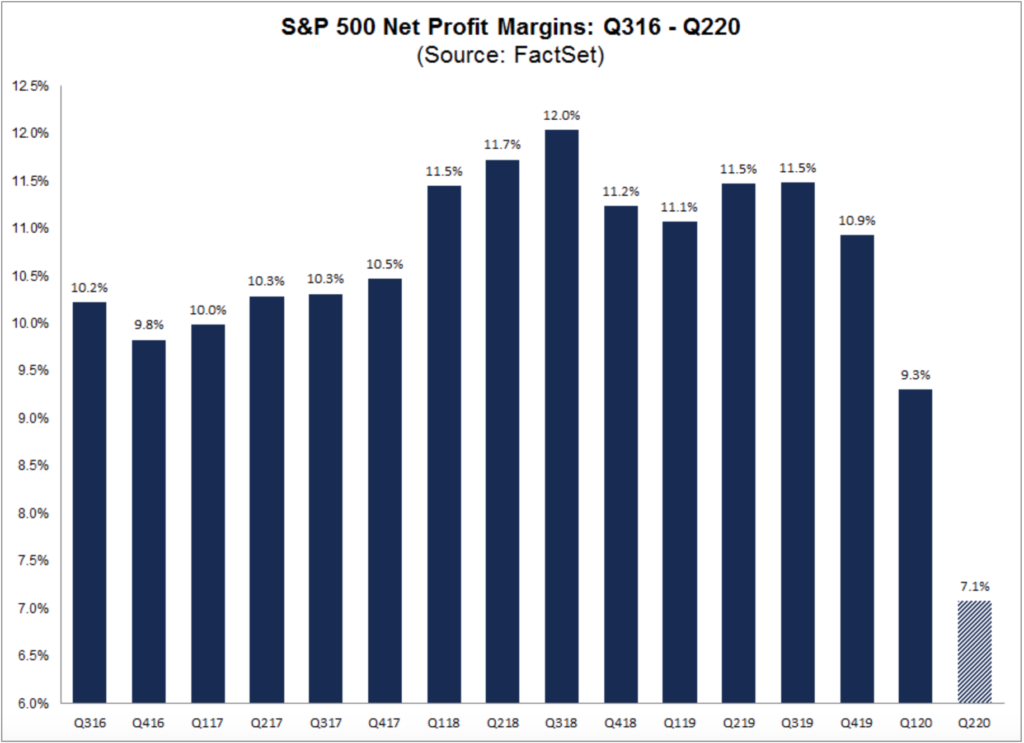
Exhibit #3 – Consumer Spending: There is some evidence that consumer spending is recovering, but the question is whether this can be possible and more importantly is it sustainable? As reported by Reuters, recent research from the JP Morgan Chase Institute now shows that “Americans who received enhanced unemployment benefits due to the coronavirus pandemic spent more than when they were working”; on average 10% MORE. This is in stark contrast to the typical 7% CUT seen in other recessions.
So, how can this be? As the report points out, in normal recessions “regular jobless benefits amount to only a fraction of a person’s prior earnings.” But this time is truly different. As you have probably heard, many unemployed workers are receiving MORE than they earned when they were working (nearly 68% more). This will not last forever, and as the report points out, “estimates suggest that expiration [of the benefits programs] will result in large spending cuts”.
In fact, personal income has RISEN in the face of over 53 million people having reported initial jobless claims? HOWEVER, there is an enormous difference between “money to spend” and “income earned” – one is SUSTAINABLE – the other is NOT.
While we mentioned that well over 100 million loans (auto, student, credit card, etc.) were in forbearance last month, consider the growing amount of data which reflects on consumer health (or lack thereof):
- As reported by S&P Global on auto loans: “Of the loans extending from March to May in the prime segment, 63.5% are still in extension status while only 21.0% have come out of extension status and made a payment. Similarly, in subprime, of the loans extended since March, 81.5% are still in extension status, while only 11.3% have come out of extension status and made a payment.”
- As illustrated in the charts below, New Extensions, re-extended, still in extension, no payments and charge offs seem to dwarf that of payments made or an actual loan being paid off.


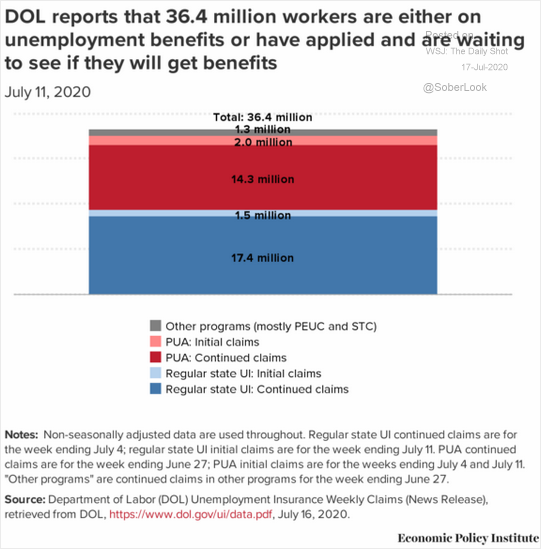
- This crisis has seen over 53 million workers file for initial jobless claims over the past 17 weeks and the DOL reports that 36.4 million workers are presently either on unemployment benefits or have applied and are waiting to see if the get benefits (graphic by @soberlook). That’s 23% of our workforce, unemployed.
- And for those workers lucky enough to still have a job, as reported by Politico, “Research shows nearly 4 million U.S workers have had pay cuts since February”. Mark Zandi, Chief Economist at Moody’s analytics estimates that number to be well over 7 million and notes when combined with those who’ve been required to “cut hours”, which is a defacto pay cut, that number surges to 20 million. That’s 12% of our workforce, with reduced wages on top of the 23% unemployed.
- COVID – the elephant in the room: the re-opening is faltering, with multiple states taking more steps backwards than forwards.
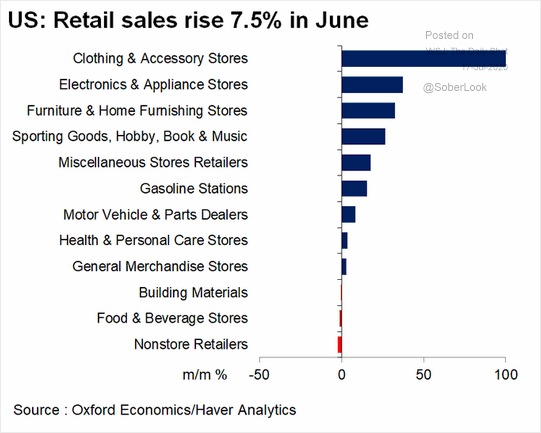
- Many (most?) consumers are spending with little thought for the future. Rather than saving more, when being handed a TEMPORARY GIFT, people are spending more on discretionary goods like clothing and electronics as shown below:
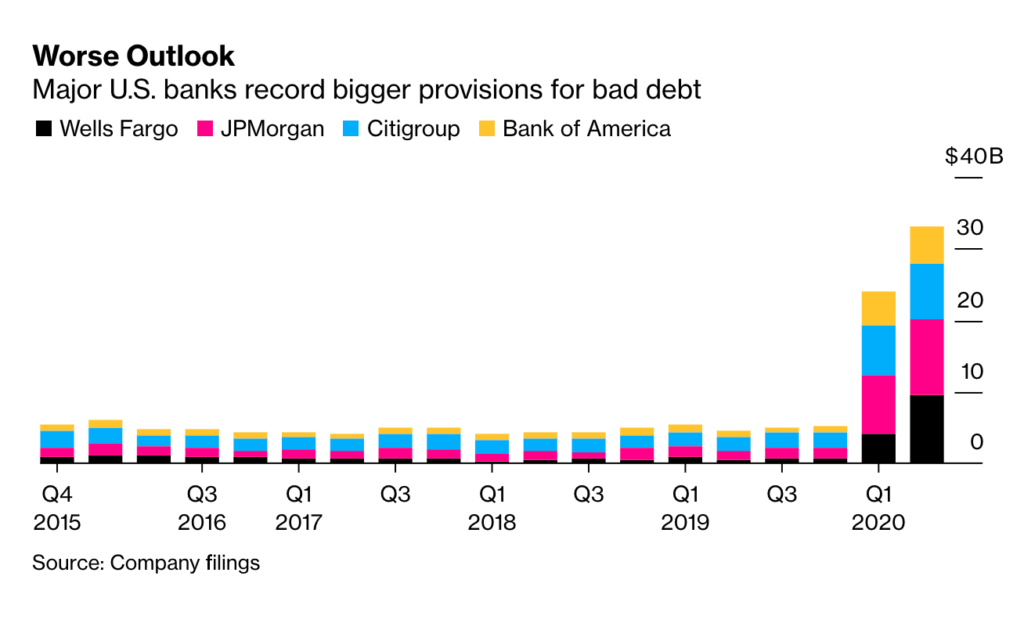
Which is why financial institutions from big to small are bolstering up loan loss provisions in preparation for the enormous losses staring them in the face. (graphic by Bloomberg)
It is tremendously important to note: Section 4013 of the CARES act suspends GAAP accounting for “for loan modifications related to the coronavirus disease 2019 (COVID–19) pandemic that would otherwise be categorized as a troubled debt restructuring” (CARES Act page 200). Not to worry, though, the act also gives financial institutions FULL DISCRETION as to what they report as a COVID-DEFERRAL vs. non-performing assets; “the appropriate Federal banking agency of the financial institution shall defer to the determination of the financial institution to make a suspension under this section.”
And financial institutions are without question utilizing this provision (**see Appendix**)
This may temporarily delay the inevitable. The time, however, will come when …
The unemployment benefits will stop; loans in forbearance still must be paid; rent and mortgage payments must resume; the music will stop!
| What to Expect #1: substantial decreases in consumer spending over the next few months (Decreased GDP). Strategy/Outcome: How will this impact the investments in your portfolio? If you have long positions in cyclical stocks or consumer stocks, consider a system of trailing stop losses for downside protection. |
So, there is a lot of murkiness about the future of our consumer-based economy.
Another piece of murkiness is the long-term impact of the helicopter money from the Fed and the government. Trillions of dollars now, and trillions more to come — another $3.5 trillion dollar rescue package speaker Pelosi is touting. “I have no doubt they’ll come around,” Pelosi said…
As we finish up final edits, reports of a Republican stimulus bill with a price tag of $1 trillion dollars is circulating reducing the $600 per week additional unemployment benefit to $100 per week. That might just hurt a little…
Whether it be $1 or $3.5 trillion, we’re not going to re-hash the economics of it all –our May note covered this in detail. A deflationary outcome becomes most probable in the LONG TERM, but when governments and central bankers drop trillions of borrowed money on the table, some crazy sh*t is likely to happen, and no one knows exactly what the impact will be. The scope and scale of these rescue programs is unprecedented, and the American programs are far and away larger than those of any other major country.
| What to Expect #2: more fiscal stimulus (this is an election year and the politicians are not going to behave responsibly). Strategy/Outcome: Will this impact confidence in the USD, when the world sees a fiscal deficit of $864 billion in one month (results in an annualized rate of 48% of GDP!) and total government debt currently at 125% of GDP. Is this why foreigners are unloading USTs? If you are in this camp, then think about Gold and Commodities. As Keith McCollough, CEO of Hedgeye recently stated, “No country has ever been able to devalue the purchasing power of their people, again, while the economy is slowing and they’re raising deficits to double digits (as a percentage of GDP) and triple digits debt (as a percentage of GDP). NEVER.” (The Macro Show 7.27.2020 minute 4:20) |
Talk about murky waters…
What does it all Mean?
TIME and PATIENCE are among the more valuable ASSET CLASSES moving forward. Recognizing and understanding that a shift is upon us is what’s most important right now.
…We do our best to not “FEEL” anything. Emotions are very powerful and can be extremely detrimental in times like these. We will remain data dependent and probability centric. OSAM 1Q2020 Note
“I skate to where the puck is going to be, not where it has been.” ~Wayne Gretzky
The question becomes, do you, as an investor, have the ability to FOCUS on where the puck is going to be or are you trying to skate to where the puck is?
Managing risk and full cycle investing is different than the traditional point and shoot Wall Street model. When managing risk, it’s important to remain patient and focused. Phase transitions, much like risk, happen slowly then suddenly… We’ve talked about phase transitions in the past and we believe we’re at that juncture today.
| What to Expect #3: volatility is lower than March/April, but could easily explode to the upside. With the market reaching extremes of behavior and with an astonishing disconnect between market valuations and underlying fundamentals, conditions could change fast …. Strategy/Outcome: As mentioned in #1, above, consider the use of trailing stops on your long positions. A fast correction might take you out of a desired position, but it will give you a chance to sit on the side to gauge whether the correction was a temporary event, or part of a long-term and perhaps vicious decline. Strategy/Outcome: If you are concerned that the markets are at risk of a correction, consider buying long dated out of the money puts (these tend to become cheaper as volatility dips; be selective). |
As we stated in May: “The S&P 500 could very well hit all-time highs, artificially supported by unsustainable liquidity provided by the Fed. But, make no mistake … it is unsustainable, there are ramifications to what both the Federal government and Federal Reserve are doing.”
| Leading us to our current highest conviction trades of: 1. Gold; 2. Treasuries along the curve; and 3. A “very selective minority” of US equities and commodities. (You will recall that last month we set aside our position on the USD, perhaps temporarily. This cautious outlook in the USD has slightly modified our positioning in trades #2 and #3.) |
Conviction #1 – Gold: Gold and precious metal miners sold off into quarter end, however, the last few weeks have seen an explosion in these names. The sell off into quarter end placed pressure on our performance when compared to broader market “benchmark” indices (the S&P/Dow perspective) as asset managers marked their books. HOWEVER, the last week has seen these names bid significantly higher while traditional benchmarks lagged – an obvious example of the benefits of diversification and the importance of taking the focus off of the S&P/Dow.
So, WHY would I rather be invested in gold and miners, a strategy which pays little mind to the traditional benchmarks? The answer is above, in “What to Expect #2”, where we point to the risks of the extreme fiscal disturbances caused by the government and Fed support programs.
Conviction #2 – Treasuries Along the Curve: The MORE debt the federal government assumes, currently $27 trillion (127% of GDP), the lower interest rates MUST go. Yield curve control currently exists whether we admit it or not. For years now, the Fed has intervened in treasury markets to artificially suppress yields. We’re running enormous budget deficits at the same time that tax revenue is plummeting, which underlines the continuing requirement for low rates. And the Fed’s balance sheet has ballooned to well over $7 Trillion, which underlines the magnitude by which they are suppressing rates.
Interest rates MUST to go lower, to avoid pushing the disproportionate number of zombie companies into bankruptcy and to relieve the government’s debt servicing burden — see Understanding the Game from our 4Q2018 note. Lower yields will, of course, drive bond prices higher. We have made a subtle adjustment to our core treasury position, by shortening our duration and adding inflation adjusted TIPS to our holdings. With more debt incurred and less tax revenues coming in, debt servicing on every dollar of borrowed money becomes an even larger portion of revenue, eventually reaching the point where debt servicing would engulf all tax receipts. This year alone we’ve borrowed nearly 3-4 years of tax receipts, again as the Federal Deficit nears $27 Trillion dollars.
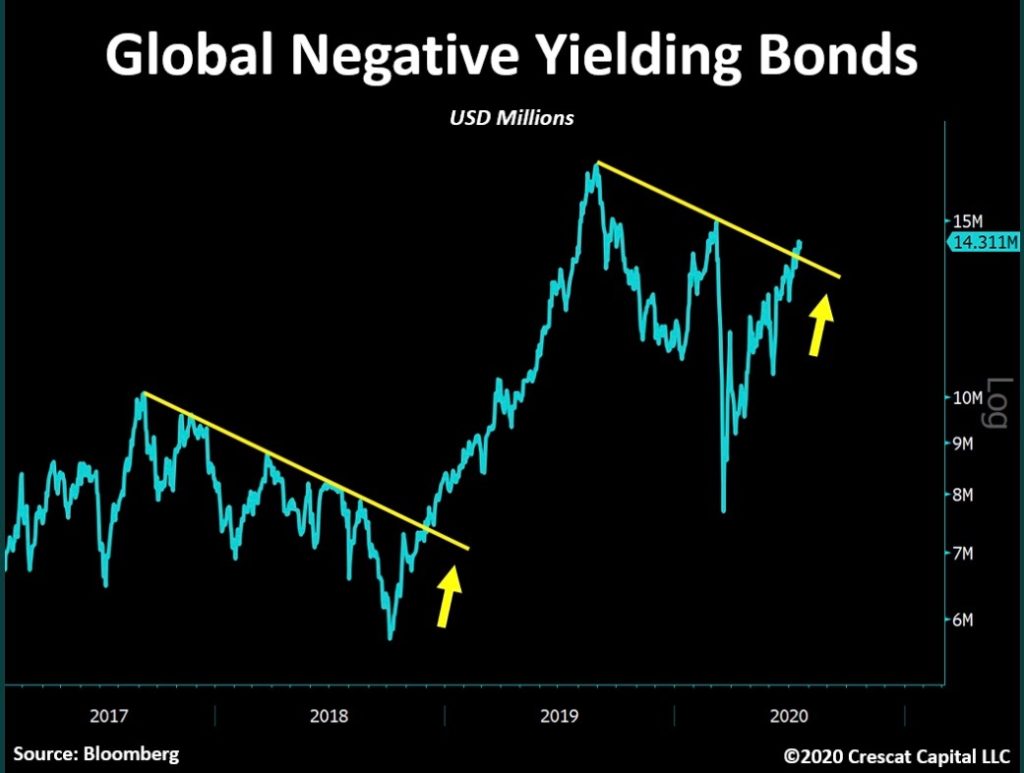
It’s important to note, the amount of money in negative yielding bonds has steadily been on the rise again, nearing $14 trillion dollars as Otavio Costa, PM from Crescat Capital @TaviCosta illustrated. While we do not advocate for negative rates, we shared our belief in the “Coming to America” section of our 2Q2019 note that they are a near certainty here in the US regardless of what Fed officials say about it. Central bankers have destroyed the global economy.
Conviction #3 – Commodities: The current weakness in the dollar, along with prolonged unemployment and a weaker economic recovery, signals STAGFLATION. In response to this, we have adjusted our third conviction to add commodities in the form of cocoa, cattle, hogs, uranium, palladium and rare earths, among others, which have all recently begun to outperform (again, post quarter end). Supply chain disruptions, mine closures, rig shutdowns, and bankruptcies have all had an impact on the cost of goods that you and I consume. This is likely to continue for some time.
For years, we’ve used certain metrics and market signals to measure the overall health of financial markets; when given time, reversion to the mean has worked. But every cycle is different. No, we do not believe this cycle will end differently than others, we’re merely stating that there are nuances to all bubbles. For example, the outcomes of the “dot.com bubble” and of the “housing bubble” were the same, but the driving mechanisms beneath the surface and the market behaviors manifested differently.
So, while we look to history for reference and some guidance, it’s the investors who successfully search out the nuances that ultimately win in the end. For now, we’re positioning ourselves for what we believe to be a phase transition as THIS BUSINESS CYCLE rolls over.
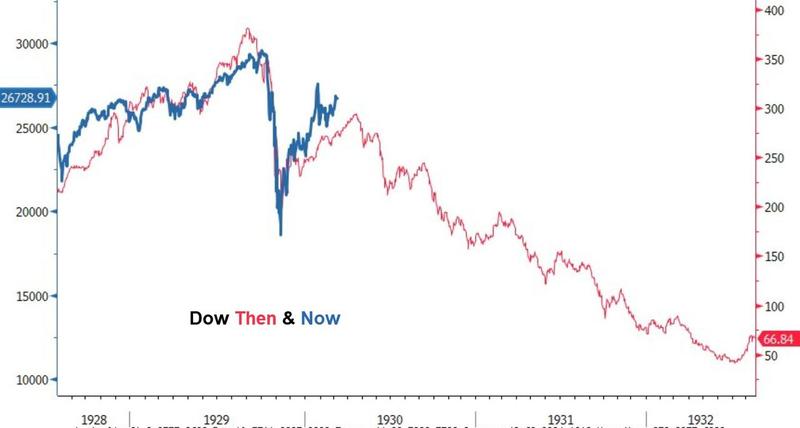
We’ll leave you with a recent chart from @ZeroHedge, with data sourced from Bloomberg. The Red line is a 5-yr chart of the DJIA from 1928-1932; the blue line is where we are today… Times are different, similarities are eerie, what the final outcome will be is anyone’s guess; we’ll stick with our process and the data…
| PATIENCE: “I can, and I will, wait…” Tom Bulleit: Bulleit Proof |
As we mentioned in the introduction – Time and Patience are our best assets right now … As always, we’re happy to discuss our thoughts … never hesitate to reach out with any questions or concerns.
Good Investing…

Mitchel C. Krause
Managing Principal & CCO
Please click here for all disclosures.
APPENDIX
SBNY – Signature Bank 2Q2020 Earnings call – as noted by @RudyHavenstein 6:14 PM · Jul 22, 2020
Matthew Breese — Stephens Inc — Analyst
Okay. And just to better understand the portion that doesn’t cure. So this quarter is around $900 million, that just goes into another bucket of deferral, it doesn’t go to NPA or NPL yet, that’s up to you?
Eric R. Howell — Executive Vice President, Corporate and Business Development
Correct. Yes, we made the decision to give 90 day deferrals so that we could check in with our clients after 90 days, a lot of our competitors went right out of the box to a six month deferral. So we always had the plan that we would give 90 days, see how the business was doing and give another 90 days if need be.
Matthew Breese — Stephens Inc — Analyst
Understood, and then for the long-term deferral. Should we think that — think of it as you have the option as of, call it 12/31/2020, to add another 180 days, and that’s kind of the stopping point now where deferrals should migrate to NPL, is that correct?
Eric R. Howell — Executive Vice President, Corporate and Business Development
You know, after the six months, it will really be on a case-by-case basis, depending on really what’s happening with the underlying clients in their property and/or collateral.
Matthew Breese — Stephens Inc — Analyst
Okay.

