

In This Article

“For a moment, think stepping on the gas of a Porsche, launching it from 0 to 100 mph to then lighten up on the gas pedal gently settling your speed at a comfortable 90 mph. Quite different than a deflationary event which would be akin to slamming on your breaks abruptly decelerating from 100 to 20 mph.” OSAM May 2020
…It Continues
Publishing so late in June, we wanted to pick up where we left off last month regarding “persistent inflation” in an effort to drive home our point…
The month kicked off with a flat ISM and PMI; June ISM Manufacturing slightly decelerating to 61.0 from 61.2, while June’s PMI Manufacturing was flat from May, both registering at 62.1. June’s ISM New Orders registered a mild deceleration coming in at 66 vs. 67.
ISM Prices Paid, however came in at an eye popping 92.1 vs. 88 representing a MoM (Month of Month) change of 4.1. The last time ISM Prices Paid registered levels this high, dates to 1979 when a man named Volcker was taking the reins as Fed Chairman and the annual inflation rate was at 11.35%.
In addition to the ISM data increasing, U.S. factory orders for May accelerated to up 1.7% vs. -0.1% in April, having now accelerated for 12 out of the last 13 months; April’s slight decline being the exclusion.
We spent quite some time working through the CPI data last month for a reason. While the prevailing narrative of “transitory” coming out of the Fed may ultimately prove true, our disagreement comes in the form of an arbitrary definition of “transitory”; “not permanent”, well, no sh*t, thanks for clearing things up?!
The data is the data and so far to date, this month it continues to show that inflation is likely to be with us longer than consensus (and the Fed) has led us to believe until very recently. While none of the aforementioned data suggests screaming inflation, it doesn’t bolster the case imminent deflation, either. If anything, it continues to strengthen our case for inflation to remain persistently present. If you have yet to read last month’s note, we would recommend you do so…
Piggy backing off May “ever elusive” 5% print on CPI, June’s data released on July 13th was higher than expectations of virtually every polled economist, registering an increase of +5.4% w/Core inflation (Ex Food and Energy) coming in up +4.5%; small business optimism accelerated as well.
For perspective, +4.5% is the highest Core CPI reading since 1991; the highest monthly increase in 40 years and the headline number of up 5.4% is the highest sequential acceleration since 1982 … Both Headline and Core CPI saw sequential growth of +0.9% from May vs. +0.6% and +0.7% respectively, from April to May.
It’s always been mind boggling to us that food and energy are removed from what is uniformly considered “Core CPI”, the premise being that they are historically the most volatile components of the data series. True or not, as we discussed last month; outside of shelter, I can’t think of anything more important to human existence then FOOD (and arguably energy), though… I digress…
When discussing “persistent” last month we mentioned the importance of oil’s weighting in the CPI data:
“Given oil’s weighting in the CPI calculation, this data point alone could change the trajectory of inflation. But it likely won’t be alone”
And true to words, oil didn’t have to go it alone this month… While, medical commodities and care services showed mild deceleration, along with Apparel, Gas, and Electricity, as anticipated, food ticked higher, but more importantly, so did SHELTER, which increased +0.5 or +2.6 YoY, which again, comprises ~33% of the overall data. The shelter component is broken into 2 separate subsets, Rent and OER (Owner’s Equivalent Rent); OER comprises roughly 2/3 – 3/4 of the CPI shelter component.
We held publishing this quarterly till later in the month for two purposes; first, the Federal Reserve spoke on June 28th(we’ll touch on briefly below) but more importantly, we wanted to include housing data from both the Case Shiller and the FHFA HPI (Home Price Index), which was conveniently released July 27th, a day prior to Fed Chair Powell speaking. Quick distinction, the Case-Shiller indexes only use purchase price for their calculations while the all-transactions FHFA HPI also includes refinance appraisals. FHFA’s purchase-only series is restricted to purchase prices…
“Case-Shiller data rose 16.6% in the year that ended in May, up from a 14.8% annual rate the prior month. May marked the highest annual rate of price growth since the index began in 1987
…median existing-home sales price in June rose 23.4% from a year earlierto $363,300, a record high”
While the FHFA HPI announced:
“House prices rose nationwide in May, up 1.7 percent from the previous month, according to the latest Federal Housing Finance Agency House Price Index (FHFA HPI®). House prices rose 18.0 percent from May 2020 to May 2021. The previously reported 1.8 percent price change for April 2021 was unrevised.”
Housing is posting YoY increases of 16.6% and 18% depending on which data set you choose and yet the shelter component of the CPI is up a whopping 2.6% (I’ll let you square that circle).
However, the important takeaway is the trend is moving higher on the largest component of Shelter (OER). With the CDC’s eviction moratorium for renters also set to expire, though something is a brewing as we told you to expect last month, we wrote:
“Knowing this, does it surprise you that the CDC has just extended the eviction moratorium “ONE FINAL TIME”. No, seriously, it’s the last time, believe us.
Per the AP, “A Biden administration official said the last month would be used for an “all hands on deck” multiagency campaign to prevent a wave of evictions”
What to expect?! Think “bail out”; possibly an attempt to cap rent increases for once these moratoriums have been lifted, for you can bet your first-born that landlords will be increasing rent to offset the inflationary pressures they’re experiencing.
As I was writing yesterday this headline hit, “U.S. HOUSE SPEAKER PELOSI AGREES WITH BIDEN CALL TO EXTEND EVICTION MORATORIUM ‘AND WE ARE EXPLORING ALL OPTIONS TO DO SO’ … DEMOCRATS SEEK EVICTION MORATORIUM EXTENSION THROUGH DEC … -PELOSI SPOKESWOMAN
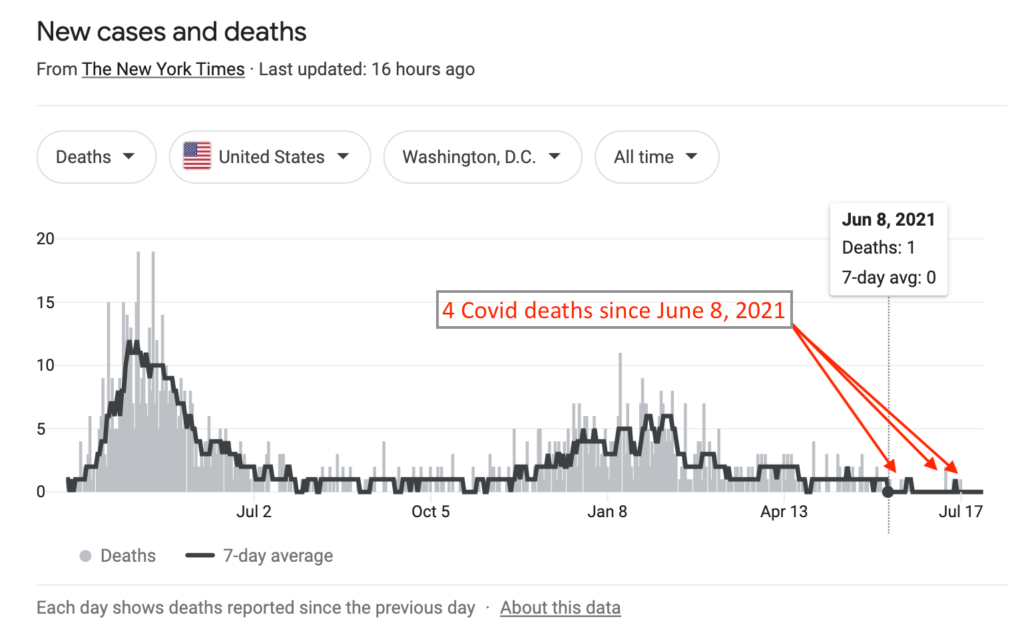
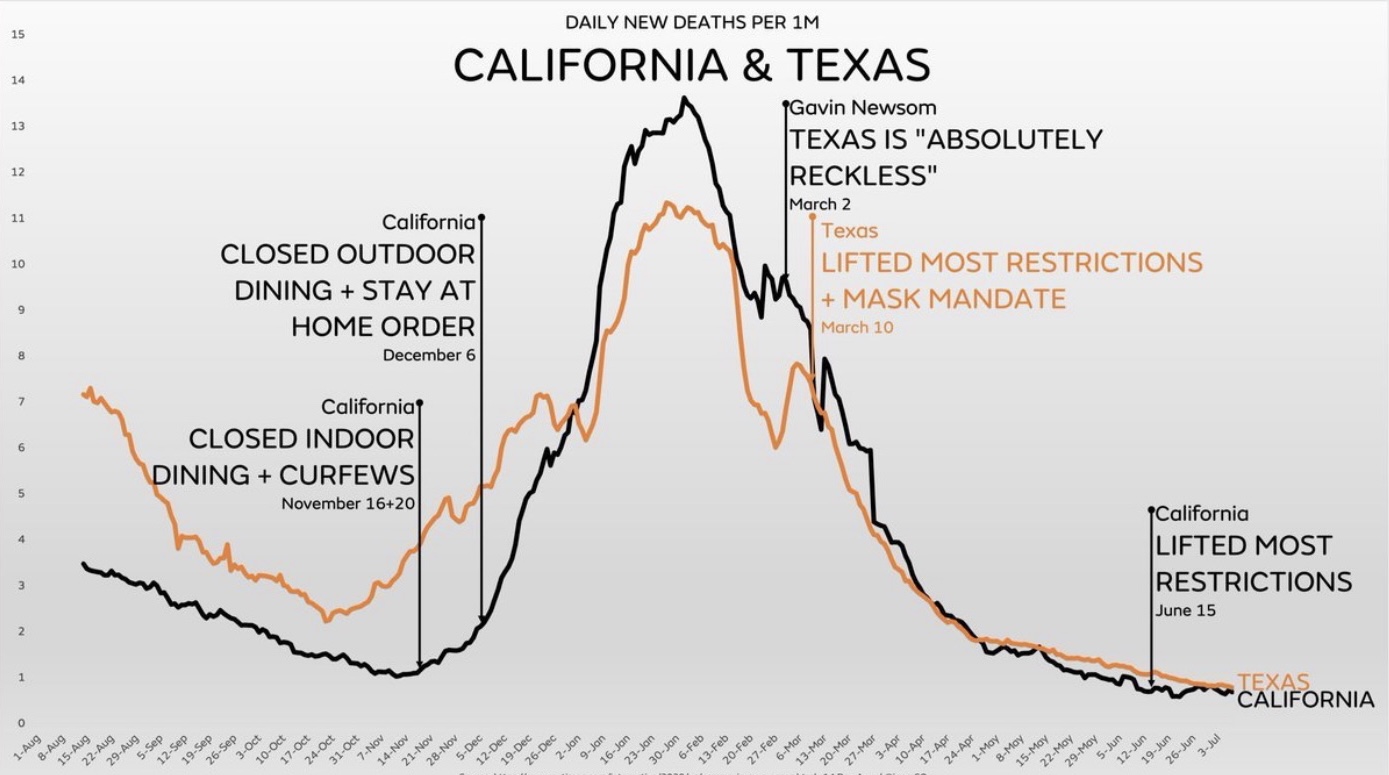
Remember when they said it would be the last time?! Like, 4 whole weeks ago when they said it?! You just can’t make this shit up anymore folks – you just can’t. And before anyone says the words “Delta Variant”, please visually understand your fear is likely artificially inflated:
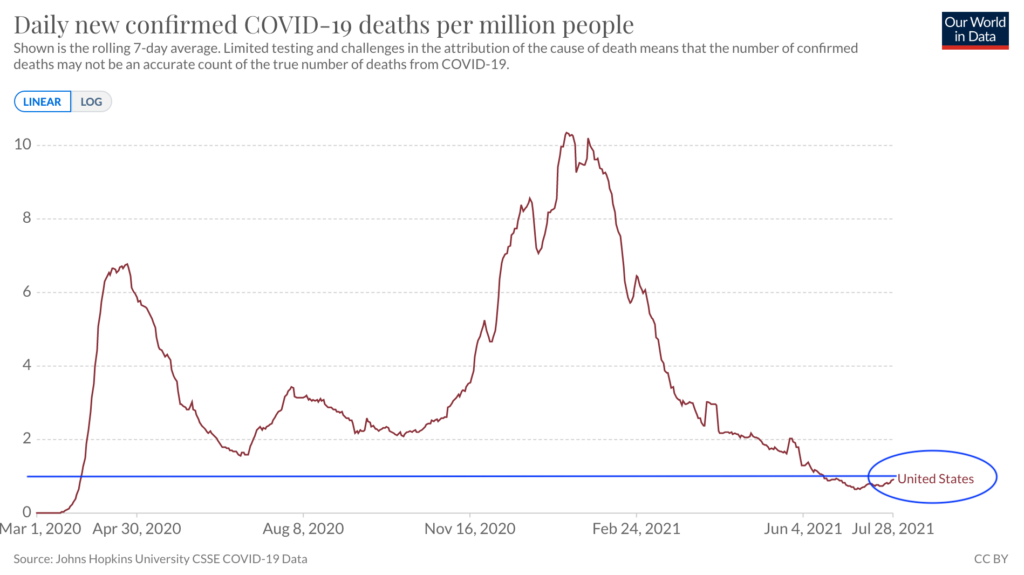
President Biden has recently labeled Washington DC a COVID “HOT ZONE”; now requiring citizens, including those who have been fully vaccinated to wear masks once again. Does anyone know what the hurdle rate needs to be to be labeled a HOT ZONE?
DC has had 4 COVID related deaths since June 8th – you read that correctly, 4 (FOUR) in just under 2 months. Don’t believe me – fact check me – see the chart below. That’s your resurgence folks, that’s your “Delta variant” in DC; your manufactured fear. There have been more murders in DC over this time frame than Covid related deaths and no data has been released on comorbidities.
Regardless of where you sit politically or how you FEEL about Covid, just know: the “all options to do so” Pelosi spokespeople reference in an effort to once again extend the eviction moratorium will require breaking the law as the CDC’s eviction moratorium itself was recently deemed illegal by the U.S Appeals Court; soooo, yeah, rents are already beginning to skyrocket …
Shelter comprises 33% of the CPI, ladies, and gentlemen … 33%
As quickly as pundits were to jump all over the sharp correction in the Agricultural complex last month suggesting “Food (prices)” may have peaked, the last week or so of trading has seen commodity price appreciation in everything from corn, cotton, and lean hogs to sugar and coffee… you name it. ALL OF WHICH COLLECTIVELY TRUMPS, the “BUT LUMBER HAS FALLEN” narrative.
We continue to harp on this persistent commodity inflation theme for it’s a tremendously important piece as to how we position ourselves from a macro investing perspective; labor markets are as well…
Labor Markets
It’s virtually impossible for an economy to be sustainably healthy with a weak labor force; “sustainable” being the key word. Multi-trillion-dollar transfer payments via PPP, bailouts, extended and enhanced unemployment benefits have spoiled the US consumer, maintaining the spending habits of some, while literally giving millions raises to stay at home; incentivizing individuals to remain unemployed rather than find a job … sustainable?!
These programs have also encouraged many Americans to make large ticket purchases via suppression of mortgage rates through the Fed’s purchasing of billions in MBS (Mortgage-backed Securities) which have sent new home purchases to all-time highs. (Good luck first time home buyers) Homes have become large piggy banks again, similarly to how they were used from 2005-2008 before the GFC.
At the end of the day, most homebuyers don’t really buy a house, they obligate themselves to a 30 years payment stream based upon what they can “afford” monthly. Using the most recent housing data cited above, a new home today costs roughly $363,300. If mortgage rates move up by roughly 1%, using that same income stream, your home price would have to fall by roughly 12% to approximately $320,000.
Fun Fact per Hedgeye financial analyst Josh Steiner, the Fed currently owns $2.5 Trillion in Agency MBS mortgages. That’s 45% of the entire agency MBS market ($5.5Trillion). At the current pace of purchasing $40 billion in MBS per month, they are adding roughly 1% of the entire MBS market to their holdings monthly. What could possibly go wrong?!
Transfer payments and suppression of rates simply can’t last forever; and one of these items is being addressed sooner than later; sooner as in … NOW.
We’ve been flagging labor shortages for some time, citing government policy as the culprit. At a time when employers are begging for help, Federal policy has become a crutch. From our most recent Q1 quarterly:
“With countless individuals still out of work, how could we be in the midst of a labor shortage?! Think Government policy pricing labor out of the market:
The government is making it easy for people to stay home and get paid. You can’t really blame them much. But it means we have hours to fill and no one who wants to work.” — Tom Taylor, owner of Sammy Malone’s pub in Baldwinsville, N.Y., The Syracuse Post-Standard.”
The adverse effects of nonstop stimulus and transfer payments muting sustainable economic growth by disincentivizing people from seeking employment has become too obvious to be ignored. Recently, many state Governors have finally said enough is enough and are finally putting an end to it by cutting the extended and enhanced federal unemployment benefits.
“vast expansion of federal unemployment benefits is now doing more harm than good”, said Montana Governor Greg Gianforte.”
As with most things these days, this has become a partisan political issue; sadly, it shouldn’t be. Of the 50 states, half have decided to end the increased federal unemployment benefits … All 25 of them being GOP led states.
This isn’t a function of destroying people’s lives as many would have you believe, it’s merely economics (which most politicians don’t understand). In separating the wheat from the chaff it’s simply incentivizing able bodies back to work to rebuild what once was a highly functioning and productive labor market.
Asking members of society who can contribute to do so is neither heartless nor abandoning fellow Americans, it’s the American thing to do.
One could argue those accepting the government payments incentivizing them to do nothing vs. contributing to society by actually working for a paycheck are the ones who have let their fellow hard-working Americans down, though again, I digress… I want to be crystal clear, my statement is nuanced; can contribute, but choosing not to is a much differentstatement then leaving those who can’t out to dry, we have other Federal programs for that; don’t take what I am saying out of context, though I’m sure the mere breath of what I said will lose me a few readers?!
Currently, our government is pricing labor out of the market destroying SME’s (Small & Medium sized Enterprises) previously dubbed the heartbeat of our America. If a business is lucky enough to even find employees, gross profits have been squeezed; sandwiched between extreme wage inflation on the labor side and significant price increases on input costs. Normalization of supply chains will eventually ease one side, while free markets would/should clear the labor side; unfortunately, government intervention is currently obstructing labor to clear.
Unintended Consequences
For those unfamiliar with the JOLTS economic indicator, it stands for (Job Openings and Labor Turnover Survey). From the Economic Policy Institute:
The Job Openings and Labor Turnover Survey (JOLTS) tells us how many job openings there are each month, how many workers were hired, how many quit their job, how many were laid off, and how many experienced other separations (which includes worker deaths).
As we’ve been noting, this data continues to show a labor market SCREAMING for employees, per the BLS:
“The number of job openings was little changed at 9.2 million on the last business day of May, the U.S. Bureau of Labor Statistics reported today” July 7, 2021
So why haven’t they gone back to work? We’ve already told you, Incentives… It’s not that difficult.
Currently, there is NO shortage of job openings, NOR of individuals to be employed. There are exponentially more job openings looking for bodies to fill them.
At the end of the day, the question ultimately becomes, will the decision of the 25 Republican Governors have a positive impact on the labor markets? While still very early in the process, the answer is yes and the data is crystal clear, continuing claims of unemployment benefits for the week ending June 26th came in at 368k vs. the prior week of 416k, falling even further to 360k claims as of the week ending July 10th…
Additionally, June Non-farm payrolls did NOT disappoint producing a significant beat of “economist” expectations coming in up +850k, which is a substantial increase and acceleration off May’s +583k.
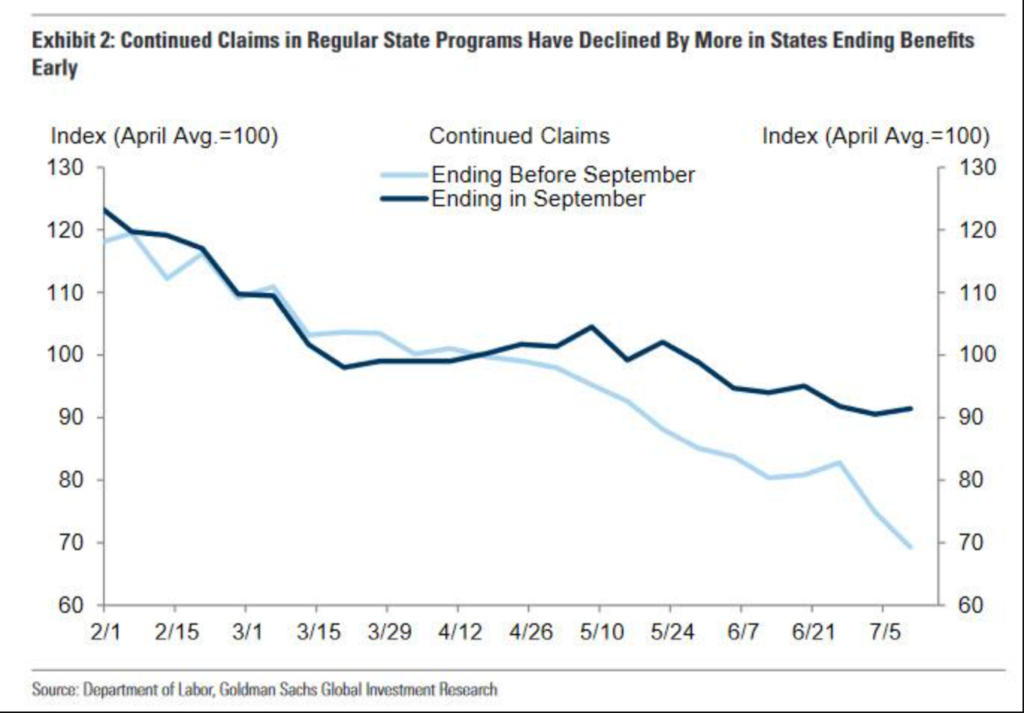
The above graphic shows exactly when the policy of these 25 GOP led states began working. Why late April, early May you ask? What would you do if you knew you were a month away from losing a paycheck? The answer for most who can is GO OUT AND GET A JOB! As more states implement their new policy of canceling the additional Federal unemployment benefits, this trend in employment should remain a favorable tailwind.
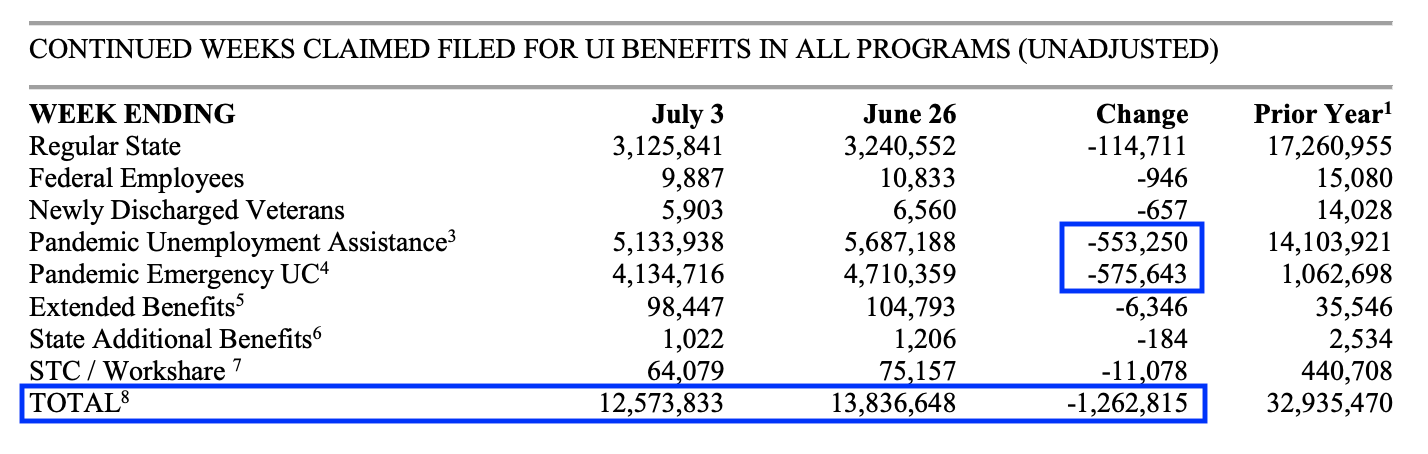
If you get your information from CNBC or Bloomberg you might be saying, but now now, most recent UI benefits jumped from to 419k from 360k, exceeding the “economist expected” 350k. Again, please look a little deeper and stop outsourcing your critical thinking to a bunch of marketing companies.
419k is a mild jump, yes… However, the more important number is something we’ve been discussing since May of 2020, which is PUA (Pandemic Unemployment Assistance) … Net net, continued claims were DOWN by roughly 1.262 million, 1.128 jobs alone to PUA and Pandemic Emergency (see below). THIS IS WHAT’S BEING CUT, AND IT’S WITHOUT QUESTION DRIVING WORKERS BACK INTO THE WORKFORCE.
Additionally, the mild uptick in UI (Unemployment Insurance) can be easily explained by an increase of claims in many auto manufacturing states. Also noteworthy, General Motors ($GM) recently announced a “temporary halt” to most of its full-sized pickup production due to the shortage in Semi-conductor chips we discussed last month.
Government intervention pricing private sector out of the market is not a foreign concept, in May of 2020, we wrote:
“Howard Marks (Oaktree Capital, specializing in distressed debt investing) understands cash flows and asset values. In a recent Bloomberg interview, Marks noted Oaktree has started “pulling back” since the Fed began its overly aggressive intervention. Marks stated:
Those of us in the markets believe that stocks and bonds are selling at prices they wouldn’t sell at if the Fed were not the dominant force. So, if the Fed were to recede, we would all take over as buyers, but I don’t think at these levels.” Bloomberg 5/18/2020
The government’s policy over the last year has priced employers out of the market, just as it priced large investors from properly pricing risk. We can argue whether well intentioned or for political gain, though it’s the same principle and in both instances doing exceedingly more harm than good
The JOLTS data shows businesses can absorb many of the currently unemployed, while the jobs data in both continued claims and non-farm payrolls reveal the GOP led policy to be working … anything else you hear is noise (marketing and politics), we’ll stick with the data. Great news, right? Let’s circle back to what we wrote earlier:
“If a business is lucky enough to even find employees, gross profits have been squeezed; sandwiched between extreme wage inflation on the labor side and significant price increases on input costs. Normalization of supply chains will eventually ease one side, while free markets would/should clear the labor side; unfortunately, government intervention is obstructing labor to clear.”
We know employers have been begging for employees, we’ve outlined the problem clearly. But what happens when Federal benefits run out on September 15th for the remaining 23 (Blue) and 2 (Red) states?! When schools reopen this fall and all the working mothers who left the workforce to care for their children who were forced into virtual schooling no longer have that commitment?
What happens when a shortage of labor turns into a glut virtually overnight and the leverage shifts back to the employer who’s watched their margins get decimated over the last year?!
The answer lies in Howard Mark’s words, “but I don’t think at these (income) levels.”
When inflation remains PERSISTENT and employees’ wages don’t keep pace with the increases in cost of goods like, SHELTER, ENERGY, FOOD, CONSUMER GOODS; This, dear readers is STAGFLATION, and it’s been the crux of our last two notes for a reason.
Our belief is certain politicians know this, which is why there is already talk out of the White House for more planned lockdowns. We’re hearing they will be announced for the second week of August under the guise of the “delta variant” (please revisit the charts above).
I hope and pray this is mere chatter for the data does NOT support the current marketing campaign coming out of Washington, however manufactured fear would be the only way I can think of to hold mothers out of the workforce and to perpetuate more stimulus handouts.
IF it happens, you will likely see a much greater divide between blue and red states, just what we need, right?! As an aside, It will also likely provide more confirming data that lockdowns and masks had little to nothing to do with the trajectory of the virus, driving a further wedge between friends and neighbors.
Why this all matters…
Simply stated: different asset classes perform better (or worse) predicated on the macro-economic regime or environment we’re either in or entering…
So, what do we mean by macro-regime or environment? Economies either grow or contract, we often use the words accelerate or decelerate as the growth is either accelerating or decelerating off a previous number or data set. Economic growth and inflation can accelerate or decelerate at the same time or diverge from each other creating different outcomes for a variety of asset classes.
When both economic growth and inflation are ACCELLERATING AT THE SAME TIME, you’ll often hear it referred to as the “Reflation” trade; this “economic regime” is what we’ve experienced since June/July of last year (thank your Global Central Banks and TRILLIONS in fiscal handouts); markets have responded accordingly.
A “Deflationary” regime is one that should be of concern to all investors; for it occurs when BOTH ECONOMIC GROWTH AND INFLATION ARE DECELLERATING AT THE SAME TIME. Understanding the difference in these regimes and how different asset classes historically back test, combined with the use of capital preservation strategies and risk management tools is what has drastically minimized our drawdowns since the onset of managing assets on a discretionary basis.
Our timing isn’t always perfect, no major leaguer bat’s 1,000%, though we flagged the second fastest and largest sell-off in modern day history 3 weeks prior to its occurrence, allowing us to sidestep much of it; while also doing similarly for the December 2018 carnage, the two most recent and notable risk-off events.
Knowing an economic regime change is coming and understanding where we’re transitioning from and probabilistically heading to is an important aspect of risk management. Making the phase transition from one regime to another is a bit more difficult than it sounds. There have been occasions, we’ve gotten caught off guard (and am sure there will be in the future). Obviously, the goal is to learn, get better every day and minimize those future occurrences.
Phase transitions, as I’ve described similarly with risk, often occur slowly then all at once as hedge funds and algorithmic traders recognize the regime shift and attempt to beat the next guy to the transition. Liquidity (or lack thereof) and leverage exacerbate the moves in volatility as it triggers a cascading affect where others pile on (this dynamic will likely continue and progressively get worse as passive investing gobbles up evermore market share from active managers).
We will never escape all volatility events; we do make mistakes and own them. However, should a phase transition be a little sloppy, understanding which economic macro-regime we are heading into does typically afford us an ability to play catch up, if necessary, by migrating into assets that historically outperform in the specific regime we’ve just entered.
Longer term readers know we subscribe to the work of Hedgeye Risk Management, we have followed them closely since late 2019. As a former highly successful hedge fund manager, Hedgeye founder and CEO, Keith McCollough has played this game at the highest of levels. Their modeling of macro-economic regimes is better than any I’ve seen over the course of my 25 years in this business; they measure and map virtually every tradable global market daily. Their forward-looking inflation NowCast models have simply decimated the traditional Wall Street “economist”, including that of the Federal Reserves.
I mention Hedgeye, for above, we provided a brief description of 2 distinctly different economic regimes, there are 4 (**if only investing were that easy). Hedgeye has proprietarily labeled these regimes “The Quads”; “Reflation” = “Quad 2”, while “Deflation” = “Quad 4”; though Quad 1 and 3 without question do exist, bringing us back to both last month’s note as well as today’s primary theme.
Quad 1 = a “Goldilocks” economy where economic growth is accelerating while inflation is decelerating, leaving us with one economic regime left to describe; Quad 3. The question is, how closely have you been paying attention to both the above as well as last month’s note?!
A Quad 3 environment is virtually the opposite of Quad 1 and occurs when GROWTH is SLOWING as inflation ACCELERATESor, as we’ve beaten the drum, remains PESISTENTLY HIGH! Sound familiar? We know inflation has been accelerating for months, and continues to remain persistently high with nearly 1/3 of the entire input just beginning to ramp higher (SHELTER); anyone know off the top of their heads what happened with yesterday’s GDP print? It came in at 6.5% QoQ vs. an expectation of 8.5% (that’s growth SLOWING), signaling STAGFLATION = Quad 3
As we noted last month:
“While overall, growth and inflation data may be slowing as some components soften, arguably, the most heavily weighted of inputs have either just begun to move higher (Shelter) or conditions remain favorable for them to reach new cycle highs (Oil). This divergence in data may create and environment which fails to press overall growth and inflation to new cycle highs, however, it very well could be strong enough to maintain a persistently high level of inflation, well above that of what we’ve seen in recent history. A scenario which could bring us to an environment that looks more like a short-term bout of “stagflation” delaying the “deflation” the data was suggesting would currently be facing.
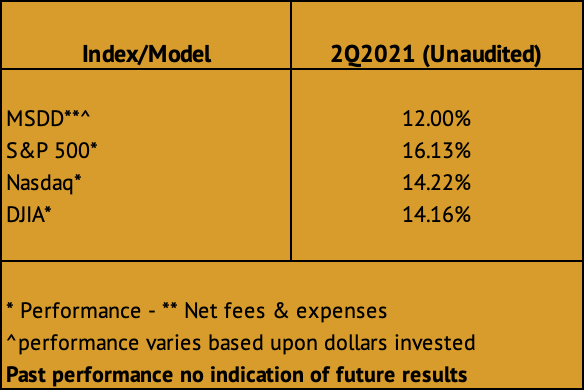
These above details “Matter” for it’s at the core of how we invest and position ourselves. It’s also large in part the reason we had a reasonably good 2nd quarter … Though, admittedly the last 4 trading days hurt our Q2 performance numbers; and while we won’t be reporting Q3 performance for another few months, we have had a divergence from primary indices through the most recent phase transition, so I thought it important to explain/detail what a phase transition is and why the last 3 weeks have been a challenge.
We’ve diverged from primary indices before (both positively and negatively) and while we often discuss the dangers of benchmarking, this divergence is a. one to learn and get better from and b. not one I’m proud of.
The most recent COVID Delta variant would be an easy narrative to blame our divergence on. To suggest most to all “re-opening” companies began to trade negatively around the same time rumblings of the rapid spread of the Delta variant surfaced, it wouldn’t be a stretch, it would be accurate. Regardless of what started the correction in these names, markets seized the opportunity to phase transition from a Quad 2 reflation regime to a Quad 3 stagflation regime relatively quickly.
As noted in our Q1 quarterly, we intended to ride our horses across the second quarter’s finish line … though as we’ve written so many times in the past, cycles don’t always begin or end on 4 dates of the investing year and this new economic regime began just prior to quarter end. The problem is we didn’t immediately recognize it as such.
Historically, Company earnings or (PODS ™ Hedgeye) trump Quads. Leading us to believe we’d see characteristics of both Quad 2 and Quad 3 temporarily straddle each other, rewarding our core small cap holdings slated to produce strong organic earnings growth and greatly exceed estimates. We would then phase transition into our Quad 3 “stagflation” holdings. And while we were right, intellectually, as many of our smaller cap names have blown the doors off earnings expectations, at the end of the day, we were WRONG as markets placed Quad 3 factor exposures ahead of any earnings strength, indiscriminately of how sustainable earnings growth may be.
Many of our names sold off into their earnings prints and have subsequently been flat to even more negative on what would ordinarily have been considered exceptional news. And while we did follow our capital preservation strategies, hindsight being 20/20 our portfolio construction was lopsided from a factor exposure perspective into the CV Delta Variant news.
While I won’t go through every name, some examples would be:
- $BYD: Boyd Gaming reported Sales of $893.6m v $790.65m beating the street EBITDA estimates by 34%, their margin growth was through the roof. Yet after opening +5% (where we were able to sell SOME) it fell like a stone, selling off by -5% eventually finishing the day relatively flat.
- $OSTK: Overstock.com reported $1.72 p/shr v $0.72 p/shr YoY, beat both WS estimates and whisper numbers, they grew over 2019 numbers, not just easy 2020 comps and the stock responded by opening down 8% on the news.
- $RRR: Red Rock Resorts reported $1.12 vs. $0.36 estimates… yes, you read that correctly and they finished the day down.
Virtually every small cap exposure we’ve done the work on has crushed Wall Street estimates – but the game isn’t about beating estimates, it’s about preserving and growing wealth.
How do we know it’s more likely a phase transition vs. the variant?! Again, certainty vs. highest probability. After a selloff in US markets, the underlying assets and factor exposures that historically perform well in Quad 3, snapped back while those that tend not to, i.e., small caps have continued their slide even into record earnings. Additionally, Gold which is a Quad 3 long has moved above its trend line (you’ll note we’ve been building our position in GLD for a few weeks)
We’ll claw our way back as we’ve occasionally had to do in the past, the same way we’ve protected you during truly dark times, by following the process. We continue to transition to underweight small cap exposure while increasing our positioning to larger, more liquid organic growers in Tech, Energy, Utilities, Industrials and Consumer Staples.
We’re still long select commodities and commodity proxies like FCX (our copper exposure). Even after the Chinese attempted to knock the price of copper lower. As we noted when this happened, releasing reserves may temporarily dampened the price of copper, yet future demand in a Quad 3 environment given the worlds push for EV (Electric Vehicles) should continue to bode well for us. For Perspective:
A typical conventional gas-powered vehicle contains roughly 18-45lbs of copper while a battery powered EV contains roughly 180lbs. For a market already under-mined in a severe deficit, demand must increase anywhere between 4 to 10 times depending on the vehicles being replaced.
Additionally, while OPEC did increase output last month, temporarily knocking oil prices down, as more of the world reopens (Canada, the EU and many parts of Asia) demand will increase creating a major draw on inventories. Long energy is also a Quad 3 exposure, so we continue to hold XOM & CVX. Should we lock down again, it may prolong the “re-opening” trade, and we’ll let our disciplines tell us what to do and when we need to do it.
It’s important to note that we’ve never stopped using our trailing stops, we’ve always remained disciplined to the original risk management tools which have always been at the core of our risk management process; some of which did trigger on a handful of companies, and we executed on them.
While the Delta variant news coincides with the divergence in small cap performance and continued talk out of Washington being of another lockdown, blaming COVID is an easy excuse. While these continued talks of lockdown likely didn’t help, I still blame myself. Buying the dip in re-opening companies had been a successful endeavor throughout the quarter, PODS have historically trumped Quads, though understanding the Quad shift was upon us, I put too much credence on historical earnings growth trumping the macro regime. Nothing in life has 100% certainties, it’s a probability game and while I played the probability, ultimately the MARKET IS ALWAYS RIGHT.
Tough pill to swallow for anyone who believes in straight up fundamentals, show these earnings beats to your old linear economics professors. Old habits die hard and understanding we must do more of what the market is doing, not what we believe should happen based upon any specific catalyst (including earnings) is the lesson.
Having done this for over 25 years, I understand the short term vs. long term discussion very well. I know why I do what I do and have seen it work very well over time. Patience is without question part of the process and so is failure, learning and getting better. While there are no guarantees in this business, we aim to learn and get better every day, that’s unequivocal.
We also know that clients who watched their accounts hold in extremely well during extreme downdrafts like 1Q2020 and 4Q2018 understand it, too. Though, we recognize that some clients who have come on board after the 2020 drawdowns have yet to experience all the benefits our process offers. It’s called a process for a reason, it’s not an overnight elixir… As we wrote August of 2019, we’ll stick with Odds over Outcomes and tighten up our portfolio construction as well as phase transitions.
Pro tip: If someone tells you they never make mistakes or have an excuse for every one of them, run away.
Before signing off:
**It’s important to note that there are micro-quads within the macro-quad framework; there are deep quads and narrow quads, multiple company PODS each being measured, mapped, and back tested. I’m aware that investing isn’t simplified into 4 economic quadrants, though in writing these notes for investors at multiple levels, we’re attempting to simplify the complex to appeal to a larger audience. We would note, in being able to recognizing a Quad 4/Deflationary environment, one can reduce their risk and greatly mitigate drawdowns.
We’ll continue focus on managing our risk, seeking out asymmetrical risk reward set ups, letting our winners run while cutting our losers before they become problematic, while we diverged, we’re not dead. Risk management gives us the ability to fight another day. We remain firm in our process and discipline…
As always, we’re happy to discuss our market thoughts along with these strategies and more, never hesitate to reach out with any questions or concerns. Thank you for your continued trust and support!
Good Investing!

Mitchel C. Krause
Managing Principal & CCO
Please click here for all disclosures.

