

In This Article


Distraction
Our family is constantly on the go … with two young girls, I find myself throwing my laptop into my backpack as I move from one location to the next: be it bringing my girls to and from school, soccer practice, a kids CrossFit class, or working around my oldest daughters’ gymnastics schedule, we’re moving non-stop.
That being said, we often find ourselves out to dinner more frequently than we should. Between client meetings or merely trying to get the family together, we unfortunately eat out more than the average family.
While out, our family plays quite a bit of UNO … we have competitive banter and conversation. What we also do is notice that just about every individual at the other tables around us are staring at their smartphones, while many kids are glued to a video or YouTube (with or without earphones).
In some cases, we’ve watched plates crash or glasses of water spill and virtually no-one moves. They are too distracted by a screen that they had little to no idea of the craziness surrounding them.
While thinking of a title and metaphor to open this month’s note, my mind kept bringing me back to the thought of a trainwreck as with each passing data point reported this month of January, I kept saying to myself … this is a trainwreck!
Yet, as many regular readers would know, I’ve been writing about deteriorating data for quite a while now, leading me to the metaphor … “A trainwreck in slow motion”. We’ve all heard the metaphor before, though I found some irony in the most popular online description as it’s frequently described as:
trainwreck in slow motion (plural trainwrecks in slow motion)
- (figurative) A catastrophe wherein the failure is obvious to everybody while it is happening.
The irony is that if you listen to any news network, be it financial media sources hosting Wall Street “experts” like CNBC, Bloomberg, MSNBC or legacy print media, such as the Wall Street Journal, NY Times or Financial Times … should you listen to any station speaking from a political point of view, including but not limited to anything out of our current administration in Washington, you’d think we’re in the midst of the greatest economic expansion in history!
Not only is the “trainwreck in slow motion” NOT obvious to everybody, but many truly believe the narrative that’s being fed/sold to them, even though it’s easily proven false should they pick their heads up from what’s distracting them … if only for a few minutes!
In this month’s piece, we’ll walk you through the data, through the lens of the economic cycle, for it’s played out about as accurately as we’ve written it would over the last year and a half – the only thing left to take place is for the passive bid to slow with the massive acceleration in layoffs, leading us to a rather painful period for equities.
Growth has all but dried up outside of a few accounting tricks and margins are already being compressed. Please take your time with this note in understanding how the cycle is unfolding, as well as where the data currently is given historical context and what’s the most likely probably outcome from here?!
Credit continues to deteriorate
Earlier this month $JPM (JP Morgan) reported earnings, which by headline … ‘beat’ Wall Street expectations of $3.35, coming in at $3.97 vs. last year’s number of $3.58. Though as we continue to stress, on a GAAP basis (a much cleaner number with less accounting magic) the number was arguably weak.
When we say cleaner, if you back out the nearly $3-billion-dollar FDIC special assessment charge that equated to roughly $0.74 and a $0.19 add back in corporate securities losses, the GAAP number was closer to $3.00; Credit costs at their Consumer and Community Banking (CCB) business rose, primarily due to card services, while expenses grew by nearly 10%, both contributing to a decrease in net income (which was down nearly -3% YoY).
More importantly, as we’ve been noting for some time, the trending deterioration in credit continues, yes, even at the largest, ‘most stable’ financial institution in the U.S. as delinquencies at $JPM came in higher across all lending verticals sequentially (BUT home lending) while credit card sales volume decelerated to 7% YoY from 8% across both credit and debit categories.
It’s important to remember that $JPM is the industries bellwether … a pillar of strength (by a country mile). They were the largest benefactor of the industries, ‘run on deposits’ in early 2023; as they received one of the sweetest deals ever when the FDIC literally handed them $FRC (First Republic) on a silver platter; AND STILL, we’re watching their credit portfolios deteriorate and delinquencies spike at an uncomfortable pace.
So, if flat earnings, a weakening loan portfolio, and spike in delinquencies is what’s transpiring at the best of the best, what’s taking place a few rungs down the ladder?!
In our last quarterly, we highlighted the weakening in credit through the lens of $DFS (Discover), in a section titled, “So, about that bank lending”; (we would urge you to read/re-read that section as the data is playing out exactly as we said it would in both that section as a microcosm to $DFS as well as our Ouroboros piece in looking at the larger macro backdrop).
we wrote:
“Consumers are literally choking on debt and the only source of earnings power for many of these credit issuers, including $DFS is to increase their unsecured revolving loans in the face of accelerating charge offs which are now touching levels not seen since exiting the GFC (Great Financial Crisis)?! Yes, seriously, we couldn’t make this stuff up if we tried.
We’re literally at the point in the cycle where countless borrowers are getting in too deep with a loan shark?! … with retail credit cards hitting a record high of 28.93% average APR, is there much of a difference?!”
Regular readers would know that we’ve been writing about what we believe to be an inevitable collapse in credit, detailing the unprecedented spike in the use of credit for nearly 2 years, in most cases, despite record high interest rates. We’ve done this as numerous Wall Street firms have argued it to be a signal of strength for the “resilient consumer”.
As recently as December, we highlighted that amidst credit companies pulling back on lending, a strong consumer wouldn’t run to BNPL (Buy Now Pay Later) companies for funding, yet they put nearly $7.3-billion-dollars on the books in November as nearly 40% of those required to repay their student loans missed their very first payment due in over 3 years; we wrote:
Fear not … U.S. consumers ONLY added an additional $7.3 BILLION to these BNPL programs from November 1st to November 26th, up 14% (per Adobe) as reported by @Zerohedge. We’re not exactly sure how much data you need to see in order to contextualize how large our current problem is, but its BIG!
This came at the same time nearly 40% of the roughly 22 million student loan borrowers MISSED their very first student loan payment which was due in Octoberafter the pandemic-relief pause ended (per the Department of Education). That’s right ladies and gentlemen, nearly 9 MILLION borrowers have MISSED THEIR VERY FIRST PAYMENT DUE and had NOT been paid through mid-November.
So, rather than repaying their first student loan payment, which hadn’t been paid in nearly 3 years, a host of Americans decided to load up on BNPL debt to buy heavily discounted inventory for the holidays…
Again, we ask … what could possibly go wrong?!
Well, we’ve gotten our answer as to what could possibly go wrong fairly quickly in regard to the BNPL space … which we’ll discuss shortly, but first we’re going to highlight the continued deterioration in credit, once again through the lens of $DFS.
In their most recent quarterly earnings report $DFS (Discover financial) reported $1.54 vs. Wall Street expectations of $2.50 … a 38% MISS!! Worse, it’s a 59% YoY decline as they reported $3.74 last year.
If this wasn’t bad enough, they confirmed what we’ve been saying all along, openly admitting that their 2022 loan book has turned out to be a “bad vintage”, as in … quite a few of the loans they put on in 2022 were poor decisions which have turned into bad loans (who would have thought)?! 2021 through 2023 were BIG years for the credit industry, especially $DFS … though in 2022, Discover’s loan book grew by over 140% of the number of loans they made in 2019; you simply can’t put that many loans on your books and do the proper diligence in such a short period of time and do it prudently!
They were doing this as credit metrics continued to deteriorate, and as we noticed in our 3Q2023 note:
“Credit card delinquencies at $DFS saw significant rise 3.4% vs. 2.1% YoY: a 62% increase! For reference, delinquencies were at 2.5% September of 2019.”
Net charge offs have risen from a reasonable 1.8% in 2022 to 3.4% (nearly a 90% rise); yet more recently, the company has given forward 2024 guidance for between 4.9% to 5.3%. Given this massive spike in delinquencies and net charge offs following 3 years of handing money to anyone with a pulse, the company has guided to ZERO percent loan growth in 2024 … ZERO … a GOOSE EGG … NADA … NONE!
In the face of rising provision expenses, a number which most recently grew by $1.03 billion while operating expenses increased as well.
Which leads us to ask ourselves a few questions:
- Do you really think that 2022 is the only “bad vintage” of loans recently put on their books?!
- Do you really think that $DFS is the only lender that is currently adversely affecting?! (SEE: $COF & $V among others)
- With earnings DOWN 59% YoY and delinquencies rising alongside expenses, do you really believe that $DFS has the ability to employ the same number of employees they currently do?!
Earnings down + delinquencies and expenses up is merely a different way of saying margin compression.
Keep these thoughts in mind while as we circle back to the BNPL loans discussed above. In detailing the BNPL (icing) on the massively large and looming debt debacle (cake) in December, we asked a snarky, sarcastic and what we thought to be rhetorical question: “what could possibly go wrong?!”
While organizing my thoughts for this note, @CNBC published an article giving us some insight into the answer to that question … you just can’t make it up folks! They titled their note … wait for it:
Wait, what?! Debt has to be paid back?! You mean I have to pay my bills after I spend too much money buying numerous pairs of over-priced shoes that I don’t need?!
If you really want a glimpse as to how bleak things are in that world, please, by all means … read the CNBC article, though the “key takeaways” listed below pretty much sum things up:
- Buy now, pay later helped fuel record holiday spending online, surging 14% year over year, but now that those bills are coming due, consumers aren’t sure how they’ll pay them.
- The surge in use of buy now, pay later comes as credit card debt is at a record high and delinquency rates have nearly doubled over the past two years.
- It’s unclear how often buy now, pay later bills go unpaid, but the people who use the services are more than twice as likely to be delinquent on another credit product, such as a car loan or mortgage.
While the first two bullets above are things we’ve educated regular readers on for some time, it’s the third bullet that should have the hair on the back of your necks standing straight up when you think of this statement in context with the hockey stick in delinquencies rates and net charge offs at $DFS as well as the majority of unsecured lenders around the country (including $JPM)!
As you ponder the above, let’s revisit the quote from Hedgeye’s Josh Steiner that became the genesis and influenced our 1Q2023 ouroboros note:
“Bank lending conditions are causal and reflexive, and they feed forward on themselves … so as they tighten conditions, economic activity slows … slowing economic activity drives non-performing rates (both consumer and commercial) higher … that causes banks to further tighten and contract activity and so on and so forth… UNTIL … you get the circuit breaker, which is the Central Bank, doing a full 180” Josh Steiner, The Call; 4/6/2023”
To which we noted throughout that piece:
“The consumer doesn’t have the ability to de-lever in this environment, they NEED MORE to just survive. Nevertheless, this will spiral us straight into record defaults on ballooned credit card debt, which will accelerate as layoffs do!”
“Businesses are watching this unfold as internally, their margins collapse given higher input costs and a consumer spending less, sending their confidence into the sewer … this ultimately leads to those accelerated layoffs … and while inflation is falling, it’s not doing so a. quickly enough to change or alter the Fed’s policy or b. to a level where the consumer needs it to be.”
To unpack
We said to prepare for record defaults, a collapse in Margins and accelerated layoffs:
So, let’s start with, “spiraling us straight into record defaults on ballooned credit (card) debt.”
While we haven’t seen record defaults; per S&P Global: 2023 brought us a 13 year high in U.S. bankruptcies (2010), with 50 new filings in December, surpassing the pandemic year of 2020! So the economy is so robust, and the consumer is so strong … that we saw more bankruptcies in 2023 than we did when every major government shut down the globe … right, got it!
For what it’s worth, 2010 was the previous high as we were coming out of this thing called, the Great Financial Crisis!
Next up, margins; “businesses are watching this unfold as internally, their margins collapse given higher input costs and a consumer spending less, sending their confidence into the sewer”
Margins are collapsing virtually everywhere you turn as earnings continue to miss, as “guide downs” continue to point to either NO or NEGATIVE growth. Sure, there’s the anomaly … as well as clueless management team, but earnings to date for the S&P are negative … for the Russell, they’re negative by nearly 29%. Behemoths like $AAPL to our example above in $DFS are telling you that NO growth is best case. UPS, Dupont, 3M, Capital One, Levi Strauss, Macy’s … I could walk you through a litany of disasters whose margins are compressing … and again, $DFS management guided to ZERO loan growth in the face of rising provision expenses and increased operating expenses … it’s literally the definition of MARGIN COMPRESSION.
Earlier this month, the WORLD’S LARGEST manufacturer of memory chips and smartphones, Samsung, reported an 35% drop in operating profit YoY, from 2022 to 2023; providing sluggish guidance for 2024, while LG electronics also sees a decline ahead in 2024. Margins are compressing just about everywhere you look, and anyone who has ever run a business knows that when margins compress, expenses need to be cut!
Which brings us to, “accelerated layoffs” and the 3rd question we asked you to ponder above re: $DFS, that being:
“With earnings DOWN 59% YoY, delinquencies rising alongside expenses, do you really believe that $DFS has the ability to employ the same number of employees they currently do?!”
It’s the same question we’d ask executives at the countless companies whose earnings have been drastically reduced Year over Year … and we know what the answer will be given how the reflexive loop cycle works as both Steiner stated, and I described in our 1Q2023 note.
It should be becoming clearer by the day to anyone except for those who focus solely on headline labor data, which has yet to catch up (FOR A REASON)! First temp hours get cut, then overtime hours, finally headcount!
In the last few weeks alone, $C (Citigroup) just announced they would be laying off 20,000 employees. $W (Wayfair) is cutting 19% of their corporate workforce, with the CEO telling remaining employees to “work longer hours” (which just screams morale builder to us) … hey, time to work longer hours and do the work of 3 people or you’re next?! Is that how it goes?
$M (Macy’s) stated is cutting 13% of their corporate staff, redirecting funds to “improve the customer experience”.
Per Reuters:
“Macy’s incoming CEO Tony Spring is also focused on cutting expenses on promotions to boost margins as the company recovers from an inventory glut in 2022” (emphasis ours)
I’m just spit balling here but “cutting expenses” “to boost margins” as you “recover from (insert problem here)” means said margins have been and currently are COMPRESSED?!
We could do this for a while; Levi Strauss is cutting as much as 15% of corporate jobs, as they implement a restructuring plan which includes charges north of $120mm; $GOOGL just announced more layoffs in their “advertising sales, hardware and central engineering” departments while $AMZN’s twitch is cutting 35% of its workforce. Blackrock will be laying off 600 employees from their ESG division, while GM, NBC News and Sports Illustrated round out this week’s layoff announcements … which are clearly accelerating! Just don’t tell the:
Headline Labor Data…
Which admittedly remains “benign” on the surface.
Earlier this month, December’s ADP Employment Report came in at +164k vs. +101k, with “manufacturing”, seeing the largest contraction; regular readers may recall we’ve been noting the weakness in manufacturing data which suggests with high likelihood the sector is already in a recession, while “services” picked up the majority of the gains.
Weekly Jobless Claims slowed to +202k vs. +220k WoW as December Non-Farm Payrolls accelerated to +216k … put it all together and it’s about as clear as mud, right?! But as we’ve noted many times in the past, the underlying data is always more telling, which is why we look at it all.
It should surprise no one that not all jobs are created equal … as it relates to what has a greater impact on the economy, there is a massive difference between full-time and part-time employment! Full-time jobs are ‘typically’ a much more stable, higher quality position … from pay to retirement plan choices, including benefits on down the list! Part-time employees, most frequently work for less pay, receiving limited to no benefits at all.
So, it should be alarming to everyone that per the BLS data from December, “full-time employment” literally imploded, cratering by -1.531 MILLION jobs, as “multiple job holders” (those holding more than one part-time position) skyrocketed; with “government hiring” remaining elevated!
TRANSLATED: the economy is losing the driving force of the economy (full-time jobs) at a pace seen only twice before … for historical reference that would be in 1994, a period known as the Great Bond Massacre and in 2020 (Covid’s massive decline of -14.7mm positions).
Talk about a train wreck?!
Making matters more concerning, the Household survey came in down -683k; creating a MASSIVE DISCONNECT of nearly 900k jobs between NFP and the Household survey (which is usually MUCH more accurate)! You can read the BLS’s technical note here for a very high-level understanding of the difference between the two reports:
“The household survey has no duplication of individuals because individuals are counted only once, even if they hold more than one job. In the establishment survey, employees working at more than one job and thus appearing on more than one payroll are counted separately for each appearance.”
While the December Services ISM report saw the employment component collapsing -7.4% MoM to an eye watering low of 43.3! Which was the largest Month over Month decline since June of 2020 which placed us squarely in the heart of the Covid collapse and its lowest level since July 2020 (seen below).
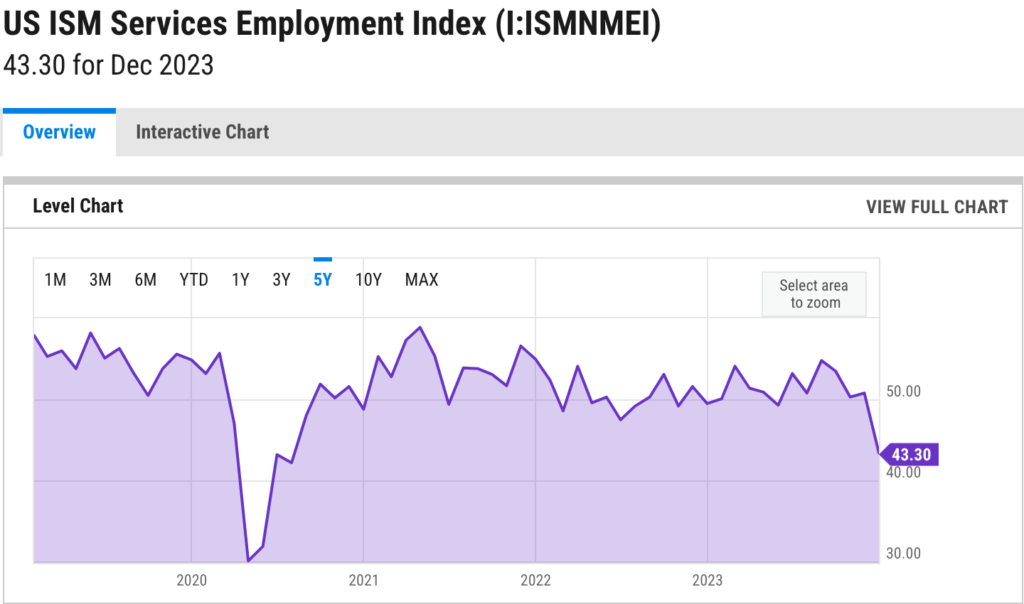
“There have only been two periods in the past 25-year timeframes when the ISM Services employment number has been as low as it was reported to be on Friday: Fall 2008 and April 2020!” @HedgeyeFIG ~Josh Steiner, Hedgeye Financials Sector Head and Macro team member … January 8th, 2024
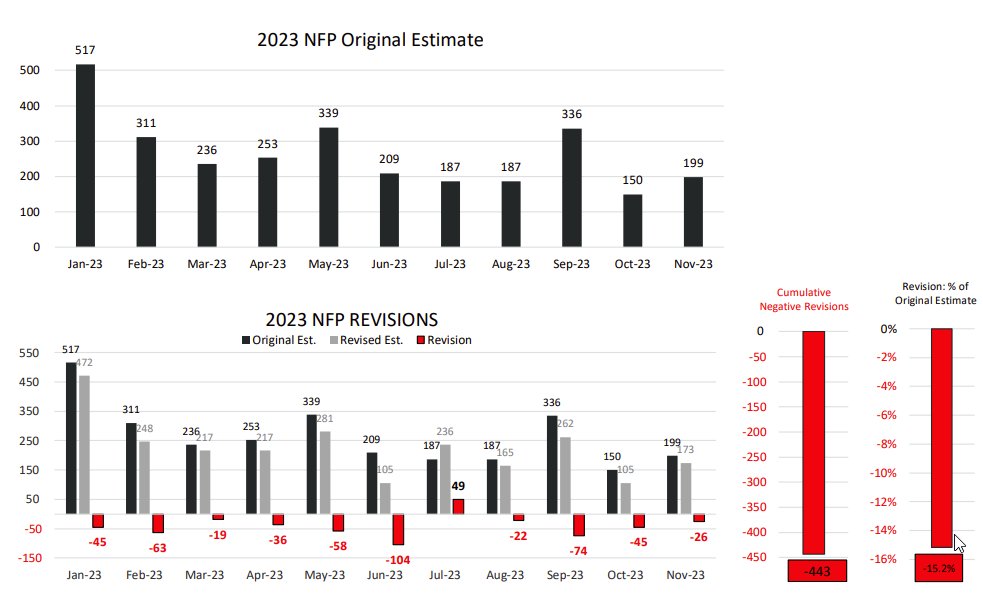
Yet we’re to believe the NFP headline data (which were negatively revised 11 out of 12 months in 2023) and that the economy is in great shape?! Right, got it!
While we wrote about recession in early 2023 … the government, without question masked it via deficit spending to the tune of trillions. This may very well may have delayed recession, but we’d continue to argue that it won’t avoid it.
As noted above (and for months now), along with artificially propping up the economy via deficit spending, lying about a strong consumer, they’ve also been printing jobs as government hiring has outpaced anything private sector related as it has for nearly a year now … all fueled via borrowing trillions of dollars with interest rates at multi-decade highs; government spending contributed over 1/3 to 2023 GDP while running over a $1.7 trillion dollar deficit in 2023.
That being said, we were wrong … manipulation or not, wrong is wrong! Though, the current environment in Washington, we have trouble foreseeing government spending comping last year’s comps.
They LIE
Before moving on, I want to circle back on the theme from last month’s section titled D.I.S.C.O.N.N.E.C.T where we discussed Wall Street begging for rate cuts vs. the reality of what the Fed actually said; we wrote:
I want to repeat that for you again … the Fed is seeing the “possibility” of 3 rate cuts in the back half of the year (assuming inflation reaches their 2% target), yet markets are telling the Fed that they’re cutting rates 7 to 9 times (between 175 and 225 basis-points) with the first cut coming as early as MARCH!
As we closed out December, Wall Street had placed a 97% probability on the Federal Reserve cutting rates as early as March … which has precipitously collapsed to roughly 44% at last glance. While Wall Street may be able to bully the tape in the many ways they do, they can’t fudge all the numbers all of the time. We know from earlier CPI reports that came in “better or lighter than expected” on obnoxiously skewed drops in “health care costs”, that those in a position of power will try anything to make things look better than they actually are, that being said, it’s difficult for them to try the same shenanigans month in and month out.
So, while much of Wall Street had been calling for those rate cuts, we’ve been pounding the table on higher inflation rates (thus, a higher Fed Funds rate) for longer. So, when this month’s sticky inflation report hit “hotter than expected”, with Headline CPI accelerating +0.3% MoM bouncing from +3.1% YoY in November to +3.4% YoY in December and Core CPI accelerating +0.3% MoM as well; with CPI services ex-Housing also ramping to +4.2 YoY, our only surprise was they didn’t try to hide the ramp.
This, when coupled with the headline employment data quickly took rate cut expectations lower, and if you thought inflation was dead, OIL RECENTLY ACCELERATED BY OVER 10% MOM on news of this current administrations next war! Ok – simple math … with oil being roughly 7% of the CPI data, a 10% move would contribute nearly 70 basis points of acceleration (yes, we know it’s a more complex, but it gets the point across).
This data will flow through into the CPI data much more quickly than the 100% MoM increase in shipping rates (which typically lags a good 8 months), but it’s just one more pressure to consider for the U.S. Consumer who’s struggling.
Wall street begs for cuts because their models NEED cuts!
A perfect example of this would be $JPM (JP Morgan) and their 2024 forward guidance, which INCLUDES 6 FED FUNDS RATE CUTS … SIX! Meaning their guidance is near useless if we get anything less, i.e. their narrative collapses!
Above we told you that $DFS saw YoY earnings collapse by 59%; Whirlpool just cut their 2024 Free cash flow guidance from $888.3 million to between $550 and $650 million. That’s nearly a 40% cut at the low end. Per Hedgeye Tech sector head Felix Wang just this morning, $AAPL saw a 34% decline in activations in China in the month of January alone! 34% and China is a significant portion of their business…
And still, Wall Street elites along with the current administration want you to believe the consumer is fine?!
As the narrative du jour collapses at a faster pace, the lying increases! It’s happened during every major market drawdown we’ve experienced in our near 3 decades in this industry.
Anyone remember:
- Every major Wall Street firm changing their “valuation” models in the late 1990’s to early 2000, claiming “this time is different” (just before the tech bubble crushed the masses
- Sub-prime is contained (2007-2008), Lehman Brothers is financially strong (I could go on for hours)
- There were no issues in Repo markets in September 2019, everything was just fine, until you saw the fastest market drawdown since Black Monday.
The thing with data is, in many cases, the government lies can be mathematically quantified, which is what the collective of data under the surface of the headlines is screaming! One of the more glaring examples of this can be seen in the most recent GDP report.
In the past we’ve noted GDP to equal C + I + G + (Exports – Imports) … that being private consumption + gross private investment + government investment + government spending + (exports – imports)!
This is Nominal GDP; however REAL GDP adjusts the nominal level of prices for inflation by subtracting the “Deflator” … which is tied to inflation data.
So, when the most recent headline GDP data came in at +3.3% QoQ and +3.1% YoY, which was a +20-basis point acceleration. If you only read headlines, and don’t understand the mechanics of how you’re being lied to by the Federal Government, it’s easy to say that we’re “wrong” again … you MORONS!
If we take a step back and slow down, rather than knee jerk react to an immediate headline number without context; and yes, this most recent headline GDP print was better than we were anticipating, our knee jerk reaction wasn’t, “look at how great the economy is” … but more so, “how’d they do it?!” How did they lie with statistics in order to get this print (as we discussed back in August in regard to labor)?! WHICH DIDN’T TAKE LONG TO FIGURE OUT since there aren’t all that many moving parts to the calculation…
We’ve said it before, when it comes to data, we don’t believe there to be any better firm out there than @Hedgeye, so, since they broke the paywall with this statement we’ll just let @KeithMcCullough explain it in his own words:
“In the most recent report, the U.S. government understates the GDP Deflator by almost 200 basis points to goose headline GDP, eh!
Embedded in the headline +3.1% Y/Y US GDP report was a +2.6% plug for inflation. Headline CPI was +3.4% Y/Y in December (+3.24% Y/Y for 4Q) while Core CPI was +3.99% Y/Y in 4Q = 54% higher than the implicit GDP Deflator. And, of course, to report “Real” GDP, you subtract the Deflator from nominal GDP.
Nothing to see here.”
This isn’t the first time the government has pulled the “deflator” card to skew numbers … for some historical context, per Hedgeye Financial sector head Josh Steiner:
“When comparing the change in CPI vs. the change in the GDP deflator; if the deflator had been in line with the CPI numbers over its long, historical trend the number printed would have been a full point and a quarter LOWER (speaking to what was the GDP print).” The Call @HedgeyeFIG 1/29/24
Often times, images speak louder than words; see below:
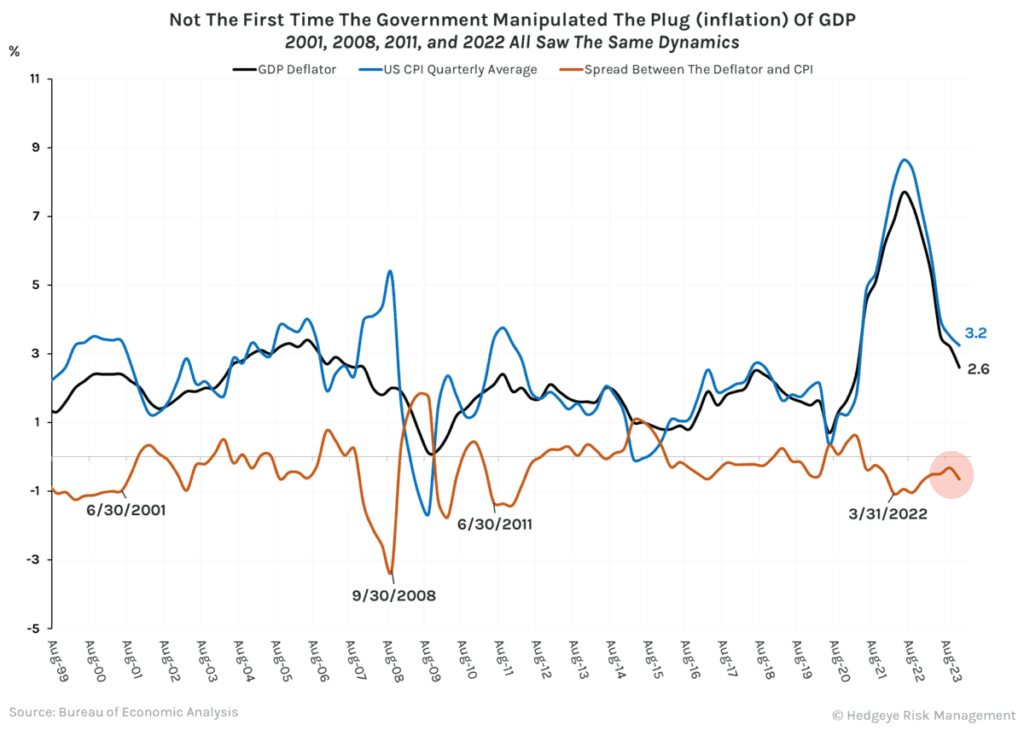
For those with short memories, 6/30/2001, 9/30/2008. 6/30/2011 and 3/31/2022 were NOT dates you’d like to be a party to or have anything in common with…
January’s data has been deplorable, and while we could rattle off the negative data sets for a much longer period of time than most attention spans would allow; just be mindful that every single manufacturing Fed regional survey decelerated meaningfully from December to January.
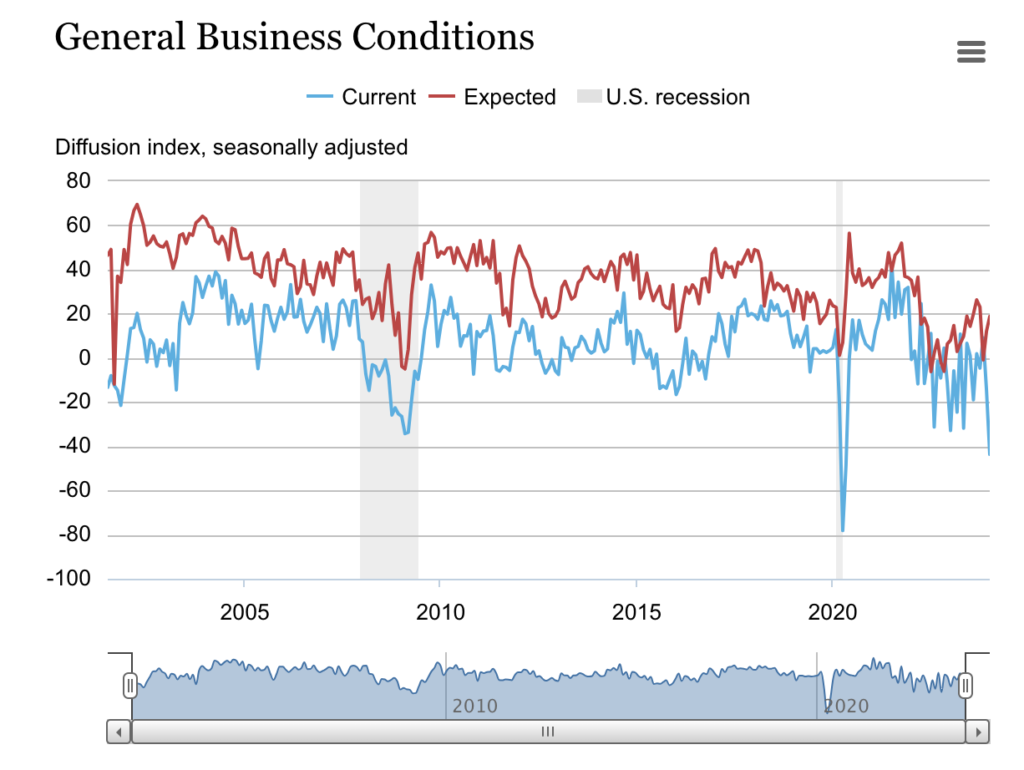
The Dallas Fed Survey collapsed while the Empire manufacturing survey from earlier this month damn near fell off a cliff (Image courtesy @KeithMcCullough 1/29/2024)
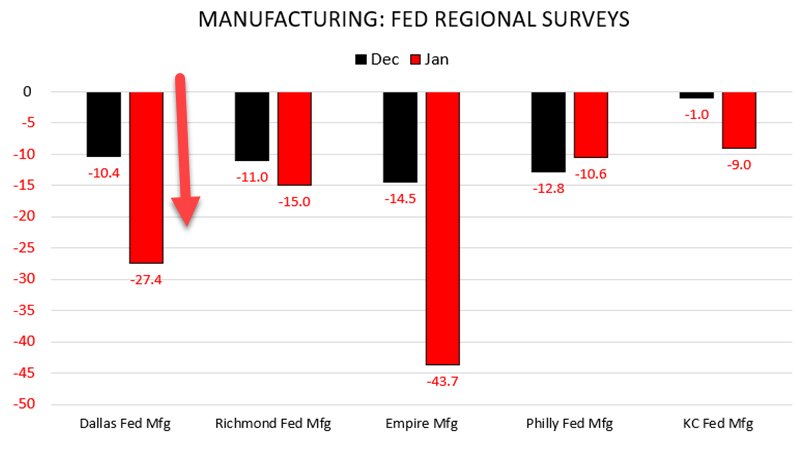
With the headline general business conditions index falling twenty-nine points to -43.7, it registered its LOWEST READING SINCE MAY of 2020, again, when the governments around the globe shut down the world! (source: New York Fed)
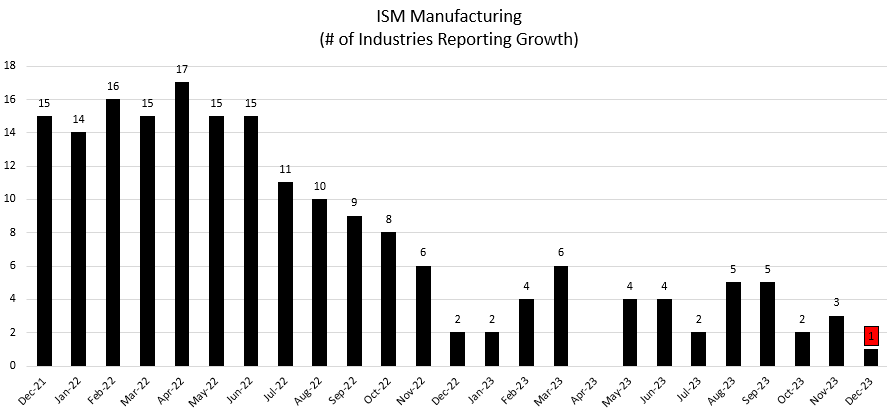
We mentioned the massive deceleration in the employment component from the ISM data earlier this month, though, more importantly, as we’ve been saying, “manufacturing is likely already in a recession” there was a SINGLE industry that reported growth in the most recent ISM report, ONE! Image courtesy @HedgeyeUSA 1/3/24
Final thoughts
We could go on and on citing the most recent leading indicators data, like semiconductor sales out of Taiwan falling off a cliff, with Taiwan December Export Orders coming in -16% vs. +1% MoM, the data (think Samsung as discussed earlier). Outside of housing, which has some very unique dynamics) the data continues to be an absolute trainwreck.
The bottom line, as banks pull back on lending, restricting access to credit … consumption will slow, margins will squeeze, layoffs will be announced, credit delinquencies will continue to rise which will further restrict the consumers access to credit, accelerating the pace at which consumption slows, margins are squeezed cost cutting efforts are accelerated … perpetuating this cycle until it cracks!
All while costs are rising again, oil, shipping rates, housing prices, etc. which will all flow through to CPI on a different lead/lag schedule. So, just because we may see a downtick in CPI due to base affects, doesn’t mean we won’t see them re-accelerate into the back half of the year. Furthermore, without any foul play, we don’t foresee the CPI anywhere close to the Federal Reserve’s 2% target; high 2’s into the low 3’s should remain for the foreseeable future, though lead/lags will play a factor.
That being said, if the FOMC (Federal Reserve Open Market Committee) is cutting rates come March, April, or May, they are doing so NOT because the economy is strong, they are doing so because we are already knee deep into a recession, which is NOT and never has been a positive for equity markets.
With this in mind, while in final formatting, the FOMC just released their most recent statement:
“The Committee (FOMC) does not expect it will be appropriate to reduce the (Fed Funds) target range until it has gained greater confidence that inflation is moving sustainably towards 2 percent.”
That 97% chance of a rate cut that got slashed to 44% just went buh-bye!
We’ll add one final thought as we conclude. Remember the BTFP (Bank Term Funding Program) … per the Treasury department as of 1/31/2024:
“Fed communications indicate that the Bank Term Funding Program will be allowed to expire after March 11th. The facility allows banks to fund the par value of Treasury and mortgage-backed securities for up to a one-year term. Banks are funding $161 billion of collateral with the program.”
As we noted last month, just as the banks are using the facility even more, the program will cease to exist … what could possibly go wrong?!
Ironically, large bank balance sheets are beginning to hoard cash as deposits have begun to flow back to them over the last 5 weeks, while smaller/mid-sized companies are looking more desperate. Remind us who holds the vast majority of CRE loans out there?! Trouble is brewing in the financial space, AGAIN and quickly!
We’re literally watching a trainwreck unfold right before our eyes, but people are too distracted by (insert reason here … be it bullsh*t marketing headlines, staring at their iPhones, political bias) that they can’t quite see it yet; either that or they don’t want to see it?! We strongly advise you, if you haven’t already done so, pick your heads up out of your smart devices and take a serious inventory of what’s really going on around you.
You may not like everything you find, but you’ll be much wiser for doing so, and likely meet/converse with some really great people along the way who have taken the time to do the same.
Sincerely,

Mitchel C. Krause
Managing Principal & CCO
Please click here for all disclosures.

