
In This Article


“The war on inflation is over. We won, at very little cost.” economist @PaulKrugman
A crumbling narrative
Our opening quote comes from “Nobel laureate”, “Distinguished” Professor of Economics at the Graduate Center of the City University of New York, Op-Ed columnist for @nytopinion, Author + more … just ask him, I’m sure he’ll tell you … Paul Krugman in a tweet from October 12th, 2023.
He attached these words to the below chart showing … “CPI EX – FOOD, ENERGY, SHELTER and USED CARS.”
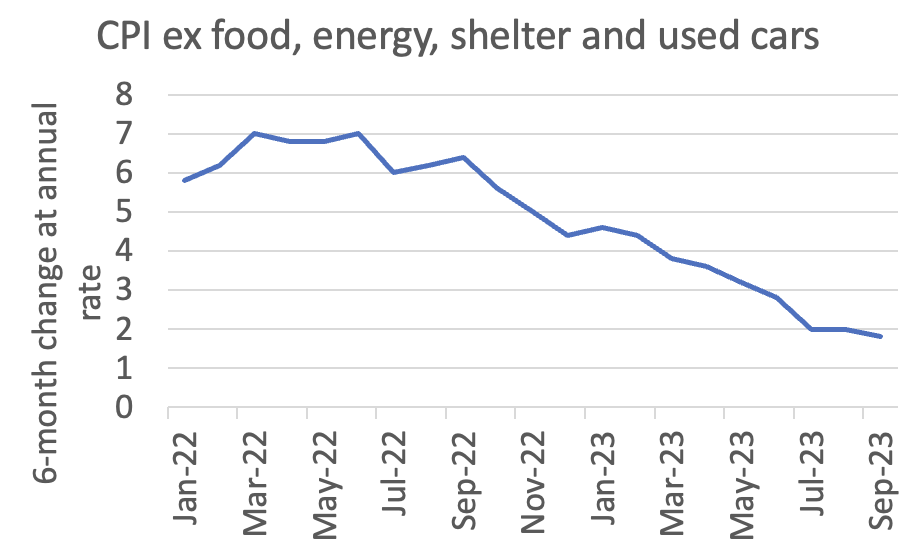
Please, take a brief moment and think about that statement for a moment. The mouthpiece economist for the “elites” of our society just wanted the plebians to know that the brilliant world of academia and their steadfast policy stance, which can only be attributed to a superior intellect, have slayed the beast that is inflation … “VICTORY IS OURS,” they trumpet … “at very little cost,” no less!
So long as you exclude most everything American’s need DAILY TO LIVE!
Best not worry, the live cattle, feeder cattle and sugar prices up nearly 20%, 33%, 50% YoY (Year over Year), respectively, will have no bearing on your food costs, (“at home” or “away”), nor would the YoY increase of 86%, 59% and 18% in the price of Orange Juice, Cocoa, or Rubber, respectively impact daily living in any way shape or form … moreover, I can’t think of anyone whose day to day activities could be hampered by the 36% increase in oil from July (palm meet forehead)!
Fear not, I’m certain I glossed over a footnote in Krugman’s analysis where he assures us that we can, in fact EAT his CPI data exclusions; his numbers are equally as nutritious as that steak one would love to put on their dinner plates this evening but can’t. I’m sorry I’m not sorry if you sense a little more snark and sarcasm within today’s note … though, our society is riddled with smug “experts” who are constantly wrong yet remain in the spotlight, most frequently misleading, misrepresenting or outright lying to the American people.
While some humans may choose to eat bugs, the vast majority of Americans would prefer a steak, they drink orange juice, bake with sugar, or make chocolate milk or chocolate chip cookies. They also fill their cars with gas to travel to work and many chauffer their kids around from activity to activity on rubber tires that need to be replaced after a certain number of miles driven.
So, while energy (being one of the larger CPI inputs) has been marching higher since July (as can be seen through the lens of oil, diesel fuel &natural gas to name a few) … they’re not the only commodities to do so.
Look, we’re well aware that inflation, by measure of CPI has fallen; with the help of Hedgeye, we’ve literally mapped out both the acceleration and deceleration in inflation (well before it’s happened as can be read in our previous notes dating back years now), while Wall Street, Federal Reserve officials and linear econs like Krugman screamed “no inflation” only to flip to the infamous “transitory” when their “no inflation” narrative was too massively wrong to ignore; they then completely missed the deceleration by months, raising rates are the worst possible time.
The only thing they’ve been consistent with, is being unapologetically bullish last year as the majority of investors got crushed … as well as being wrong with everything from the directionality of the data to earnings growth estimates which continue to be too high, to the strength of the consumer, and on!
We’ve done our best to educate readers that markets are NOT linear, they aren’t about the “average of things”, they are discounting mechanisms, measuring, and mapping the rate of change accelerations and decelerations in all global economic data.
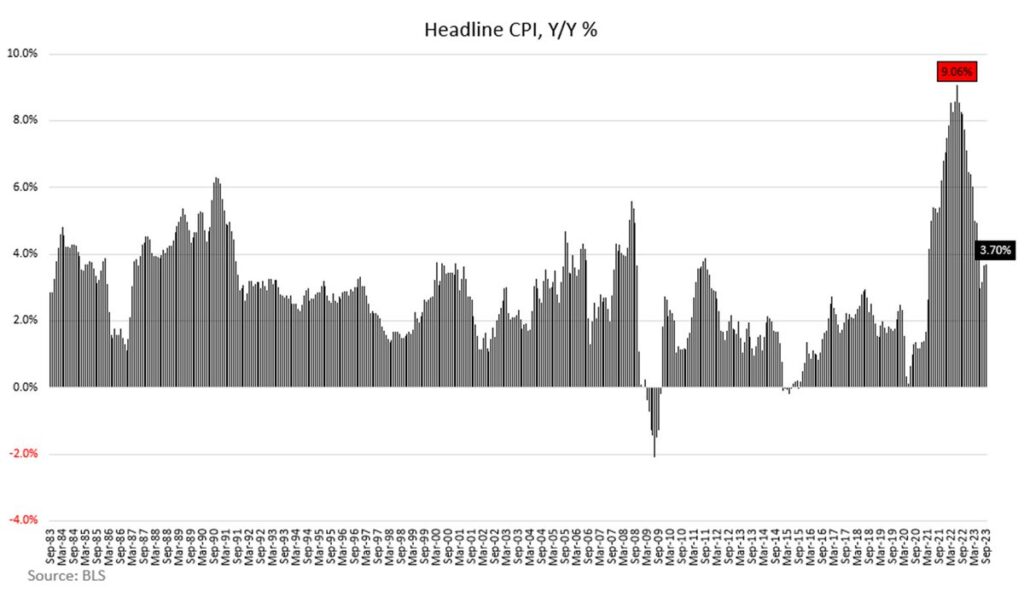
Which is why our readers were prepared, while bond investors and Wall Street’s traditional 60/40 portfolio holders prepare for yet another nasty drawdown as inflation has now re-accelerated for the 3rd sequential month with the most recent headline CPI data accelerating to +3.7% YoY vs. 3.2% YoY: up 50 basis points MoM as ENERGY (gasoline) provided the largest tailwind coming in at up +3.3% MoM.
If only the Rate of Change accelerations in inflation data stopped there … but it hasn’t!
Headline PPI for September came in at +2.2% YoY, an acceleration vs. August’s upwardly revised +2.0% YoY print, reaching its highest since April! Core PPI accelerated as well, to up +2.7% YoY, vs +2.2% in August.
And given the current global macro & geo-political environments as well as supply/demand constraints, we would anticipate oil to remain elevated which should continue to push PPI higher against easing comps.
More importantly, October’s University of Michigan 1-year inflation expectation accelerated to 3.8% vs. 3.2%, while the 5-year rose to 3.0% vs. 2.8%.
So, when someone like Federal Reserve Chairman Jay Powell has the audacity to suggest in front of the world that the massive run up in treasury yields isn’t large in part because of inflation expectations or credit risk based on the massive borrowing as he did last month … someone with more clout than us (say the financial media) who is allowed to ask him questions, should be calling B.S. … and since they’re not we’re going to … as we did last month when we wrote:
This dynamic is WITHOUT QUESTION, feeding the massive move higher in inflation expectations, which is in turn, creating a tailwind for rates and the U.S. dollar, contrary to what Herr Powell said in his most recent press conference:
“… rates have moved up significantly. I think it’s always hard to say precisely, but most people do a common decomposition of the increase, and the view will be it’s not mostly about inflation expectations. It’s mostly about other things, you know, either term premium or real yields, and it’s hard to be precise about this. Of course, everyone’s got models that will give you a very precise answer, but they give you different answers. But essentially, they’re moving up. It’s not because of inflation.”
Sure, 10-yr Treasury yields have rocketed higher over the course of a few weeks from a 4.05% to 4.61% because of “term premium or real yields” not because of inflation expectations?!
As the walls of their narrative come crumbling down with each passing data point, the lies just keep getting more glaring.
Circling back to Krugman for a moment, this is the same Paul Krugman who said, “by 2005 or so, it will become clear that the internet’s impact on the economy has been no greater than the fax machine’s”!As a New York Times opinion writer, he attempted to minimize those statements suggesting it was, “in a throwaway piece I wrote for the magazine – The Red Herring”
He then shamelessly pens a fairly recent Op-Ed passive aggressively noting, while “this shouldn’t be about me,” then in the same breath makes it about him, stating that he’s admitted to being wrong about his internet comment (from 25 years ago), then proceeds to cite labor productivity growth data produced by the BLS (among other things) to suggest that he and other skeptics were probably, right?! (the hubris is mind numbing)
This is the same BLS we called B.S on a few months ago given how poorly they mislead, “lying with statistics” via, among other things, the Birth/Death guest-a-mates in their labor data which drives countless revisions.
We freely admit that we get things wrong and have openly discussed some challenges we faced trading these markets earlier this year given the ungodly sums of deficit spending courtesy of the federal government in 1Q2023 & 2Q2023; we own our mistakes and move forward. That being said, we fared significantly better than most last year, largely avoiding the massive draw downs and have NOT been wrong in educating readers via the data that inflation would remain sticky and the Fed would have to be “higher for longer”.
If only it were Krugman and Powell providing the misdirection … but it’s not; misleading the general public has recently become an uncontested sport, with very few attempting to hold these people to account.
Last month we held Janet Yellen’s feet to the fire as she was flat out lying in this very recent interview on @CNBC (9/24/23) again, as she stated:
“we still have a good healthy labor market, consumer spending remains quite robust, we’ve seen strong industrial production … I don’t see any signs that the economy is at risk of a downturn. And this is the best of all worlds … to see continued strength in the economy, a good strong labor markets and inflation moving down and that is what we’re seeing.”
We then proceeded to show the data supporting our statements (which can be read here) vs. her cavalier, “trust me” arrogance.
In July, Chicago Fed president and the newest voting member of the FOMC, Austin Goolsebee stated that the economy was on a “golden path” to bring inflation down without a recession.
He followed up a few weeks ago giving all BUT the guarantee:
“There’s a growing confidence that we can pull it off. The only thing I want to caution you is, that’s not a guarantee.”
Fed President Christopher Waller recently stated:
“We’re finally getting very good inflation data … If this continues, we’re pretty much back to our target.”
Going so far as to suggest the rise in bond yields may be signaling that, “the economy is looking better?!” citing no data, just the level of the 10-year treasury.
July 23, 2020, CNBC ran with the headline:
“Here’s why economists don’t expect trillions of dollars in economic stimulus to create inflation.”
How’d that work out for them?!
I want readers to pay close attention as these perpetual optimist/bulls will be the very same “professionals” and “experts” (coupled with Wall Street sell side analysts and economist) that will be called upon in the aftermath of the next massive market meltdown/credit event which has been brewing; brutally visible in the collection of data we’ve been citing for nearly 2 years now that will look you in the eye and defiantly state that, “no one could have seen this coming!”
They are unelected and installed … they are the ones who drive the narratives!
We don’t do narratives, we do data … and we continue to see the Ouroboros thesis we wrote about in our 1Q2023 note play out in real time. As a quick reminder, the genesis which sparked our thoughts came courtesy of Hedgeye’s Josh Steiner when he stated the below on April 6th’s “The Call”:
“Bank lending conditions are causal and reflexive, and they feed forward on themselves … so as they tighten conditions, economic activity slows … slowing economic activity drives non-performing rates (both consumer and commercial) higher … that causes banks to further tighten and contract activity and so on and so forth… UNTIL … you get the circuit breaker, which is the Central Bank, doing a full 180.” ~ Josh Steiner
So, about that bank lending…
We’ve been discussing the slowdown in credit for nearly a year through the lens of the Federal Reserve’s weekly H-8 data. Over that time frame it’s shown a significant deterioration with this month being no different. When I began writing earlier this month, from a rate of change perspective, we would categorize the sequential three-month trending deceleration in lending as “stark”:
From August to September to October we’ve seen meaningful slowdowns in lending in every category (Data aggregated by Hedgeye’s Josh Steiner):
- Total lending decelerated sequentially from: +5% > +4% > +3.5%
- CNI lending decelerated sequentially from: +1.2% > +0.7% > 0.0%
- CRE lending decelerated sequentially from: +8.0% > +7.1% > +6.5%
- Consumer credit cards decelerated sequentially from: +11.3% > +10.9% > +10.4%
- Auto Lending decelerated sequentially from: -2.1% > -2.2% > -3.6%
And yet with each passing week, they continue to weaken … again, ACROSS ALL LENDING CATAGORIES, most recently:
- Total lending is down +3.7% YoY vs. +4.2% from ~4 weeks ago.
- CNI lending decelerated to negative -0.1% vs. +0.4% over the same duration.
- CRE lending decelerated +6.3% vs. +7.0%
- CC lending decelerated to +10.3% vs. +10.8%
- While Auto loans are outright negative; down -3.7% YoY
This as deposits continue to contract on a YoY basis … again, ACROSS THE MAJORITY OF LENDING INSTITUTIONS (from big to small)!
There’s a very specific reason we highlighted the above Josh Steiner quote from over 6 months ago … that being how the deceleration in the extension of credit flows through to the economy (i.e., the real world)!
We wrote an entire piece around the concept of the following sentence from Steiner:
“so, as they tighten conditions, economic activity slows … slowing economic activity drives non-performing rates (both consumer and commercial) higher … that causes banks to further tighten and contract activity and so on and so forth…” @HedgeyeFIG … Josh Steiner … 4.6.23
So, how are things flowing through to non-performing assets in the most recent earnings reports?!
As “experts” have attempted to call the “all clear” following $JPM’s “better than expected” earnings earlier in the month, the most important trend in data in our opinion is the one we’ve been discussing for well over a year now … it’s the hockey stick spike in “non-performing” assets across the entire banking industry (INCLUDING $JPM).
30+ day delinquency rates on credit cards at $JPM have accelerated a massive71 bps YoY as 3Q2022 non-performers sat at 123 bps vs. their now, current level of 194bps; also an acceleration from up 65bps YoY in 2Q2023.
$BAC’s (Bank of America) most recent earnings release echoed that of $JPM, especially in relation to Credit delinquencies on a 30+ day basis, hitting 2.1% vs. 1.4% … a 50% YoY increase! This with credit card spending volume down sequentially (up 1.4% YoY 2Q2023 vs. +0.7% YoY in 3Q2023)
Admittedly, $BAC did see an acceleration in “Debit card spending” from +3.3% to +5.0% … though an important highlight from Hedgeye Financial Sector Head Josh Steiner on this:
“What’s interesting though, is that debit spend tends to strongly correlate with staples, whereas credit card spending has a much stronger correlation with discretionary.” Josh Steiner, the Call 10/17/23 minute 22:57
This continues to support what we’ve been reporting in the data that the consumer is getting squeezed and what little money they have left is going towards reducing their discretionary spending. We cited this well over a year ago noting the high-end spender trading down to shop in stores like $WMT & $TGT.
At the same time, remember the industry trend: loan growth of +1.6% YoY with deposit growth DOWN -2.7% YoY. This trend has become the industry norm and it’s not a good one!
Interest rates are at levels greater than where they were in March which sparked the run-on regional banks, which resulted in regulators closing the doors of multiple, sizable institutions. As such, in their most recent earnings release, $BAC disclosed losses in their bond portfolio of $131.6 billion, up from $105.8 billion QoQ (24%) … and quite possibly a challenge for their tangible equity! Should depositors just say no to near zero interest rates, when short term treasuries and treasury backed money markets are paying north of 5% with daily liquidity?!
Yes, their bond portfolio is much greater in size ($760 billion), also yes, many of these securities are HTM (Held to Maturity) and not counted against regulatory capital or earnings, but the risk still exists depositors get impatient.
And let’s not forget that the Federal Reserve’s BTFP (Bank Term Funding Program) is a LOAN … “up to one year in length.” LOANS are NOT bullish for earnings, interest rates at these levels are NOT conducive to maintaining traditional bank deposits … and this is the second largest financial institution in the country whose CEO, Brian Moynihan has just gone on record saying the consumer is slowing! Talk about showing up to the party “fashionably late”, Brian, thanks for coming out.
Seriously, stop and THINK … just ask yourself a simple question. If you’re a bank, and your bond portfolio is taking on water faster than the Titanic, with deposits fleeing … do you proceed to extend loans hand over fist to a crippled consumer or do you pull back on lending?! (you know what the answer is, and it’s the crux behind the Ouroboros – reflexive loop theory we wrote about)
This trend doesn’t rest solely with the bellwether financial firms, either…
$DFS (Discover financial) reported earnings of $2.59 vs. Wall Street estimates of $3.17; a 27% YoY deceleration vs. their 3Q2022 reported earnings of $3.56.
The driving force behind the loss … one guess … (Did you guess credit quality?!) Their provision from credit losses increased by $930 million dollars to $1.7 billion vs. $770 million the prior year. Of the $930 million increase, $300mm is a reserve build vs. $630mm net charge off INCREASE!
Discover’s “positive” driver of the business was driven by a 17% YoY increase in loan growth.
Again, please stop and think about this for just a minute. As we wrote last quarter, the positive driver was:
“a 31% INCREASE in loan fee income flowing through to non-interest income” … which was, “DRIVEN BY LATE FEES with 30-day delinquency rate up 110bps YoY (1.76 to 2.86) … their highest level since 2011.” This comes off the heels of “aHIGHER THAN ANTICIPATED LOAN LOSS PROVISION,” all things we noted in our 2Q2023 note.
This quarter, their only positive comes from, “a 17% YoY increase in loan growth!”
With their sales network volume decelerating from up +9% YoY in 1Q2023 to up +3% YoY in 2Q2023 and now FLAT (0.00) for 3Q2023 YoY! So, what does this mean?! Decelerating network volume with accelerating loan growth means $DFS is literally handing more money to borrowers who are failing to pay down their balances (too much leverage + obnoxiously high rates = non-performers (see: Steiner quote from Ouroboros).
Consumers are literally choking on debt and the only source of earnings power for many of these credit issuers, including $DFS is to increase their unsecured revolving loans in the face of accelerating charge offs which are now touching levels not seen since exiting the GFC (Great Financial Crisis)?! Yes, seriously, we couldn’t make this stuff up if we tried.
We’re literally at the point in the cycle where countless borrowers are getting in too deep with a loan shark?! … with retail credit cards hitting a record high of 28.93% average APR, is there much of a difference?!
Credit card delinquencies at $DFS saw significant rise 3.4% vs. 2.1% YoY: a 62% increase! For reference, delinquencies were at 2.5% September of 2019.
If you can’t see credit quality deteriorating at an accelerated pace, you’re simply not looking … if Americans don’t have money to pay their loans off now, what do you think happens now that student loan payments have resumed?!
And if you thought the brewing trouble was isolated to the lower income/weaker consumer, we’d present $AXP (American Express) who purported what appeared to be relatively “strong earnings” of $3.30 vs. expectations of $2.95; with revenue “in-line” … though, when taking a deeper dive, they achieved these marks by slashing marketing by 15% YoY, while just about every other expense line item was UP significantly! (Remember, higher expenses = squeezed margins).
Similarly, to what we saw with $DFS, loan losses exploded with write offs spiking by 133% YoY to $912mm vs. $391mm in 3Q2022, with network volume discount revenue coming in lower than anticipated as card fees, service fees and processed volume proved to be weak to very weak, respectively.
This on the heels of card member loan growth up 20% YoY … again, just like $DFS, lending to people who no longer have the money to make or keep up with their payments is most likely not be the best strategy as we head into recession … SEE: 2006/2007 heading into the GFC for reference should you have any questions as to how this ends?!
The really unnerving part of this is the $AXP clientele tends to be a more affluent one. While we’ve been witnessing a “trade down” in the consumer across the board, inflation is adversely affecting every most everyone, from the average American to the ultra-rich, which we’ve been illustrating via the purchasing of high-end watches and yachts (large in part to Hedgeye Retail Sector head Brian McGough and his team).
However, if you chose to ignore those signs, the most recent earnings report out of global luxury brand $LVMUY (LVMH Moet Hennessy) should have even the largest of the “consumer is slowing” deniers stuttering as all four of their major divisions decelerated sharply, while also missing Wall Street estimates.
The Fashion & leather goods business as well as the Perfume and cosmetic divisions were both up +9%, missing Wall Street estimates of up +11%, respectively … watches and jewelry saw an even larger miss coming in at +3% vs. street expectations of +9%, while wines & spirits saw organic sales outright negative, down -14%, also missing Wall Street’s “flat” expectation. (As a reminder, up less MoM, QoQ or YoY is a DECELERATION).
There should be zero surprise here as this is all part of the cycle that is the Ouroboros; weakness begets more weakness through a further contraction in credit … the less stable the consumer, in the face of tighter credit conditions and inflationary pressures, the less confidence they have to spend more, vacation more, go out to eat more (et. al)!
This continues to manifest in consumer confidence with October’s most recent Michigan consumer confidence report seeing the data drop like a stone, down 5.1 points MoM to 63, vs. 68.1 in September, as inflation expectations rose from 3.2% last month to 3.8% this month … yeah, you remember those inflation expectations that Fed Chairman Powell said weren’t a contributing factor to the rise in treasury yields?!
Additionally, Consumer Expectations were down -8.0% MoM, the Consumer Sentiment Index fell -7.4% MoM, and current economic conditions decelerated -6.6% MoM, as well!
Again, these elites are full of **it … and it’s one thing with someone like us calling them out, but when the bond market does, ignoring their lies as yields follow the data, we could be in for a world of hurt?!
If the above data plus flow through examples aren’t convincing enough for you, then I owe you an apology for I’m doing something wrong! Steiner’s quote influenced an entire note, and 6 months later the data continues to support the thesis.
Elites like Powell, Yellen, Krugman, Goolsbee and their ilk continue to preach a narrative that crumbles with every passing data point … and yet, the financial media actively works to protect them instead of YOU! It’ simply not right.
Speaking of data points
“The LEI for the US fell again in September, marking a year and a half of consecutive monthly declines since April 2022.”
The LEI of Conference Board Leading Economic Index “provides an early indication of significant turning points in the business cycle and where the economy is heading in the near term”
And is now down 7.8% YoY: declining by 0.7% in September to 104.6, following a decline of 0.5% in August!
Of the 10 components the LEI factors into their modeling, NINE were FLAT to NEGATIVE … per Justyna Zabinska-La Monica, Senior Manager, Business Cycle Indicators at The Conference Board.
“In September, negative or flat contributions from the NINE of the index’s TEN components more than offset fewer initial claims for unemployment insurance.”
While it’s NEVER just one thing, the last 3 times the LEI was at these levels, was March 2020, February 2008 and March 2001. Now, I don’t know if those dates have any significance to you, but with nearly 28 years in the seat, those timeframes were NOT kind to investors as they represent the heart of the Covid crash (2020), just prior to the Great Financial Crisis (2008), and the Technology bubble (2001).
Housing
As we’ve detailed extensively since last April, 30-year mortgage rates for the average American continue to move higher; currently they’re pushing north of 8.5%; a multi-decade high … which is another form of tightening credit and without question, has directly attributed to the most recent MBA Mortgage Purchase applications being down -6.0% WoW; down -22% YoY and down nearly -60% from the housing cycle peak as they sit at their lowest levels since 1994.
Additionally, Existing home sales for September were also down -15.4% YoY … in most areas, the housing market is operating at a snail’s pace.
Given the current rate environment, we don’t anticipate volume to pick up, and while small, on a seasonally adjusted basis, inventory has recently ticked up to a 3.3-month high; up 0.5 months from the 2.8-month supply from June.
Make no mistake, we remain at historically low levels of inventory, though as we frequently note, it’s the Rate of change that matters … and while first things happen slowly, then all at once … right now, things are escalating fairly quickly in short order!
Before we leave the topic of real estate, we’ve got to briefly mention the never-ending saga that is:
#BREIT
For those unaware, #BREIT is a publicly registered non-traded REIT, sponsored by private equity behemoth Blackstone Group who have gated shareholders redemptions since December. While they have satisfied some requests, a substantial number of shareholders have been left with zero liquidity on an asset that was sold/marketed as a liquid asset.
From the onset, we have called B.S. on the company’s “reported NAV” … for in one of the most challenging real-estate environments EVER, with countless other private REITS also gating redemptions; interest rates on ALL real-estate at multi-decade highs, and a credit environment in the midst of a massive deceleration as detailed above in the Federal Reserve’s H-8 data, it’s damn near impossible to believe what’s being said.
Real world data shows numerous commercial buildings going NO-BID, with some multi-billion-dollar properties having the keys handed back and walked away from (which we discussed here); and virtually anything that is selling, is doing so at significant discounts to previous sales or even build prices … and yet, somehow #BREITS NAV has managed to tick UP recently! (again, which we have been highly critical of)
#BREIT and their peers with the same structure can’t sell properties/assets fast enough to keep up with shareholder redemption requests … so they use legalese buried in a prospectus (which was most likely never disclosed to shareholders that this could even be done) and they claim an uptick in NAV?! B.S.
So, we recently had some mixed emotions when good friend of OSAM and REIT industry expert David Auerbach @DailyREITBeat shared a very recent report that MacKenzie Capital Management has announced a mini-tender offer to acquire shares of Blackstone Real Estate Investment Trust (#BREIT) … FOR A 38% DISCOUNT TO BREITS ESTIMATED NET ASSET VALUE; per the report:
“MacKenzie Capital Management is offering shareholders of Blackstone Real Estate Income Trust $9.27 per share, which the company says represents a 38% discount to BREIT’s estimated net asset value of $14.88 per share … MacKenzie’s offer is for as many as 1.5 million shares, or $13.9M, and expires in December.”
While emotions don’t drive our investment decisions, we do “FEEL” for people who are lied to and taken advantage of by those in a position of power/authority whom Americans should be able to “trust” … we’re not heartless! Yet, these “elites” are untouchable, protected through the years by a marketing machine driven by ungodly sums of money.
The majority of people choose to accept their real life “Truman Show” world rather than the harsh reality that to a large extent, is both orchestrated and manipulated … until those in power lose control (SEE: long end of the bond curve); this is what we mean when we’ve suggested in that past that “Gravity” wins.
In Blackstone gating redemptions, they’re attempting to hide their marks (i.e., mask the true value of their holdings in an effort to provide “cover” for their depreciating NAV) … selling a massive block of properties to satisfy redemptions for what someone else is actually willing to pay for them would not only expose this, but cannibalize NAV, perpetuating even more redemption requests (yet another reflexive loop caused by too much leverage and tightened credit conditions).
It remains to be seen how many shares will, in-fact be tendered, if any at all?! And yes, only time will tell as to whether or not a 38% discount to current NAV will either be a brilliant entrance for Mackenzie or opportunistic exit point for those shareholders who choose liquidity in the current environment?!
The few dinosaurs left in this business who have experienced multiple credit cycles up close (while sitting on an institutional trading desk) might suggest; first bid is often your best bid … as we’ve witnessed bids drop from $0.80 cents on the $1.00 to $0.50 within a 45 second phone call!
Blackstone’s management and their ilk, just like every “elitists” mentioned earlier in this piece, are watching in real time, the effects of this continued tightening of the credit cycle which is acting like a massive anaconda slowly sucking the last breaths from their “economy is fine”, “consumer is strong” narrative.
And still, they continue to do everything they can in an effort to protect their house of matchsticks (economy) built atop to a powder keg of dynamite foundation (leverage), located directly next to a forest fire which was purposely set as a controlled burn, that’s already out of control (decades of poor central bank planning)!
Again, their efforts to deceive are being exposed with each passing data point … they’re now just outright lying to buy time (most likely to re-position their books to take advantage of the devastation?!
I know, I know … sounds crazy, right?! If it weren’t the case, why did Blackstone recently raise over $30-billion dollars in April for their “Blackstone Real Estate Partners X”?! A fund specifically designed as a “global property drawdown fund,” which, per Bloomberg is designed to target, “opportunistic deals across sectors such as rental housing, hospitality and data centers.”
“Pullback with all forms of capital will create opportunities,” said Kathleen McCarthy, global co-head of Blackstone Real Estate. “We can use our capital and expertise to capitalize on the moment for our investors.”
So, in one breath, Blackstone is openly admitting that there is carnage in the global real estate markets given elevated interest rates/mortgage rates which they want to profit off of … they just want you to believe that #BREIT not only hasn’t been adversely affected by it … but they’ve benefited?! B***S***!
Labor …
The labor markets are a bit of a quagmire lately with multiple labor reports providing mixed to non-sensical signals … For example, the most recent, ADP Private Payrolls came in with its softest print in nearly 2 years at 89K vs. +177K last month with internals continuing to make little to zero sense.
Services added +81k jobs as large businesses (those with 500 employees or more) lost -83k positions.
Non-Farm Payrolls, however, surprised everyone to the upside with a literal and figurative “off the charts” statistical 6-sigma move with the number coming in at up +336k jobs! This report also shifted tone from the negative revisions we’ve seen the BLS make every month this year to now revising July up by +79k (+157k + 79k (positive revision) = +236k)and also August higher by +40k (+187k + 40k (positive revision) = +227k).
At the same time, the household survey decelerated MoM, coming in at a meager +86k jobs. So, what’s strange?!
First, a 6-sigma move is a statistical anomaly to begin with and even had the majority of “Old Wall” Wall Street calling B.S. on the number. Additionally, the Household survey is what typically LEADS the labor market at inflection points.
Moreover, the NFP data shows leisure and hospitality adding +96k jobs, with food services and drinking establishments gaining +61k jobs … the restaurant space has seen a massive deceleration in foot traffic both YoY and sequentially over the last 3 months, especially with the more recent rise in commodity prices.
The QSR (Quick Service Restaurants), which is a “service”, has seen foot traffic DOWN for 3 sequential months … per Hedgeye’s Howard Penny, “the first half of October saw a 445 basis point sequential decline” … while Open Table has shown a massive deceleration in reservations over the last 6 months.
As a general rule, most businesses don’t hire as their businesses are seeing a significant decelerations in foot traffic with revenues being held up via menu price increases (which is all one thing – a massive rise in commodity prices (an example of this would be beef prices noted above) and increased cost of capital as excess savings evaporates.
Try selling over-priced steak to a consumer hemorrhaging money as they max out consumer credit cards pushing a 28%+ APR. Yeah, no bueno!
Digging even deeper into the numbers … on a non-seasonally adjusted basis … we can see that Total Private Payrolls in September were DOWN by roughly -400k jobs while total government payrolls have INCREASED by +984k jobs!
So, now rather than the Federal Reserve printing money, the government is minting jobs?! The data just doesn’t hold any water … how did the government hire nearly 1mm workers on an unadjusted basis in a month and where are those jobs?! Who in the name of all things holy are said “jobs” going to?! Just more B.S.
Something else we’ve been detailing extensively over the last few months is the trend in the loss of full-time employed vs. the gain of part time employed; not only did the full/part-time chasm widen with full-time workers falling by another -22k jobs while part-time employment jumped again, this time by another +151k jobs … this is now the 3rd straight month in a row we’ve seen this dynamic; the last 3 times: 2001, 2008 & 2020 (Covid) … which just happens to be the exact same time frames the LEI last saw such readings (as noted above). Pro tip: things didn’t end well at any of those points in history!
In the face of it all … the unemployment rate remained FLAT MoM at 3.8%, and hourly earnings came in lower than expected at 0.2% MoM and 4.2% YoY.
All of this as numerous large firms including the UAW were out of work on strike and financial firms like $C (Citigroup) and $PNC are laying more employees off ($C another 2k employees and $PNC is reducing their workforce by 4% as they and other firms are shuttering the doors to numerous branches. If you look at the data in aggregate, the NFP report is a complete outlier to all other data the simply doesn’t corroborate.
Even more data
Before we head into our final thoughts, in an effort to keep this note at a reasonable length, we’ll attempt to summarize a few additional data points that all lead us down the same road:
Manufacturing PMI for September did accelerate slightly, from 48.9 to 49.8 … so did the ISM Manufacturing number coming in at 49.0 vs. 47.6 MoM … But again, we’d point you to the current TREND (anything below 50) remains CONTRACTIONARY.
Additionally, the Empire State Manufacturing data slowed AGAIN from +1.9 in September to negative -4.6 in October.
And while we discussed Michigan Consumer Sentiment above, we have yet to mention the September NFIB Index report which has now been below the 29 years average of 98 for over 20 consecutive weeks … we’ve highlighted this number frequently in past notes as with small business being the heartbeat of our economy, it tremendously important to understand where the mindset in regard to economic trends are among them … from the report:
- “The net percent of owners raising average selling prices increased two points to a net 29% seasonally adjusted, still a very inflationary level.
- Small business owners expecting better business conditions over the next six months deteriorated six points from August to a net negative 43% seasonally adjusted.”
Another words … more small business are bracing for deteriorating business conditions over the next 6 months as they attempt to raise prices (to make up for shrinking margins due to inflationary pressures); which equals higher prices for the end consumer (who has no more $$).
How do you think that’s going to work out for them?! How’s it working out for $MCD (McDonalds) as they continue to raise prices as their average foot traffic meaningfully decelerates?!
Think about this … McDonalds has a dollar menu with not a single product priced at a dollar anymore #inflation #reacelerating.
Final thoughts
We’re going to finish up where we started as we circle back to Krugman’s quote for a moment … For Krugman to suggest “We won, at very little cost” is one of the most callous and irresponsible lies I’ve read in a long time …
After a decent amount of pushback from the Fintwit community, Krugman came back for more, writing:
“I was too flip here. I’ve been using this particular measure for a while, so want to be consistent. But it has flaws (medical insurance too optimistic). But almost every measure now <3 percent.”
Yeah, it’s the medical insurance that’s too optimistic (sigh) … not the energy, car insurance inflation or auto repair, transportation, rent, food (both at home and away from home) or cost to repair anything homeowner related … it’s none of those things … just medical insurance (insert eyeroll here).
The consumer is literally choking on the largest sums of debt at the highest interest rate levels we’ve EVER seen; with default rates in everything credit skyrocketing.
We detailed the spike at both $JPM and $BAC above, noting the same trend at the largest unsecured revolving credit issuers in the country $AXP, $DFS, etc., as they beef provisions to levels not seen in decades.
At the same time, we’re seeing:
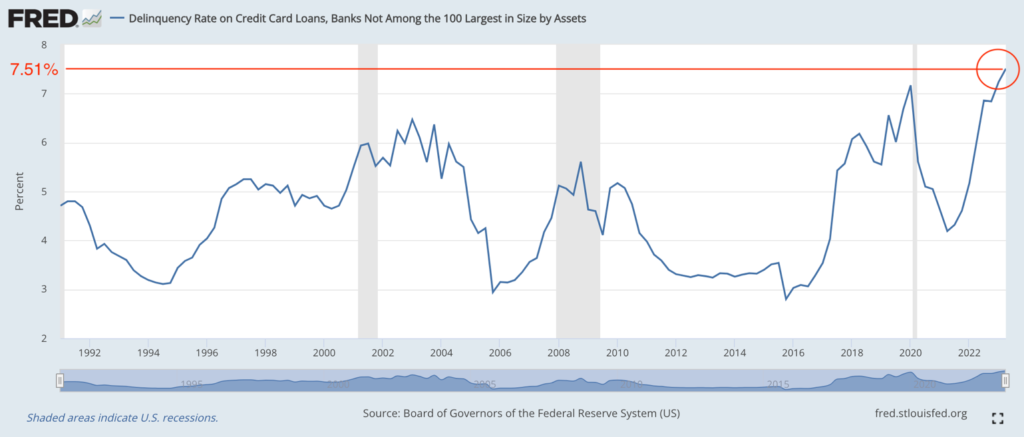
Credit Card delinquency rates at small banks have reached their highest level EVER RECORDED @ 7.51%
According to Fitch Ratings, the percentage of subprime auto borrowers at least 60 days past due on their loans jumped to 6.11% from 5.01% just three months ago. This is the highest level on RECORD going back nearly 3 DECADES.
Please, I want you to think long and hard about this for a moment. The above information was cited by Forbes, Auto News, and countless more within the past few weeks … it was FEBRUARY of 2023 when we wrote the below:
“Credit card delinquency rates are spiking across ALL major lenders; sub-prime auto loan defaults continue to hit all-time highs … as the percent of individuals earning more than $100k living paycheck to paycheck has increased to over 50.8%; this should all sound familiar to our readers!”
It was in this same note that we were discussing the bankruptcy cycle as well … we stated:
But this couldn’t possibly be why we’ve been seeing a hockey stick in bankruptcies as they are exploding to the upside, could it?! As can be visualized in the graphic (below) provided courtesy of Quill Intelligence CEO Danielle DiMartino Booth
You should be noticing the rise in bankruptcies coincides with previous recessions (which are represented in the below image by the grey shaded areas).
It’s no coincidence that these recessions have also coincided with major market downturns … we’re literally watching a business cycle unfold before our eyes; and you should be questioning the integrity or intelligence of anyone who suggest “this time is different!”
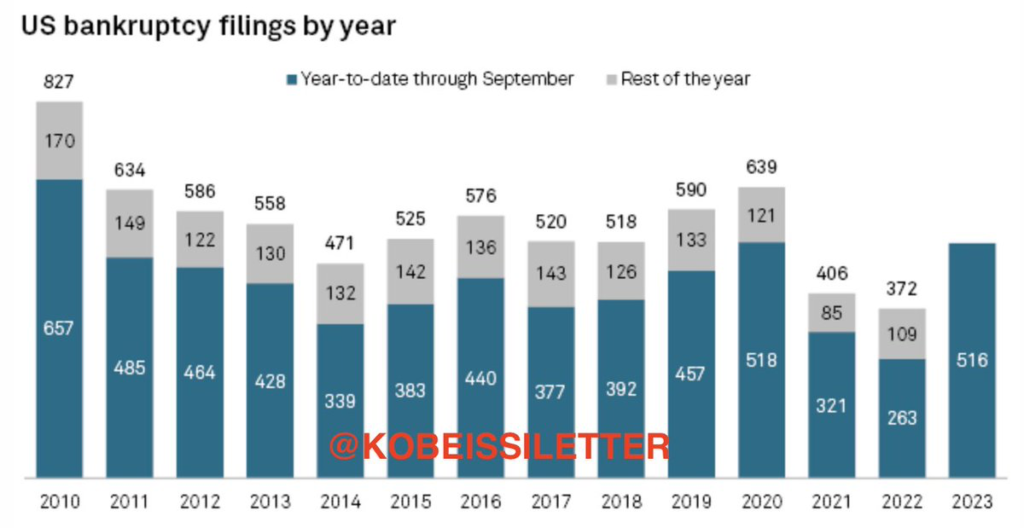
To date, we’ve now seen over 517 bankruptcies … outside of 2020 (when an entire globe was shut down), you’d have to go back to 2010 to see levels like this (coming out of the GFC) We’ve discussed this previously as well, though @KobeissiLetter has done a tremendous job detailing this as of late … per his 10/13/2023 tweet:
You truly have to be a special kind of elite prick, ignorant to the world around you, not only to suggest a “win”, but that this victory comes with “very little cost”.
We have RECORD household debt, auto loans, student loans, credit card debt, and mortgages … total U.S. debt is now over $33.65 TRILLION, tacking on $605 billion in a month, $20 billion per day (on average as they borrowed $58 billion in a single day a few weeks ago) and $833 million per/hour while Interest expense on the over $33.65 trillion is a record 19.5% … and they plan to borrow an additional $776 billion between now and years end. THIS IS OUTRIGHT INSANITY!
But don’t worry, the woman who brought us:
“Would I say there will never, ever be another financial crisis? … You know probably that would be going too far but I do think we’re much safer and I hope that it will not be in our lifetimes, and I don’t believe it will be,” ~Janet Yellen
Thinks we’re looking at a soft landing!
“You don’t really see any sign of a recession here … What we have looks like a soft landing with very good outcomes for the U.S. economy, so I think there’s a lot to be pleased about.” ~Janet Yellen
This women has been a fixture at the Federal Reserve, on and off, since 1977 … and with each passing crash and burn incompetent failure, somehow, her ashes miraculously find a way to rise to a more elevated position endangering even more Americans with each passing promotion … she and her peers ARE THE PROBLEM.
Middle middle America is getting absolutely decimated … these are the individuals and families doing everything they can just to simply feed themselves and/or their children … and oh yeah, we’ve just seen student loan repayments resume.
This isn’t just about credit contracting … or inflation expectations rising … it’s not just the skyrocketing mortgage rates or deceleration in housing … it’s not just the massive spike in oil, butter, eggs, orange juice, meat, etc.
On a compounding basis, per Hedgeye’s Director of Research Daryl Jones, Consumer prices are up almost 20% from September 2021 through September 2023 compounding 5.3%, 8.2% and 3.7% YoY, respectively.
It’s ALL of it, collectively! And we literally just spend 16 pages providing you with a fraction of what that “collective is”, while leaving plenty out as we’ve likely lost many readers due to length.
And yet, that should be more than enough to shatter a pompous linear econ’s narrative! Admittedly, his smug “at very little cost” struck a chord and is burning us to the core as I speak to countless people crying that they can’t put food on their tables.
Good, bad or ugly, we will NEVER stop providing you with the data … and if that means calling bullsh*t on those in a position of power, so be it. They have a responsibility an obligation to tell you the truth and it’s crystal clear that not only are they not being truthful, but they are also being deceitful as the data is so glaringly bad that they are either stupid or lying.
Absolute final thought … if we’re seeing this massive spike in non-performing assets in just about every area of the economy now, with a 3.8% unemployment rate, what do you think happens when the labor markets collapse?! (SEE: NONPERFORMING ASSETS SPIKE AND REFLEXIVE LOOP)
It won’t end well for many … the probability of a generational buying opportunity is rising … don’t be a hero … be prepared.
As always … Good Investing!!
Sincerely,

Mitchel C. Krause
Managing Principal & CCO
Please click here for all disclosures.

