

In This Article

Today we have no witty analogy to open … the length of the note is due large in part to graphs, don’t let the length scare you away!
At the moment, we’ve got some pretty powerful opposing forces facing off head-to-head, as central planners are attempting to:
Bend gravity
Over the last 2 years we’ve been talking about a looming recession, we warned readers that it would be Global … and it was.
Many of the larger, global equity markets have sold off significantly over the past two years. For instance, Chinese markets have been bearish for nearly 2 years and with each passing government “stimulus” intervention, markets continued to deteriorate. To the point where just recently, the communist government of China literally froze the assets of a quant/hedge fund; their infraction?! Selling equities at a pace the government didn’t like.
Germany’s government recently had to acknowledge 0% GDP growth just a few short weeks ago; as their GDP contracted by -0.4% … much of the EU entered recession and by the data, there’s no denying the US entered a full-blown industrial recession.
Some will say the U.S. equity markets didn’t collapse?! How quickly we forget 2022 – and yes, for much of 2023 we remained in 5% treasuries anticipating a further weakening in US equity markets… which clearly didn’t happen … through 2023 we’ve been wrong on a deeper decline in markets.
Remaining in equity markets to date was the right call – we were wrong. Most don’t care that market returns have come on the heels of 7 companies trading at bubble like valuations: risk be damned.
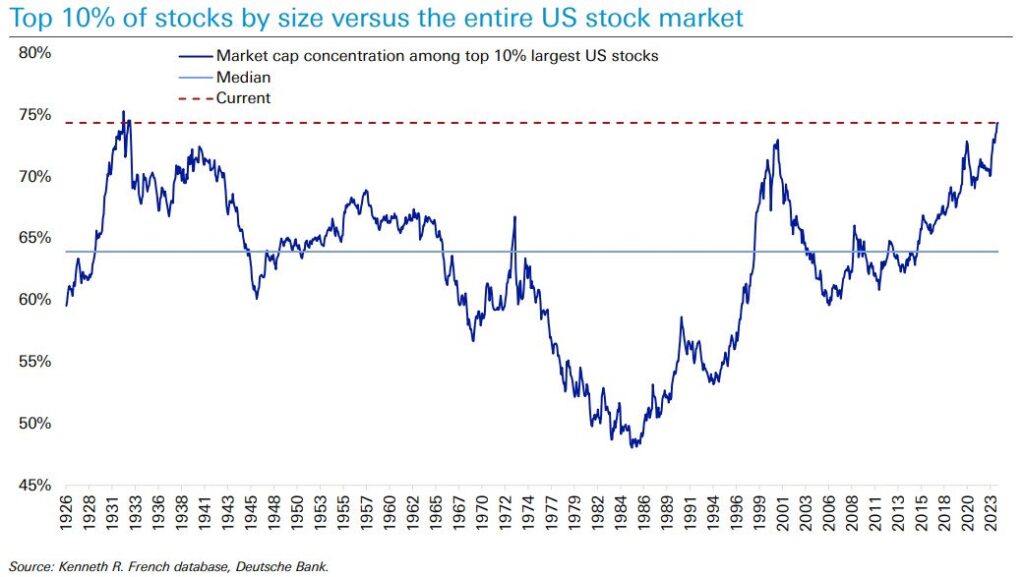
Most don’t care that we’ve reached a point in time where the concentration in markets has only been greater once in history; recently surpassing the second highest time frame when the market cap concentration among the top 10% largest U.S. stocks had only been higher one time prior; did you even know or care?! Image courtesy of @t1alpha
If you’re curious you might be wondering when those time frames were?! Eh, no big deal … just the era of the late 1920’s early 1930’s, also known as the GREAT DEPRESSION and the number 2-time frame just surpassed was 2001 – 2003 … if only there was something that happened around that time frame that decimated the majority of investors?! (MMmmmm, like the bursting of the Tech bubble?!)
While the vast majority of data, in the aggregate has been decelerating for nearly two years, much of it, as we’ve been noting along the way, has been the worst seen since the last 3 major US stock market crashes (Tech bubble, GFC (Great Financial Crisis & Covid collapse) … the US government has been able to do something the aforementioned governments and previous administrations were unable to do successfully … which is deficit spend their way OUT of a recession (FOR NOW).
By the time you read this the National Debt in the U.S. has just eclipsed $34.4 TRILLION dollars; with our government’s reckless spending recently adding nearly 1.4 TRILLION to the National debt in 5 ½ months, following the $1 TRILLION assumed from June 15, 2023, to September 15, 2023.
In aggregate the US increased their Nominal Debt by over $2.5 TRILLION and deficit spend north of $1.78 TRILLION in 2023 … at a time when technically, the US was NOT at war (as the Constitution grants Congress the sole power to declare war … pesky facts, I know), nor did we experience and “emergency” global crisis (aka: Covid)!
This spend accounted for roughly 1/3rd of U.S. GDP Growth in 2023 and it doesn’t appear to be ending any time soon.
At the end of January, the House passed a bi-partisan tax-cut bill that will BOOST the deficit by nearly $140 billion dollars … President Biden just announced another $1.5 billion in spending for microchip production, while the original $140 billion has yet to be spent yet and this doesn’t even touch the over $350 billion in State and Local Fiscal Recovery Funds (SLFRF), over $100 billion in Inflation Reduction Act (IRA) money or portions of the over $1.2 TRILLION dollar Infrastructure Investment and Jobs Act (IIJA) that the Biden Administration signed in November of 2021; also yet to be spent.
This, on top of the most recent attempt by the Biden administration to cancel $1.2 billion of student loans for nearly 153k people. In a recent speech, being outright defiant, Biden stated that he’s done this in the face of last June’s decision from the Supreme Court which struck down his effort to forgive $430 billion in student loan debt, stating it was UNCONSTITUTIONAL! Which clearly doesn’t mean much in today’s world?!
Post-SCOTUS ruling, the administration has announced over $138 billion in student debt forgiveness for nearly 3.9 million people via executive orders … and while this ruling will likely be challenged and again ruled unconstitutional given SCOTUS’s first ruling on the matter, the administrations orders will keep more money flowing through the economy for a longer (as the legal process takes time).
In the short term, markets don’t care about what we “believe” may or may not happen sometime down the road with the cancelling of contractual obligations or how we “feel” about it, what they do care about is which way GDP moves, which is driven largely by consumer spending.
Deficit spending, cancellation of contractual obligations, or direct handouts to the tune of $5,000 p/month to those crossing the border on pre-paid debit cards will keep more money in the system for a longer period of time … it will also maintain a sticky inflation (higher for longer)!
When government spending skyrockets, accounting for north of 30% of GDP … GDP moves up, which, as noted above, has to date, kept us out of a “technical” recession.
Massive deficit government spending coupled with direct handouts for people to spend, can and will drive inflation as we’ve cited the work of the great Dr. Lacy Hunt in the past (and we’ve seen first-hand from the 2020 Covid handouts which continue today!
While all this spending is fairly difficult to wrap your arms around for, when it comes to funding the government, we’ve been operating under CR (or Continuing Resolution) for what seems to be an eternity, at the same time, legislation President Biden authorized in June of 2023, suspended the debt ceiling until 2025 … I guess we know where all this money will come from?! SEE: treasury bond/bill issuance.
What could possibly go wrong?!
Well, a higher for longer CPI?!
“I want to repeat that for you again … the Fed is seeing the “possibility” of 3 rate cuts in the back half of the year (assuming inflation reaches their 2% target), yet markets are telling the Fed that they’re cutting rates 7 to 9 times (between 175 and 225 basis-points) with the first cut coming as early as MARCH!
How’s that for a disconnect?!” OSAM December 2023 – D.I.S.C.O.N.N.E.C.T
We’ve been throwing ice on the “Fed’s going to cut rates” camp for quite some time … in December we stated the above, following up in our January note … we titled that specific section, “They Lie”, we wrote:
“So, while much of Wall Street had been calling for those rate cuts, we’ve been pounding the table on higher inflation rates (thus, a higher Fed Funds rate) for longer.”
The odds of a March rate cut, as recently as the last week of December were as high as 97% … today that probability stands at 3% … the precipitous pace in which rate cut expectations collapsed following January’s CPI print is only remarkable to those who need the Fed to cut rates; for those with a decent handle on CPI construction or who follow @Hedgeye; whose inflation model has pretty much nailed each major turn the only surprise is how others were so “wrong”.
February’s most recent headline CPI number did decelerate slightly but remains “hotter” than consensus anticipated coming in at +3.1% vs. +3.4% in December … expectations were for +2.9% and +3.0% respectively. While Core CPI remained, flat MoM coming in at +3.9% vs. wall street expectations of a -0.2% deceleration to +3.7%.
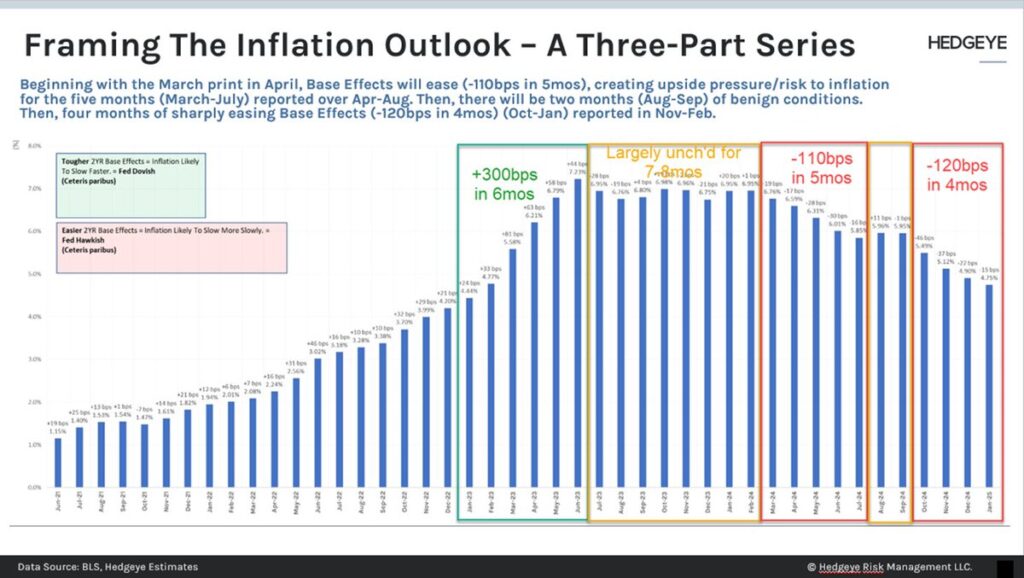
The Fed’s frequently discussed Core services EX-housing number accelerated to +4.3% YoY, arguably creating a bit of a problem. While we may see some softening into next month’s print, also per the work of Hedgeye’s Josh Steiner … given the easing base effects into the back half of the year, and rising pressures in things like shipping (which is on an approximate 8-month lead/lag flowing through into the data), and other commodities, like meat, eggs, milk, copper, etc … it becomes extremely difficult mathematically to get
anywhere close to the Fed’s 2% inflation target! Thus, we remain in the “higher for longer” rates camp … UNLESS … something “markets related” breaks bringing us much larger issues.
Additionally, we called out oil’s recent acceleration in last month’s note:
“OIL RECENTLY ACCELERATED BY OVER 10% MOM … Ok, simple math … with oil being roughly 7% of the CPI data, a 10% move would contribute nearly 70 basis points of acceleration (yes, we know it’s a more complex, but it gets the point across).”
While just this week the Case Shiller Home Index accelerated from 5.4% YoY to 6.1% YoY, and again, as we noted last month, we understand that there is nuance to how it all flows through into the headline data on a lead/lag basis in addition to comparable base affects, but at the same time, Housing and Energy add up to north of 40% of Headline CPI, which poses a bit of a problem for both the Fed as well as those in the “rate cut” camp!
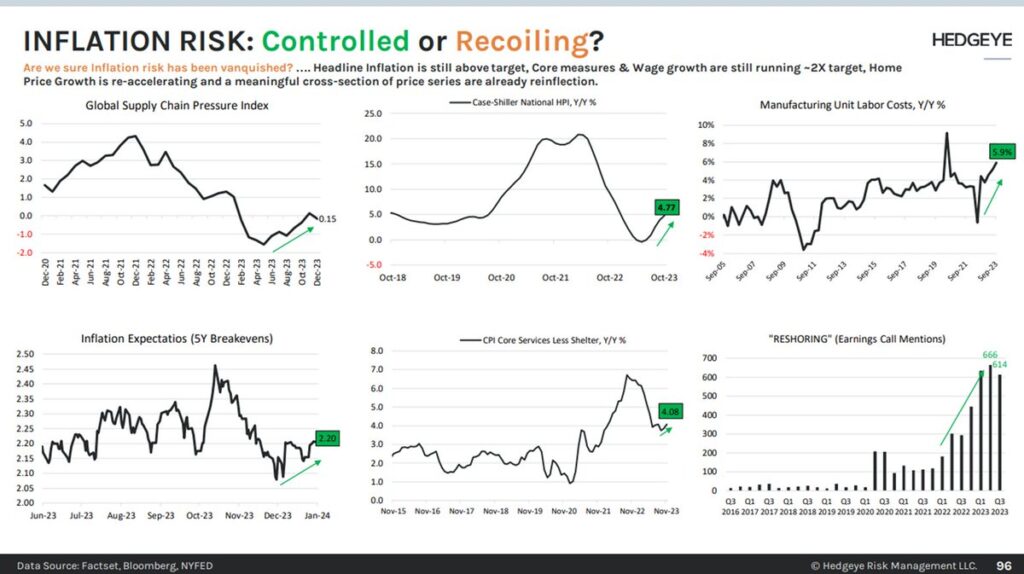
This conundrum leaves Hedgeye Macro team member Christian Drake (@HedgeyeUSA) begging the question: Is INFLATION RISK: Controlled or Recoiling?!
In the spirit of, “They Lie” from our January 2023 note mentioned above, I’d like to pull a quote from something we highlighted in our 3Q2023 note, published on October 31st.
“More importantly, October’s University of Michigan 1-year inflation expectation accelerated to 3.8% vs. 3.2%, while the 5-year rose to 3.0% vs. 2.8%.
So, when someone like Federal Reserve Chairman Jay Powell has the audacity to suggest in front of the world that the massive run up in treasury yields isn’t large in part because of inflation expectations or credit risk based on the massive borrowing as he did last month … someone with more clout than us (say the financial media) who is allowed to ask him questions, should be calling B.S. … and since they’re not we’re going to … as we did last month when we wrote:
This dynamic is WITHOUT QUESTION, feeding the massive move higher in inflation expectations, which is in turn, creating a tailwind for rates and the U.S. dollar, contrary to what Herr Powell said in his most recent press conference:
“… rates have moved up significantly. I think it’s always hard to say precisely, but most people do a common decomposition of the increase, and the view will be it’s not mostly about inflation expectations. It’s mostly about other things, you know, either term premium or real yields, and it’s hard to be precise about this. Of course, everyone’s got models that will give you a very precise answer, but they give you different answers. But essentially, they’re moving up. It’s not because of inflation.” ~ Federal Reserve Chairman Jay Powell
Sure, 10-yr Treasury yields have rocketed higher over the course of a few weeks from a 4.05% to 4.61% because of “term premium or real yields” not because of inflation expectations?!”
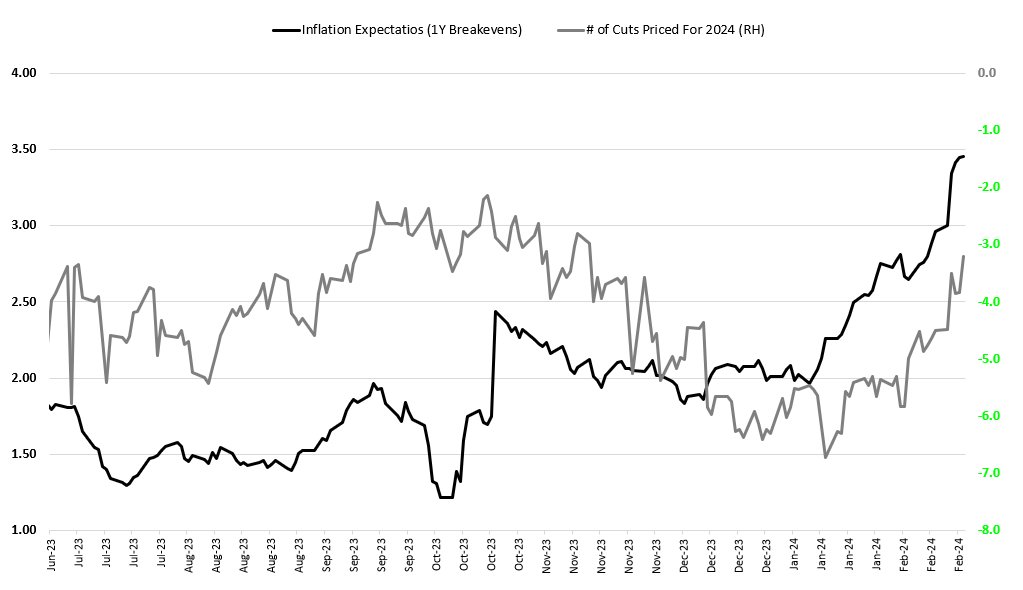
Look, the data continues to scream these guys are lying and they most likely know that they’re full of sh*t trying to central plan and manipulate markets. The below chart was recently published by @Hedgeye CEO Keith McCullough which shows us the directionality of inflation expectations vs. the precipitous collapse in rate cut expectations (inverted) … showing inflation expectations have been rising since we wrote what we did about them in our 3Q2023 note back in October – the dates align nearly perfectly.
Again, Powell was either lying, full of sh*t or maybe he should consider using models that have been consistently accurate like @Hedgeye’s vs. those giving him “different answers” (his words) that have consistently been wrong (Like: pretty much all of Wall Street’s)?!
The straw?!
There are countless real world consequences to sticky inflation/higher interest rates for longer; one that comes to mind immediately would be Real Estate … and while the Housing sector has been showing signs of “green shoots” with increased activity into the back half of last year as Wall Street pushed their rate cut narrative, with the most recent headline CPI data and a crumbling of said narrative … recent mortgage purchasing apps data came in at 133.3, DOWN -10% WoW (SHOCKER) and at the moment, -9.1% MoM; giving up nearly 3 months of acceleration with this most recent print … the softest since the beginning of November. Say it with me folks: “Interest Rate Sensitive”!
We’ll see how this plays out in as we move forward throughout the year, but it’s important to be mindful of whether or not it will manifest as a shorter-term trade a longer-term trend or the straw that breaks the camel’s back scenario?!
For well over a year, we’ve been highlighting the carnage going on in the CRE markets. Higher rates have gutted the CRE (Commercial Real Estate) markets and continue to do so as the delinquency rate on commercial mortgages continues to spike while unrealized losses have become devastating to many financial institutions.
When it comes to big time real estate, no one wants to sell in an environment like this, sales are most often triggered for strategic reasons (restructuring) or out of necessity (the need for liquidity or an outright default). Though, it takes TIME before we start to see where the bodies are buried and how bad things possibly are.
Earlier this month we got a glimpse though, as $NYCB fell by over 37% in a day and nearly 60% in a week’s time frame (January 31st to February 7th) dragging down the $KRE (regional banking sector) by -6% in a day on the heels of them booking a greater than $500mm loan loss provision, and cutting their dividend by nearly 70% (from $0.17 to $0.05) following massive charge-offs on a handful of properties, but 2 in particular while providing horrific forward guidance.
Putting this provision into perspective, on 2/1/24, Hedgeye Financial Sector Head Josh Steiner had this to say about the disaster:
“the charge-off they took this quarter, was larger than all the combined charge-offs they had taken in the prior 48 quarters … it was so bad that it actually wrecked their capital ratio and their capital ratio now is below where it needs to be”
One day later, a Japanese bank and the 16th largest lender in Japan (relatively small by U.S. standards with a $2 billion dollar market cap) made some startling comments in regard to their extremely large U.S. commercial real estate exposure.
Which we find to be ironic given that as recently as last November the same institution made comments suggesting things were under control and there was no cause for alarm … (COUGH, they all lie … COUGH COUGH, THEY ALL LIE!) … though, I digress…
Azura was expected to report net income of roughly $200mm … what they actually reported was a NET LOSS of -$200 MILLION. So much for things being “ok”?! But that’s NOT the startling part, what’s troubling is the guidance on their updated LTVs across their U.S. office portfolio spanning across different cities.
For those needing a quick refresher on what LTV means; the Loan-to-Value ratio is the amount of the mortgage or debt compared to the value of the underlying collateral/property backing that loan … so, when the 16th largest lender in Japan (Azura) released LTVs earlier this month on their U.S. portfolio, it should truly raise the eyebrows of all investors. Why?! Just look at the data…
- New York: 155%
- Washington D.C: 172%
- Chicago: 211%
- Los Angeles: 176%
- San Francisco: 168%
- All other markets: 163%
So, in reporting a 155% LTV in the NY market, what it ultimately means when putting pen to paper, is a hypothetical $155 million-dollar loan is only collateralized with a property VALUED at $100 million-dollars; when applied to Chicago’s 211% LTV, you’re staring at a $211-million-dollar loan on a $100 million-dollar property. Again, in Washington D.C. a $172 million-dollar loan is currently collateralized by a $100 million-dollar property.
The unrealized losses here are staggering and an elevated interest rate environment does NOT IMPROVE this situation; in fact, as noted above there are certain events that force or trigger liquidations turning unrealized losses into realized losses, not only for the financial institutions, but for investors/partnerships, etc. What could one of those triggers be?! How does 12% of office total U.S. CRE loans needing to reprice in 2024 sound?!
At the moment we’re seeing sales on massive office space transact at 50% PLUS haircuts to previous prices paid (NOT their high-water marks); in some cases, the keys to some buildings are just being handed back to the lenders … what happens when these loans need to be repriced at higher rates and/or properties need to be sold/liquidated and they can’t freeze redemptions like BREIT or SREIT (among others) have done in the past year?! NOTHING GOOD!!!
Additionally, a December 2023 white paper out of the NBER (National Bureau of Economic Research) took a fairly deep dive into the CRE market and the findings there are also quite troublesome.
The current estimate of unrealized CRE losses on the balance sheets out there is between $80 to $160 billion dollars assuming a 10% – 20% default rate with a 70% recovery rate. Per the white paper, it’s estimated that 14.3% of ALL loans and 44.6% of office loans have negative equity at the moment … and again, these conditions DO NOT IMPROVE in an elevated interest rate environment.
All of this being said, this past Tuesday, as reported by Bloomberg; the largest Canadian pension fund (Canadian Pension Plan Investment Board) just SOLD its interests in:
“a pair of Vancouver towers, a business park in Southern California and a redevelopment project in Manhattan, with the New York stake offloaded for the eyebrow-raising price of just $1.”
A DOLLAR! ONE SINGLE DOLLAR!
Ironically, also per the BBG article, “the worry is those deals may set an example for other major investors seeking a way out of the turmoil too.”
Yaa don’t say!?!?!?!
I’m going to repeat something I said a few short paragraphs ago in regard to $NYCB’s charge-off and provision which is … “but 2 in particular”! As in … the massive write off that took $NYCB below capital ratios came from 2 properties in particular.
When a proverbial straw breaks the camel’s back, it doesn’t happen in a vacuum, it not only will drag down the LTVs of many other asset classes, including the remainder of “office” CRE, which will increase the already obnoxious 44.6% of “office” CRE with negative equity … the necessary liquidity will be found from somewhere.
Did we mention the CRE space is a $3 trillion-dollar market?! So, suggesting it’s “big” might be the understatement of the year!
In an efficient market, the level of collateral SHOULD exceed the value of the loan in order to protect the lender in the event of default; remember, banks don’t have the infrastructure in place to be a landlord, bankers are paper/pencil pushers … there should always be a buffer in the event of an emergency and right now, there is no buffer on many properties/loans?!
Loan to values like these are alarming! These are the problems we’ve been discussing for over a year now, and at some point, the rest of the regional banking sector is going to have to disclose, what we believe to be similar dynamics on their books.
Final thought on this topic we failed to mention … the Federal Reserve has made it fairly clear that their BTFP (Bank Term Funding Program) initiated last year to help ailing regional banks ends on March 11th … this march 11th! Will they follow through? TBD … but if they do, buckle up buttercup!
We’d note that while the work from home / Covid time frame revealed the proverbial chink in CRE’s armor, the reality is the fate of these lenders/buildings were sealed when these firms borrowed copious amounts of money, at extremely low interest rates that would reset into a spiking rate environment … higher interest rates for a longer period of time is throwing gas on an already 5 alarm fire.
So, where does that leave us with financial markets?!
UNSUSTAINABLE
We’ve beaten the proverbial dead horse on labor markets and NFP revisions … as recently as last month we stated:
“(for months now), along with artificially propping up the economy via deficit spending, lying about a strong consumer, they’ve also been printing jobs as government hiring has outpaced anything private sector related as it has for nearly a year now … all fueled via borrowing trillions of dollars with interest rates at multi-decade highs; government spending contributed over 1/3 to 2023 GDP while running over a $1.7 trillion dollar deficit in 2023.
That being said, we were wrong … manipulation or not, wrong is wrong!
To reiterate, we discussed the government’s massive spending artificially propping up the economy with multiple trillions in deficit spending above; anyone who attempts to debate this fact is being intellectually dishonest; empirically, the Government’s contribution to GDP in recent years accounted for +2.4%, -0.3% and -7.5% in 2020, 2021 & 2022, respectively … in 2023, that number rocketed to 24.5% … full stop!
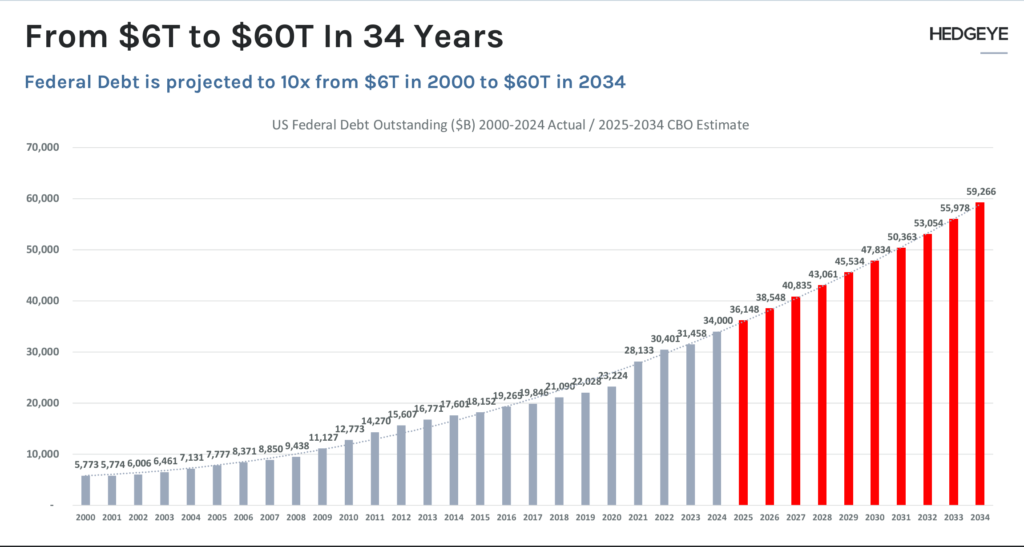
Recent CBO (Congressional Budget Office) projections are forecasting the Federal Debt to reach $60 TRILLION by 2034 … that’s nearly a double our current debt level in 10 years. Recently, Hedgeye opened their research up to anyone who wanted to look in a free to the public week. On the 2/26.24 Macro Show, CEO Keith McCollough shared some slides putting our national debt and deficit spending into perspective!
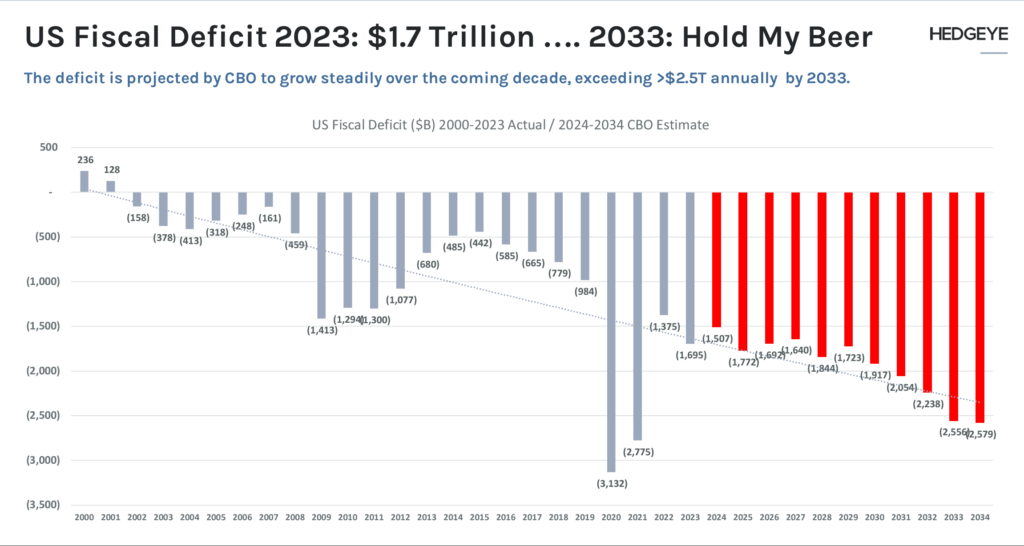
If that weren’t startling enough, last year’s $1.7 trillion-dollar deficit (illustrated below) is roughly $300 billion MORE than the $1.4 trillion racked up during the GFC (Great Financial Crisis) … and nobody is batting an eye, just give me “up $SPY” and I’ll be ok!
By 2034, federal deficits are projected to run at a rate near $2.5 TRILLION PER YEAR … what could possibly go wrong?!
Those who read our work know that the data, as it flows through to both growth and inflation via GDP & CPI respectively is what’s important to markets, so we know that spending, in an effort to support the consumer is one way they’ve “fixed” the data … but it’s not the only way they’ve propped it up!
Again, we’ve been talking about this for a while now, too:
“they’ve also been printing jobs as government hiring has outpaced anything private sector related as it has for nearly a year now … all fueled via borrowing trillions of dollars with interest rates at multi-decade highs”
So, let’s talk:
Labor & government
The internals of the labor market data continue to deteriorate, you choose the lens in which you’d like to see it through:
- Full time employment continuing to decline
- Permanent job losses steadily rising
- Temp (temporary) and Overtime hours persistent, near cycle lows
- Average weekly hours dwindling, with its most recent report touching 34.10, sitting near the 2019 – 2020 recession lows
While at the same time … Challenger, Grey & Christmas data shows:
- Job cut announcements spiking and
- Plans to hire plummeting
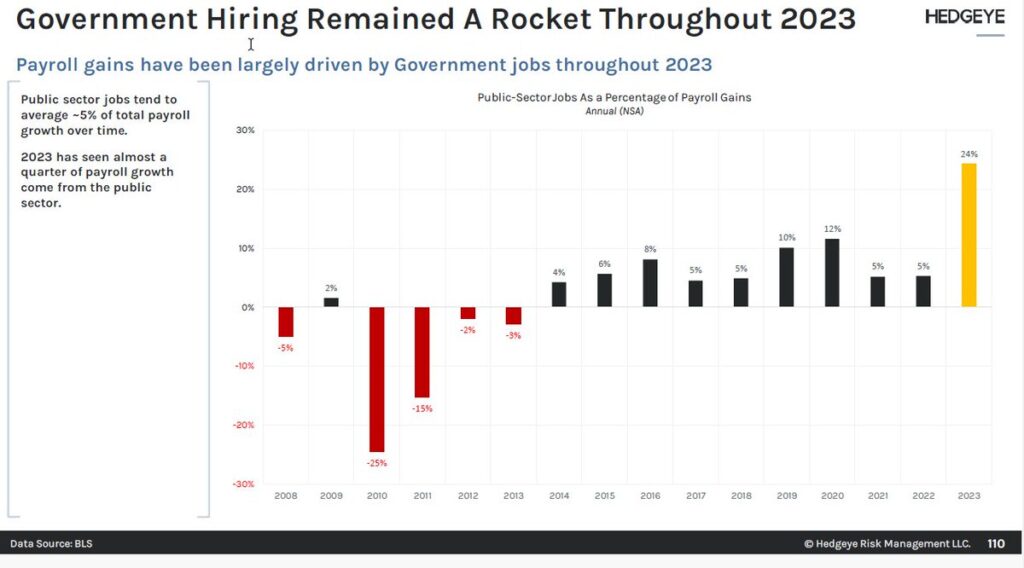
We could go on, but we think you get the point?! Public sector jobs as a percentage of payroll gains was north of 23% last year, but more interesting … as the government spending slowed down in the back half of the year, the government jobs quietly became 31% of all new jobs added.
One might start to wonder how in the name of all that’s holy can the government be hiring at the pace they continue to report?! Where, as Hedgeye notes in the below slide … historically, “public sector jobs tend to average ~5% of total payroll growth over time … 2023 has seen almost a quarter of payroll growth come from the public sector.”
We’ve been a broken record; labor is the latest of late cycle indicators … highlighting the massive distortions, revisions, and revisions of revisions in the data has become a full-time job.
Though, call us conspiracy theorists all you want, but we don’t believe it to be a coincidence that the only segment of the labor market that’s been “hiring” over the past year is the government, while the private sector has been losing jobs at a precipitous pace (and continues to do so)!
The number of private sector layoffs announced over the past 4/5 weeks has been historic … while we named a few of these in last month’s note like Levi Strauss (15%), Macy’s (13%), Wayfair (13%), Citigroup (20k employees), Twitch (35%), among others … the below are companies who have laid off a specified percentage of their entire workforce:
PayPal (7%), Okta (7%), Business Insider (8%), eBay (9%), Charles Schwab (6%), DocuSign (6%), snap (10%), Duolingo (10%), Washington Post (10%), Cisco (5%), UPS (2%), Nike (2%), BlackRock (3%), Qualtrics (14%), Xerox (15%), Spotify (17%), LA Times (20%), Hasbro (20%), Roomba (31%) … and there’s more.
I am positive they don’t read our work, but maybe those at the Fed are on to something we’ve been talking about for north of 5 years, but spelled out most recently in our May 2023 note?!
“Given the ever-rising importance of the passive bid with the growing popularity of passive investing over the years, a spike in unemployment will likely have an even larger impact on market performance as it will be shrinking this bid concurrently with the reversing of the previously aforementioned liquidity dynamics … and still, no data in sight for the Fed to point to cut rates, let alone pause for any length of time.”
In propping up employment, the passive bid on equities remains, which appears to be getting stronger the larger the percentage that passive investing becomes … which has now eclipsed 50% if market activity for those paying attention.
The good & bad (DATA)
We’ve always said that we’d turn our positioning when the data turned … and at the moment, while much of the granular data remains awful, Janet Yellen & her collective bosses have been able to press on the fiscal gas pedal just enough to skirt a technical recession here in the U.S.
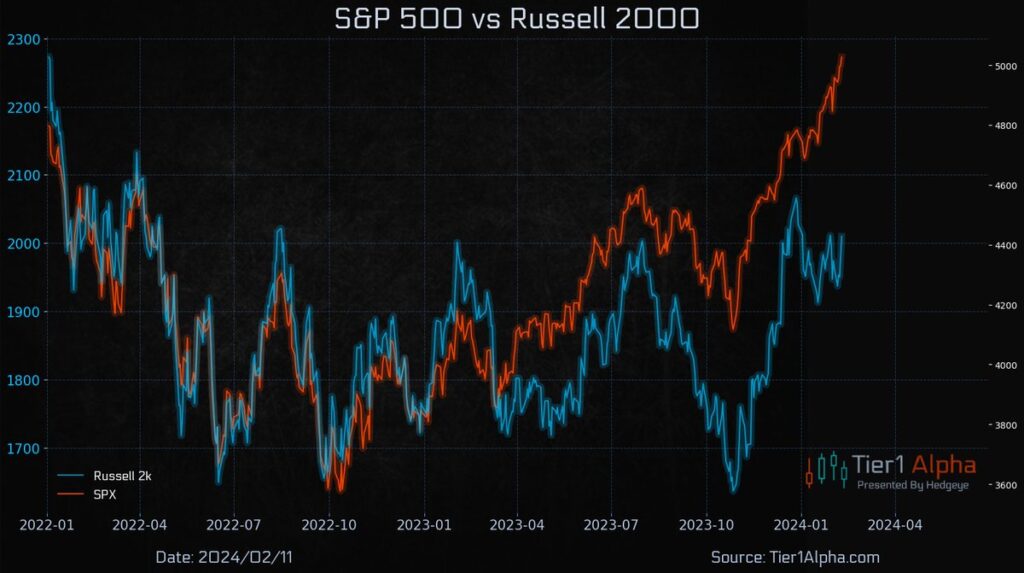
Despite an outright industrial recession, manufacturing recession and clear depression in small business earnings as we’ve been citing for over a year, which can also be seen through the lens of the NFIB data, bank lending data and Russell 2000 earnings … $SPY go up!
Winners go to central planners (for now)
While the bulk of the data remains negative, the primary drivers of the markets from a historical back test remain growth (GDP) and inflation (CPI), which have been centrally planned away for the time being.
Earlier in the piece we noted “green shoots” in regard to housing, which has recently seen a hiccup given the rise in interest rates … still:
ISM services data accelerated with headline jumping to a 5-month high at 53.4; a +2.9-point acceleration. New orders increased to 55, employment jumped back over contractionary touching 50.5 as it increased +6.7 points.
Prices also accelerated to 64, increasing by +7.3 points … another indicator that the pain of inflation is slated to remain elevated for longer. All of these data points keeps the Federal Reserve HAWKISH, if they’re actually “data dependent” (HIGHER FOR LONGER – SEE CRE DISCUSSION ABOVE = No Bueno)!
Additionally, earlier in the month Redbook retail sales did accelerate up +6.1% YoY vs. the prior week of +5.0 YoY.
The above data is positive (and admittedly there’s more) … in the aggregate, the data, with the help of deficit spending, points to an accelerating GDP and CPI, which is historically bullish. Again, markets don’t care about the destruction taking place behind the scenes until it does…
Be it massive expansion of the national debt at obnoxiously high interest rates, suspension of student loans (until challenged and ruled on again by SCOTUS), billions of dollars on prepaid debit cards to illegals or juicing employment and in turn, maintaining the passive bid in markets – it just does matter … until it does.
That being said, there is still a massive amount of negative data out there … be it consumer credit continuing to tighten which can be seen through the SLOOS data, a crippled consumer via Gallop polls among countless other measures like:
A deceleration in Redbook retail sales decelerating to +2.5% YoY vs. the recent acceleration to +6.1% YoY discussed above, which led right into January Retail Sales here in the U.S. coming in LOWER than expected at -0.8% MoM vs. a negatively revised December of +0.4% and up +0.6% YoY … a recessionary number!
Or the small business optimism data via NFIB which remains near cycle lows with January’s slowing to 89.9!
Or the New Orders component of Durable goods data coming in at -6.1% MoM and -0.6% YoY (also a recessionary number) … Or the Consumer Confidence data decelerating again to 106.7 vs. January’s 110.9 (a number that was negatively revised)
The LEI index has now shown contraction for over 22 months and currently sits a few months shy of the Great Financial Crisis’s 24 month stretch; though, tying the 22 months of contraction from the early 1970’s … a recession more severe than any of the previous 5 post-world war recessions in terms of overall output decline and rise in unemployment.
As loan demand remains anemic, earnings will remain pressured, though admittedly … YoY comps will be more favorable.
So, as we’ve said in the past, when the data changes, our positioning would, and it has … for the time being.
We are still of the opinion, with interest rates at these levels, the CRE market in chaos, the Fed’s BTFP ending on March 11th, and the government running a pseudo MMT without a budget and 1% cuts coming across the board if one isn’t reach by April … that something will break!
And when markets collapse due to structural issues, things can get spicy very quickly as bids disappear, for again liquidity becomes the primary asset and needs to be found to satisfy margin calls/excess leverage, especially when passive moves from net buyer to seller! This doesn’t even take into consideration the unrealized losses in CRE, which has the potential to set off a fire storm … as does the labor market weakness with margins compressing given inflationary pressures remaining high (see: skyrocketing health insurance costs)!
Final thoughts
Putting all of this together, we’ve now got some “manipulated” good, continued bad, and a bit of “really ugly” data colliding with market structure; market structure being something we’ve discussed for more than half a decade. As the passive investment style continues to gobble up market share from active managers, we thought it important to note a few things.
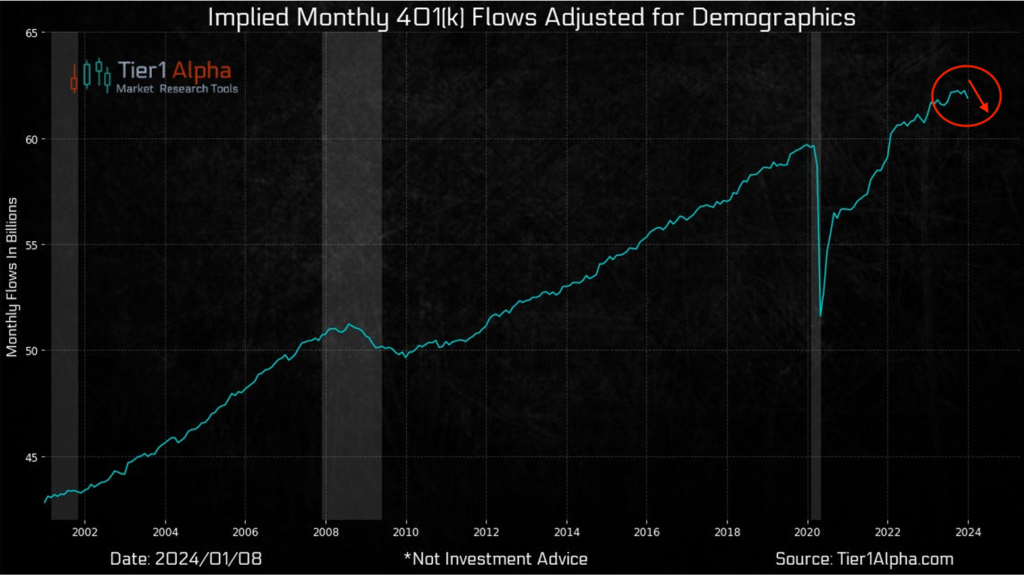
First, as credit tightens and the consumer weakens, emergency 401k withdrawals continue to spike! While we’ve been discussing this for nearly a year, the trend remains and it’s accelerating; hardship withdrawals at fidelity have gone from 6.1% to 6.9% from 2022 to 2023, the percentage continues to accelerate at Empower as well! Which can be visualized via a chart provided by Hedgeye partner, Tier1Alpha! As flows roll over, so too do markets.
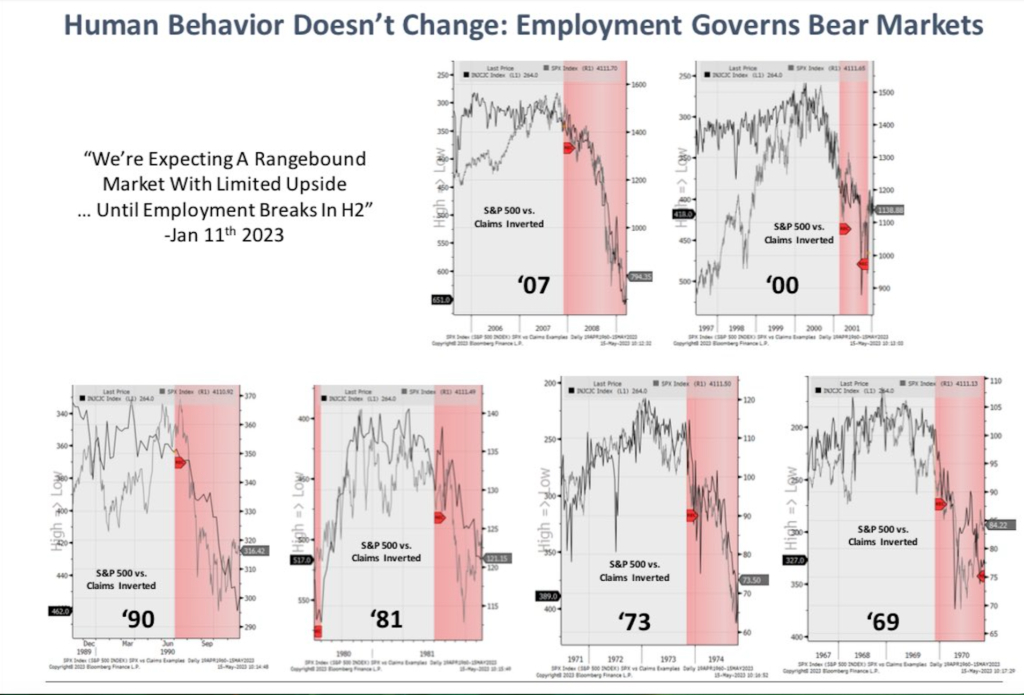
Passive flows don’t care about fundamentals … and are often linked to employment, which we not only discussed above, but also in the May 2023 note where we shared the chart below … credit to Chief Investment Strategist at Piper Sandler, Michael Kantro:
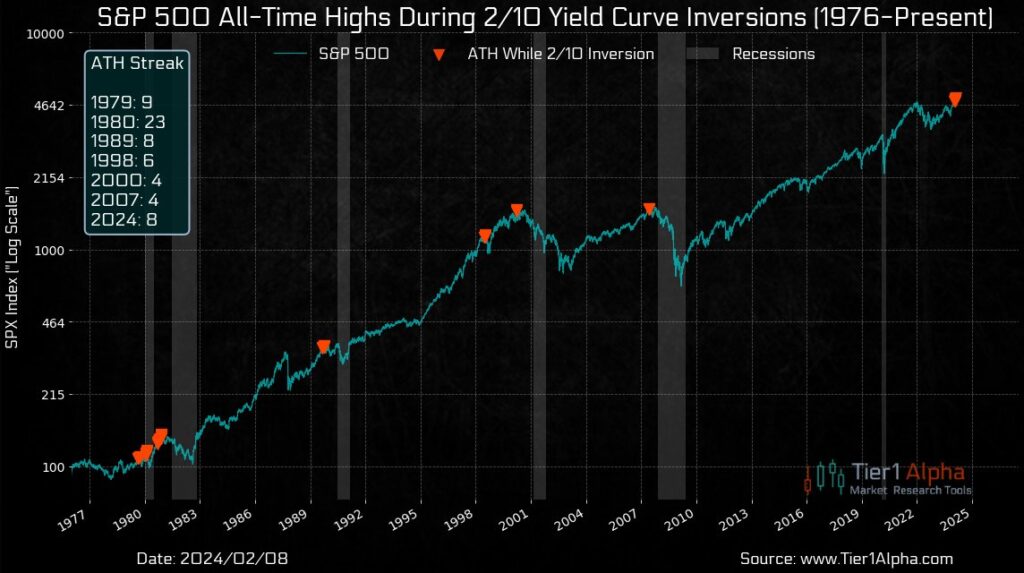
And while central planners believe they can centrally plan every problem away … their success ratio throughout history has been abysmal. Yes, to date, they’ve pulled us from the doldrums of 2022, but it’s also important to remember markets have also have a history of making all-time highs during an inverted yield curve shortly before the bottom falls out!! Image also provided by @t1alpha
Finally, we’d remind you of a conversation we highlighted back in our 2Q2020 note between Grant Williams, Bill Fleckenstein and Mike Green, at the time Mike was with Logica funds.
In that conversation, Mike Green discussed the dynamics of passive and the math behind the volatility … which becomes more dangerous (in both directions) the larger a percentage passive investing becomes. More specifically, Mike noted greater than 50%, which we have surpassed.
- “Beyond limit down, they literally go to ZERO” … “There is no bid” – minute 55:12
- The problem with that is simultaneously it takes volatility through the roof” – minute 54:26
- “Because that’s what markets are; markets are the solutions for transactions. The price that you see is the intersection of supply and demand, not in some theoretical sense but the point at which buyers and sellers were able to meet and balance that book” – minute 55:18
- “There’s NO price in which that market can clear” – minute 55:40
Once you understand markets are flow driven and not fundamental, these words will ALWAYS stay with you!
We are invested but are also minding our downside capital preservation levels diligently … we recommend you do the same!
Good Investing,

Mitchel C. Krause
Managing Principal & CCO

4141 Banks Stone Dr.
Raleigh, NC. 27603
phone: 919-249-9650
toll free: 844-300-7344
mitchel.krause@othersideam.com
Please click here for all disclosures.

