

In This Article

“A turkey is fed for a thousand days by a butcher; every day confirms to its staff of analysts that butchers love turkeys ‘with increased statistical confidence’ … The butcher will keep feeding the turkey until a few days before Thanksgiving … Then comes that day when it is really not a very good idea to be a turkey.” ~ Nassim Taleb
Let’s talk turkey…
With both Thanksgiving and Christmas recently in the rearview, the fog should be lifting from our turkey coma’s providing clarity for what this upcoming New Year’s resolutions should be?!
Every year, roughly 270 million turkeys are killed in the United States, with an estimated 46 million being consumed over the Thanksgiving holiday alone. Per USDA.gov, from 2014 through 2018 nearly two thirds of all birds in the U.S. were the product of just 6 states: North Carolina, Virginia, Arkansas, Iowa and the largest producer of the group, Minnesota, “which produces more than 15% of the U.S. turkey meat annually.”
That’s a lot of turkey.
Male turkeys (or toms) grow to an average weight of 41lbs with female (hens) topping out at a much smaller 17lb average.
From the moment most of these birds are hatched they’re raised to be killed! The turkey of course, does not know this; they’re fed, fattened, and finished, growing larger by the day (often, uncomfortably so). The turkeys are naively unaware that in the end, the farmer’s goal is to get them to a point that maximizes margins by the time they eventually reach their date with destiny.
There are all sorts of variables that determine how quickly a bird matures; environmental conditions, diet, and of course, genetics, to name a few, which means its exact date with death is estimated, yet TBD.
Is the bird a production variety or heritage breed? Are they exposed to natural weather and temperature conditions? Are they raised in brooders (turkey houses) which are climate controlled to temperatures of 95 to 100 degrees (young poults need quite a bit of heat to survive). Obviously, nature provides no such accommodations or guarantees.
Understanding how “diet” may impact the overall growth and health of a turkey shouldn’t be a difficult concept to grasp; we’d ask that you merely consider the health of an individual who dines on fast-food morning, noon, and night vs. that of someone who consumes fresh vegetables, salads, nuts, berries, and properly prepared proteins; then throw in “exercise” (or a bird’s ability to roam vs. barely waddle in an extremely confined space) there is no question as to who will be more heathy; there is simply no comparison!
Having said this, production birds are fed processed grains and legumes like GMO corn and soy, while free roaming foddered turkeys primarily eat leaves, grass, fruits, berries, seeds, and even insects (as the adage goes, you are what you eat)!
The importance of diet and living space for these birds can’t be overstated, at the same time, as is also the case with humans, genetics is the largest input of the maturation process; all variables determining when these birds will reach their great reward in turkey heaven.
In an effort to satisfy consumption habits of Americans, over the years, farmers and scientists have intervened creating bird varieties via cross breeding and genetic engineering. These breeds, often referred to as production birds not only grow larger breasts to accommodate the American’s insatiable desire for more white meat then heritage breeds’ bear; they also reach harvest size faster (which cut feed costs).
On average, most factory farm raised turkeys will mature between 14-22 weeks, with some birds heading to slaughter between 9 and 24 weeks of age … while Heritage birds often take longer; on average 26-28 weeks to fully mature … a win win for everyone, right?!
Not so fast …
While “selective breeding” brings with it some perceived benefits, many industry experts will tell you that it’s also led to an increased population of birds that are highly susceptible to heart disease, infections, and extremely poor fertility rates which natural heritage birds are NOT vulnerable to:
“Industry-bred birds have unusually large breasts, so disproportionate with the rest of their bodies that they often have trouble standing, walking and mating — these turkeys rely on artificial insemination for reproduction.” Why are Turkey’s Genetically Modified, Maria Trimarchi
“Production birds do not have the same disease resistance, natural reproduction capabilities, and flavorful meat as Heritage breed”, McMurray Hatchery
Nassim Taleb uses the above story of the turkey in his book Antifragile: Things That Gain from Disorderto describe a system in which the turkey (in this example) is completely unaware of the system’s fragility … when summed in broad strokes, a farmed turkey perceives its life to be relatively good until one day its abruptly and unexpectedly ended!
Depending on how granular one gets, there are numerous parallels to the turkey ecosystem described above, current financial conditions, unintended consequences of intervention, the fragility of the entire system, and the dangers this poses to all investors.
Current Financial conditions
We’ll start with inputs! As noted above, there is an enormous difference in health between the genetically engineered turkey that’s fed a substandard diet vs. a heritage bird given space to freely roam and is privy to a natural diet. Given a clear understanding of the inputs, they most frequently will provide you with a more vivid picture as to what outcome will be produced.
Longtime readers know, the variables (or inputs) we use to measure the health of the economy is the data; and while investors don’t control the data as a turkey’s diet would be, in being keenly aware of the aggregated body of data, and understanding how to interpret it, it gives us:
- An understanding as to whether or not the overall economy itself is a healthy heritage gobbler or a much less healthy production bird more prone to infections, heart disease, etc.?!
- An opportunity to seek out more probable healthier options (opportunities)
Each month we make all efforts to provide readers with the most pertinent data points that have been reported since our previous note, we also hold no secrets in letting readers know we utilize the services of Hedgeye Risk Management who we to believe to be the best aggregators, interpreters, and educators of the data on Wall Street.
Recently, in educating newer subscribers on their proprietary Real GDP NowCast model, Hedgeye financial sector head and Sr. macro team member, Joshua Steiner had this to say:
“As a reminder from a Nowcasting standpoint what we use is a Dynamic stochastic nowcast process whereas data becomes available it drops into our model, our estimates are updated”
Stressing the model is not a typical static wall street model, it moves with each new entry giving us a much better idea as to the directionality and rete of change of the aggregated data. Their model rolls higher frequency data like initial jobless claims (reported weekly) up into monthlies, then they roll monthly data (such as MBS mortgage purchase applications) up into quarterlies in an effort to analyze:
“… the delta change in the sequential quarterly numbers obviously all year over year”
To Steiner’s more pertinent point:
“of the 30 features, approximately 20 are trending worse on a sequential basis, 10, a little bit better for reference.”
Steiner was very quick to mention: “this does not account for our dynamic and proprietary weighting system”, as a reminder to those unfamiliar with how a NowCast model works, for an input like Real PCE YoY would likely carry a much greater weighting in the model than say, non-residential construction spending.
Why?! Real personal consumption expenditures are the primary measure of consumer spending; and consumer spending represents nearly 70% of the economy, so on the level of importance, it should have a larger weighting than something less impactful.
Read that again, comprehend it … roughly TWO THIRDS of the inputs that flow into Hedgeye’s NowCast model are trending WORSE on a sequential basis, and they are as follows: (note: Real PCE leading the way)
Real PCE, Headline Retail Sales YoY, Retail Sales Control Group YoY, MBA Mortgage purchase Index YoY, Total Employees Nonfarm Payrolls YoY, Aggregate Hours Worked YoY, Aggregate Labor Income YoY, Monthly initial Jobless Claims YoY, Consumer Confidence Index, Industrial Production YoY, Capacity Utilization, Core Capital Goods New Orders YoY, Factory Orders YoY, Nonresidential Construction Spending YoY, Residential Construction Spending YoY, ISM Manufacturing PMI, ISM Non-Manufacturing PMI, Exports YoY, Imports YoY, Core PCE Deflator YoY
At the same time, it’s not as if the other 10 doing “a little bit better” are knocking the cover off the ball. In some cases, it’s a marginal bounce off historical recessionary levels. One such point is if you consider the number of times, we’ve discussed the NFIB small business optimism index in the past 4 to 6 months?! This past month it accelerated from 91.30 to 91.60, a 30-basis point delta! It should be an easy concept to understand that bouncing a whopping 30-basis points off a data point that’s already crashed isn’t the sign of an “all clear ahead”.
It’s more likely a sign we’re staring at a factory farm production turkey that’s so top heavy it can’t hold itself steady and is sick with an infection; some might argue putting it out of its misery to be the more humane thing to do.
If only …
… that’s where the data stopped, but it’s not!
The consumer continues to be weak with November U.S. Consumer confidence slowing to 100.2 v. 102.2 in October with both “Expectations” and “Present Situation” decelerating to 74.5 and 137.4, respectively.
Redbook Weekly Retail sales oscillated a bit as investors attempted to cling to a late November pop of +10.4% YoY vs. +7.5% pre-Thanksgiving week. Early December however, revealed a Turkey Day hangover with a gut-wrenching reality check +5.7% YoY vs. +10.4% the previous week. While +5.7% was one of the worst data points for the series in nearly 2 years, it appears as if Christmas shoppers came to the rescue as Redbook weekly retail sales slightly bounced sequentially from +5.7% YoY to +5.9% YoY then finally +7.6% YoY
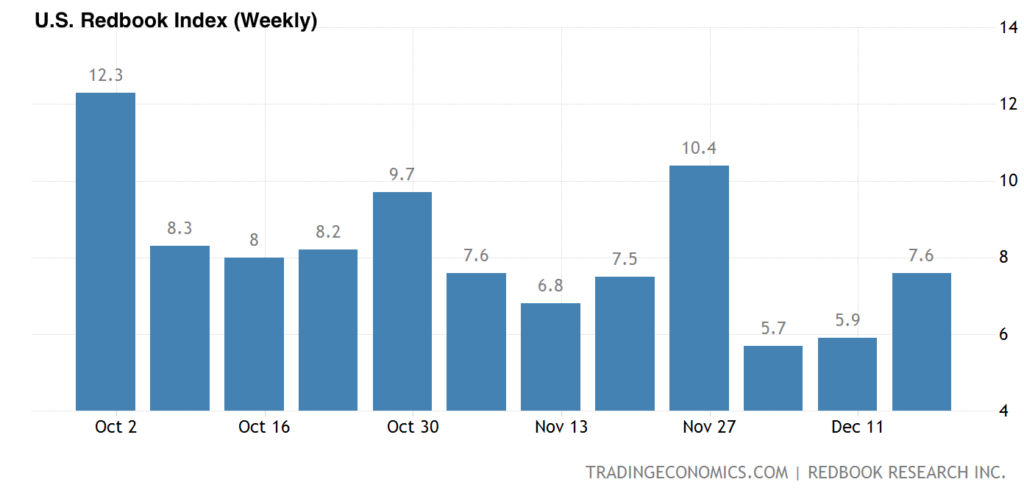
Though, given the downward trend and weekly data hitting a near 2-year low, it should come as no surprise U.S. November retail sales slowed -0.6% MoM vs. October’s +1.3% MoM increase.
At the end of the day, retail sales are clearly SLOWING, despite some of the largest discounts retailers have ever offered, which began in AUGUST/SEPTEMBER. This is an extremely important point to note, why?!
- Sharply discounted sales pulled demand forward and the trend is still weakening
- Inventories remain at unprecedented levels
- The US consumer is clearly running out of money, while those considered “more affluent” have also cut spending SHARPLY
December’s most recent data dump screamed it:
- The most recent Consumer spending data rose a single basis point 0.01% MoM, coming in at a paltry 2% YoY
- Disposable personal income remains negative at -2.5%
- Savings as a percentage of disposable income registered 2.4% (decade lows)
- LUXURY GOODS CONSUMPTION CRATERED TO NEGATIVE -7.4% YoY
Read point 3. and d. again … everyone is cutting back, just as we said they were last month when discussing the proper read-through in regard to Walmart’s data:
“Walmart’s solid quarter should not be confused or taken as a sign that the “consumer is healthy”; the disparity between Walmart and Target’s results are literally screaming more and more consumers from multiple income brackets are looking for deals and discounts on NECESSITIES like food.”
Do you remember our old friend CarMax ($KMX) and what we wrote in April’s section titled, “Here my words that I might teach you”?! There we noted:
“Auto Sales were down -24.90% in March (CarMax: $KMX has been a BIG warning to investors)”
Today the data continues to tell you more of the same!
CarMax ($KMX) just reported adjusted earnings of $0.24. Wall Street average estimates compiled by Bloomberg were at … wait for it folks … $0.65; that’s a 63% MISS (I want you to keep the size and scope of this MISS top of mind, for “consensus” is who most people pay … more on this below)
Good news though, individuals with credit scores north of 750 are being offered 9% interest rates on the purchase of a new car as their best rate … NINE PERCENT! (Yes, I’m being sarcastic, there is nothing good about this news). It is decimating the auto business and will continue to choke auto finance companies like Ally Financial ($ALLY) & Credit Acceptance Corp ($CACC) as delinquencies explode.
Consider recent data out of Public Auto ABS, Bill Ploog as recently pointed out by a @GuyDealership, shows a sharp acceleration in accounts 60 days PAST DUE: November 2022 subprime loans (501-600 credit scores) are up to 5.9% delinquent vs. 4.3% November 2019 (pre-covid reading gives a cleaner comparison) while Deep Subprime loans (300-500 credit scores) have just touched 8.2% vs. 5.9% in November of 2019.
Collectively, these categories of make up roughly 23% of all public auto loans (ABS) … what could possibly go wrong?!
And just as CarMax has and continues to foreshadow the misery now visible to anyone with a pulse in U.S. auto markets … Last week’s earnings from Nike ($NKE) and our old friend FedEx ($FDX) are singing the same song we’ve been belting out for the last 6 to 8 months; the consumer is SLOWING.
Some of you reading may be thinking Nike ($NKE) blew Wall Street estimates away (of course it’s what Jim Cramer spewed), and on the surface we won’t argue, they reported $0.81 vs. the street’s $0.65; the sneaker business rapidly accelerated! HOWEVER, there’s still a $2.8 billion dollar elephant in the room so few are discussing. Literally, it’s inventory stuffed in warehouses around the globe (mostly in apparel).
Last quarter they had a $3-billion-dollar excess inventory issue, today it’s a $2.8-billion PROBLEM. The read through here tells you that in the throes of the biggest discounts in retailer history, one of the most iconic apparel brands around the globe can’t chew through a fraction of what amounts to be an epic inventory problem. It’s telling you the consumer is done, they’re tapped out, even at steeply discounted prices.
Full disclosure, Nike is a great company which Hedgeye retail analyst Brian McGough has on his long bias list. However, McGough can pair trades for hedge fund clients like long Nike vs. short the XYZ apparel company Nike attempts to stuff their inventory with (shifting the PNL problem to someone else); either way, it still screams “slowing consumer”, whether Nike gets stuck with their inventory or resellers like Footlocker, Kohls, etc. take the hit, it’s a problem and a VERY BIG ONE!
Additionally, FedEx ($FDX) just told the world there are far fewer Amazon boxes being carted around these days as they reported miserable volume metrics with domestic express volumes down -15% YoY vs. the 11% we reported to you last quarter; ground volumes were also down -10% YoY vs. -3% last quarter. They also told you that they’re cutting capacity! While taking planes and trucks out of service may be a short term positive for them, like Nike, it’s also screaming “slowing consumer”.
Neither Nike or FedEx is suggesting that they are staring at a strengthening consumer, they’re preparing for the exact opposite; and it’s a road that leads to the same place … LAYOFFS! Less planes and trucks to drive equals fewer drivers and pilots necessary to drive or fly them, reducing the need for mechanics to service them, manpower needed to load and unload them, and gas necessary to fuel them! You’ve just been given an education on how one says demand destruction without saying the words, demand destruction.
Think about how many workers, up and down the entire supply chain, are affected by just a few companies … BUT IT’S NOT JUST A FEW COMPANIES! We’ve been outlining! Last month we outlined:
Net net, we’ve now seen more than 120,000 layoffs to date in the tech sector, exceeding the number of job losses seen during the “Dot.com” bubble of the early 2000’s, which eclipsed 100,000 … and while we’ve just barely begun to scratch the surface of layoffs to come, the Fed has already conceded job losses will be collateral damage in an effort to slow the economy down.
Meaning, even as job losses tick up the Fed won’t alter their path as they will view this as “expected”.
The best analogy that comes to mind regarding what we’re currently witnessing in labor markets is the sound one hears when ice and snow begins to crack just before they’re about to get crushed by an avalanche … at first things happen slowly, then once in motion, the speed at which snow, and ice falls increasingly accelerates destroying just about anyone or thing that gets in its way!
There is no stepping in front of an avalanche! The cycle is much like gravity, it just is … and there is little to nothing that anyone can do in an effort to stop it; and at this point the carnage will be ugly.
Now you can add semiconductor company Micron $MU to the list of companies whose earnings continue to decelerate while the company is now cutting roughly 10% its workforce!
November’s ADP Employment data fell to +127k, while Non-Farm Payrolls registered +263k, which was better than “expectations” of +200k, though a slowdown from October’s +284k. The ADP data is at its lowest level since January 2021 and Non-Farm Payrolls touched their lightest levels in nearly a year.
We also had the household survey come in at -138k, and weekly jobless claims mildly deteriorating over the month +230k vs. +226k vs. +216lk vs. +211k sequentially WoW, with “Continuing Claims” accelerating to 1.671mm, its highest level in just under a year.
Make no mistake, the labor markets are slowing … and it’s happening at a more rapid pace than people think!
While we won’t belabor this issue there are a few important items to remind readers of; we’ve been stressing these points for quite some time:
- “Labor” is the latest of late cycle indicators.
- “Layoffs” are accelerating.
- “JOLTs data” has been a poor indicator for many reasons, one being multiple listings for the same position.
- “The Fed” KNOWS job losses will be necessary to temper inflation.
- The losses in the data they look at won’t be enough to derail the Fed’s current path until it’s too late
- There’s been a widening chasm between the “establishment survey” and “household survey” since March.
Be it, poor seasonal adjustments, or just the establishment survey’s inability to differentiate full-time employment from part-time or individuals holding multiple jobs in an effort to keep their heads above water., as Fed Chairman Powell has stood before the American public discussing the strength of the labor markets, a very recent report out of the Philadelphia Fed now acknowledges what we’ve been saying for nearly 6 months … basically the data the Fed’s been looking at is bad!
Two quotes directly from the Philadelphia Fed’s paper:
“In the aggregate, 10,500 net new jobs were added during the period rather than the 1,121,500 jobs estimated by the sum of the states; the U.S. CES estimated net growth of 1,047,000 jobs for the period.”
“Our estimates incorporate more comprehensive, accurate job estimates released by the BLS as part of its Quarterly Census of Employment and Wages (QCEW) program”
Net net … US payrolls have been OVERSTATED by AT LEAST 1.1 MILLION JOBS (and likely more) … you truly just can’t make it up folks.
This information alone should be enough to tell you what type of shape the economy is in … we’re being served a sickly infected production turkey that’s been eating poorly for too long. Though as long-time readers know, we do our best to be as comprehensive as possible in an effort to understand the full picture?! Does the bird have the ability to recover or is the proverbial chopping block imminent?!
Screaming recession
Unfortunately, “manufacturing” isn’t painting any better of a picture of the economy with the most recent Chicago PMI posting an abysmal number earlier this month, coming in at 37.2 vs. October’s 45.2. New orders declined from October’s 39.2 to 30.7 while prices paid collapsed from 74.8 to 66.2.
Additionally, November’s U.S. Manufacturing ISM went contractionary, coming in at 49.0 vs. October’s 50.2 with business backlog slipping more than 10% MoM to 40.0; prices also fell MoM to 43.0 vs. 46.6. All of the aforementioned suggests future demand is anemic (not a good sign).
U.S. Industrial production for November also decelerated -0.2% MoM down from -0.1%; +2.5% from +3.3% on a YoY in October.
If there is any glimpse of light shining through all of the darkness right now, it’s in the services side of the economy with ISM U.S. Services accelerating to 56.5 vs. October’s 54.4 with business activity/production increasing +9% MoM, to 64.7. Prices also slowed from 70.7 to 70 while inventories remain contractionary at 47.9. (Contractionary being below 50) Remember, I said glimpse … currently it’s an anomaly, but it’s something.
The housing markets continue to deteriorate with further deceleration in almost every metric. U.S. Case Shiller home prices decelerated AGAIN, registering down -1.2% MoM and +10.4% YoY (it’s 3rd monthly sequential decline).
Both Housing “starts” and “permits” also decelerated with starts down -4.1% MoM and -32.1% YoY (as Hedgeye Director of Research notes: “it’s 9th consecutive month of declines and the lowest level in 30 months”).
Permits (as we’ve noticed in the past foreshadow starts) continue to materially deteriorate declining -7.1% MoM, and negative -29.7%. For those who don’t understand building, you LEGALLY can’t have a start without first acquiring a permit. So, it should come as no surprise November’s existing home sales were also down -7.7% MoM to a Seasonally Adjusted Annual Rate of 4.1mm units.
For months we’ve been highlighting the decline in homebuilder confidence as measured by the NAHB Wells Fargo HMI. From the below graphic one can see December’s deceleration to 31 marks the 12th consecutive monthly decline: a mere stone’s throw from April 2020’s pre-pandemic low.
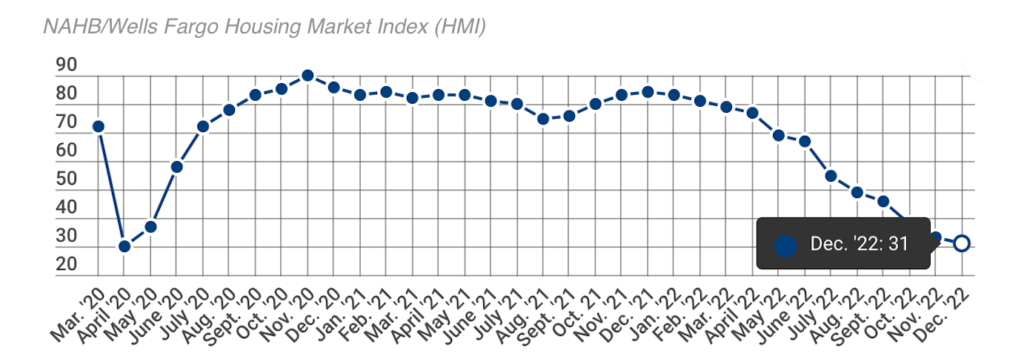
Another important note from Hedgeye’s Director of Research Daryl Jones, “From a Housing Start perspective, we remain above prior trough levels … but are near levels that typically coincide with the start of a recession”.
Currently, there’s a plethora of economic indicators screaming recession … but these indicators worry me much less than the many market signals suggesting our proverbial turkey’s life is on borrowed time!
There are ALWAYS signs
For years we’ve discussed the fragility of the financial system; unfortunately, we’ve been right. In 2018 we not only warned readers to be cautious when “making assumptions” reminding readers of the Bond Anticipation notes debacle of 2008 when wall street marketed said “notes” as instant liquidity/ “money market alternatives”, only to have them freeze redemptions; but we also educated investors on the hidden dangers and structural flaws of embedded in “Passive” Bond ETFs.
Our words proved true in February/March 2020, though went largely unnoticed due to a blank check the Federal Reserve handed BlackRock in order to bail themselves out (while also backdating the junk bond buying program two weeks to conveniently include Ford’s ($F) recently downgraded junk bonds (at the time)).
A mere 3 weeks prior to the February 2020 collapse we also penned, “the Importance of History…and boy is it “rhyming” today”, listing a host of warning sings flashing red.
If you think back to past market crashes, certain larger “events” most often preceded significantly far-reaching drawdowns in both credit and equity markets.
- In 1998 the Long-Term Capital bailout was roughly $3.6 billion in size
- December 2001, the Enron bankruptcy was $63.4 billion
- September 2008, the Lehman Brother’s bankruptcy involved roughly $600 billion dollars
- The CDO debacle of 2008 was $400 billion in size
- The government bailout of the GSEs (Fannie Mae & Freddie Mac) totaled $187 billion ($116 & $71 billion respectively)
- September 2019 the Interbank lending Repo markets exploded exposing stress in the system; we warned readers of the severity and ramifications both here & here (while Fed officials said, it was no big deal)
It took time for these events to ripple through the system, as it takes time for markets to understand where counterparty risk lies and as the saying goes, “where the bodies are buried”. Hedge fund portfolio managers, private equity funds and pension funds aren’t going to be in a rush to immediately raise their hand to let the world know they’re buried in X,Y,Z investment and on the brink of insolvency, they’re going to try to unload/unwind certain investments or work out a credit line with a lender before disclosure is mandatory.
Lehman brothers claimed till their last breath that their liquidity position was sufficient. Most, when in a position of despair, are absolute liars.
Over the years we’ve also noted the action of a portfolio manager “gating their funds” (i.e., freezing their investor’s ability to withdraw their investments) to be a sign of extreme market instability. When markets are functioning properly, unless a manager blows themselves up on an outlandish “bet” ignoring all risk management parameters, this shouldn’t happen.
“Gating” funds typically occurs during a critical liquidity event … and the grenades today are exploding at a rapid pace.
For example, we’ve now witnessed nearly $2.2 TRILLION dollars evaporate from what was once a $3.1 trillion-dollar Crypto market. Crypto exchange FTX is under investigation for fraud as tens of billions of dollars are currently “missing”, their CEO, Sam Bankman Fried has been arrested.
As the investigation gets under way, FTX had nearly 100 shell companies including Alameda research who’s shuttered their doors. FTX also donated tens of millions to political parties, while crypto as a whole threw money around in the form of advertising revenue like it was water! Voyager Digital, FTX, Genesis Blockfi, Celsius Network, Crypto.com, have all filed for bankruptcy protection or on the verge of it … that money is now gone; who’s filling that massive revenue gap for media outlets?! Again, think of how it’s all intertwined.
We’ve also witnessed an outright collapse in the Terra/Luna crypto currency, crypto hedge fund Three Arrows Capital has declared bankruptcy and SkyBride Capital has now … “suspended redemptions” (gating their fund).
Speculation also continues to swirl around the liquidity of the largest crypto exchange Binance, as they’ve recently been hit with $6 billion in redemptions and their auditor, Mazars (one of the largest in the world), has stopped working with them.
We’re currently experiencing a collapse in liquidity which is crushing the riskiest of markets first. While mainstream markets have been crashing, as more and more liquidity is sucked from the system, it will no longer be the fringe markets freezing redemptions … this will bleed more and more into those investments considered mainstream, as it already is.
When liquidity dries up … part deux
Here’s a reminder of what we wrote in 2018
“Do you remember Bond Anticipation Notes (BAN)? If not, these were products sold as “money market alternatives” leading up to the mortgage crises; they were Triple-A rated and sold as “liquid”, yielding slightly higher than money market funds (at the time). The “catch” was, these securities had relatively long maturities, but so long as the short-term paper markets were “healthy”, investors had the ability to “roll” these investments every 30, 60 or 90 days…
Until…
Liquidity dried up in the short-term paper market when the housing crises hit in late 2007 (‘hat tip’ to GE). The ability to roll these investments literally disappeared overnight. These notes then turned into much longer-term investments than the money markets alternative investors came to expect, defaulting to the actual stated “maturity”.”
You might be thinking to yourself that you don’t care about Bond Anticipation Notes, your eyes may be rolling as you don’t own crypto, believing it can’t possibly adversely affect you?! To which I’d again remind readers to be careful with your assumptions! Respectfully, you have NO IDEA where the counterparty risk lies, you don’t know “where the bodies are buried” and … they ALL LIE.
BREIT
Until recently, the largest buyer of single family residential real estate in the country had been Blackstone through their private in-house REIT labeled BREIT. At $69 billion in size, if it were a publicly traded, I believe it would be the 5th largest REIT in the country.
Initially, entry to this investment was limited to accredited investors requiring a minimum investment of $250k, however, within the last few years, given its growing popularity, this product was marketed by large wire-house, wall street firms as a liquid “can’t lose” product; of course, people wanted in, minimums were dropped to $25k, luring the smaller investor … they came in droves and with it’s fee structure, wall street got PAID.
Similarly, to the Bond Anticipation Notes (BAN) we’ve discussed in the past, which were sold to extremely conservative investors pre the 2008 crash as “money market alternatives” (until liquidity crashed in the short-term corporate credit markets), BREIT was marketed in a similar fashion.
With artificially low interest rates, and the limited appraisal process of the private REIT market, the combination created a smooth, steady climb in real estate markets and thus, real estate investments! Again, wall street assumed (there’s that word again) these markets to be unstoppable, placing these same “risk adverse individuals” into these funds.
We’ve been educating monthly readers on the recent carnage taking place in real estate markets for nearly a year, and clearly, it’s not just the individual home buyer or investor that’s being adversely affected.
Blackstone, who supposedly has access to all sorts of liquidity from lines of credit to CMBS they can sell, has just GATED their BREIT funds for redeeming shareholders (again, so much for assumptions). Blackstone has said this gate is temporary … until they can find more liquidity to meet redemption requests.
Think about this, Blackstone does have access to other forms of liquidity, why have they chosen the route of freezing redeeming investors?!
Ironically, the second largest private REIT, Starwood’s SREIT, has recently gated their doors, too. Starwood’s SREIT sits at roughly $14.6 billion in size.
I want you to think about this long and hard … If both the two largest buyers in real estate markets (Blackstone and Starwood) are both in need of liquidity, who are they selling to in size?! And who’s redeeming?! We don’t know but it’s got to be a large player … Japanese or U.S. pension funds, big boys in need of capital to save other investments now underwater who haven’t taken their marks to market yet is our guess.
Regardless, what would you do if a bank told you they were going to freeze your ability to withdraw your cash from your bank account?! Even if just for a few days to a week?! ANSWER: you would move your money out of that institution as fast as you possibly could! (it’s called a run on a bank, we’d suggest watching “Marry Poppins” should you have questions)
Given the BREIT scenario, redeeming shareholders are now likely getting in line to access their capital creating a circular effect … forcing companies to sell properties in order to generate liquidity to satisfy redemption requests, rinse repeat … as the value of the portfolio declines and properties are properly marked to market, they’ll need to redeem more properties to satisfy additional requests (now that they know gating is a very real scenario).
Though, what happens when the pool of buyers is either super small or don’t exist?! What happens when the capital isn’t there for firms to borrow as financial institutions tighten their credit lines?!
At the same time, we haven’t even broached the enormous disparity between the values private equity continues to place on their real estate assets vs. those placed on similar comps of the publicly traded companies. In the end, marks to market need to be taken and, in our opinion, they will be brutal in the upcoming quarters. (See: Carlyle Capital 2008)
Again, this is a liquidity issue … the Fed is tightening credit conditions while raising rates and shrinking their balance sheet pulling liquidity from the system, M2 is shrinking at an unprecedented rate, balance sheet are contracting, banks are pulling back on lending (credit), it all leads to less liquidity and collateral which is ultimately a large unwinding of leverage.
Crypto … profitless tech … private REITS … private equity … PENSION FUNDS … they are ALL searching for liquidity! It’s what happens when the cost of capital explodes as it has!
We’d suggest the “Gating” that’s currently occurring to be akin to ¾’s of the turkeys in a production house watching the other ¼ get taken to the chopping block and not think the same fate is coming their way… we’d suggest, DON’T BE THAT TURKEY!
Zero Accountability
We’ve attempted to use the Turkey metaphor in multiple ways through this piece.
We likened “genetics” to market structure … it just is until it isn’t … certain vulnerabilities come with it and human intervention can often make things worse under the “guise” of making things better. As human’s have engineered production birds, while they believe to have “solved” for a faster growing cycle and larger breasts to accommodate a human’s eating habits, they’ve created sickly birds that can barely stand, are more prone to illness, and need to be artificially inseminated to reproduce.
When coupled with genetics, inputs, or what a turkey eats largely contributes to its health. This should be important to any individuals who places a premium on their own personal health; just as the global body of data gives those of us who are hyper focused on the protection and preservation of our wealth a relatively solid handle on the “health” of the overall economy.
For years we’ve detailed how intervention (in the form of government regulation and central bank planning / policy) has created a market structure susceptible to outright freezing/collapsing. Especially in situations where liquidity is being sucked from the system; the DATA IS SCREAMING NOW ONE OF THOSE TIMES.
As we’ve detailed over the past few years, the Federal Reserve is always late and their interventions over the last 3 decades have created boom bust cycles, each larger and exponentially more dangerous; especially to those unaware turkeys Taleb describes in our opening quote; the oblivious ones.
In his book Antifragile, Taleb elaborated on this quote:
“So our mission in life becomes simply “how not to be a turkey,” or, if possible, how to be a turkey in reverse — antifragile, that is. “Not being a turkey” starts with figuring out the difference between true and manufactured stability.” ~ Nassim Taleb
Taleb is telling readers to open their eyes; be aware of everything from your surrounding environment, inputs, health, pitfalls, predators, and make a concerted effort to recognize the “difference between true and manufactured stability.”
To seriously consider what could possibly trigger what he refers to as a Black Swan event (a hidden or unexpected event that will take most everyone off guard) … Black Swan theory suggests things happen that were previously thought to be impossible or never thought of at all.
Identifying such risks is something we’ve done fairly well over the years, and today we’d suggest the odds of a such an event occurring are at levels I don’t think I’ve ever seen over my 26+ years in this business.
I want to make it clear; I am NOT calling for an imminent collapse or “crash”, but I am saying the odds that one can occur are significant given the current investing landscape, collapse in demand, evaporation of liquidity, tightening of credit, increased cost of capital pinned up against the most and worst credit quality in history … the signs (bankruptcies/gating/etc.) are eerily reminiscent of previous market collapses.
Note: we haven’t even touched on the impending collapse in corporate earnings
These dangers have the potential to adversely affect a significant portion of the investing community. We’ve worked hard this year to minimize drawdowns and firmly believe our process will mitigate/protect us from the catastrophic loss many investors have already seen this past year.
While we significantly outperformed most all asset classes this year, we don’t like closing the year down and aim to rectify this over the next few months by making improvements to our process.
Unfortunately for those who continue to believe the garbage Rodeo clowns continue to spew, consistently being wrong for years now, the outlook is bleak. Mind you, eventually, they’ll be right … markets will trough, volatility will subside, economic data will improve, and equities should begin their ascent higher (on a trending basis).
Though, where might that trough be?! Will we mean revert to pre-pandemic levels, 2008 levels or somewhere in-between?!
Fun Fact: were you aware that on average, year in and out, the U.S. retail industry averages roughly $150 billion per year (from 2014 to 2019, like clockwork; $148, $149, $148, $154, $153, $144 billion, respectively) In 2020, Covid brought that number down to a meager $91 billion, while free money from the government shot that number up to $235 million in 2021.
In the face of the consumer running out of money, wall street estimates for 2022 remain an elevated $219 billion and they continue to show GROWTH in 2023 to $229 billion (as data continues to collapse, ZERO stimulus packages as we anticipate sequential negative GDP in 1Q23 & 2Q23)
Hedgeye Retail sector head Brian McGough has been pounding the table with this data and it truly shows you how clueless and dishonest wall street is; there’s just no mathematical possibility.
The honest answer is the above question is one knows with certainty where trough will eventually be, but it’s clear most CEOs nor wall street analysts understand how to model companies through back-to-back NEGATIVE GDP quarters … and then we’ll see the resolve of the Federal Reserve.
There is a chance the Federal Reserve attempts to outright squash the “Fed-put” (Fed always to the rescue) while maintaining market stability in treasury markets as they allow for a proper credit default cycle in order to facilitate a proper long-term future expansion. If this is the case, things could get darker than even we anticipate … which has been much lower and significantly more accurate than any notable wall street firm had forecasted for 2022; as consistent readers would know!
On January 3rd, 2022, Jonathan Ferro @FerroTV enshrined 2022 wall street expectations for the S&P 500 in a tweet which can be found here:
From highest estimate to lowest, Oppenheimer’s forecast was 5330, BMO 5300, Deutche Bank 5250, Credit Suisse 5200, Goldman Sachs 5100, JP Morgan 5050, RBC (Royal Bank of Canada) 5050, Citigroup 4900, UBS 4850, Cantor Fitzgerald 4800, Barclays 4800, Wells Fargo 4715, Bank of America 4600 and Morgan Stanley 4400.
I want you to recall how badly consensus estimates for $KMX were above … they were off by 63%! Now think long and hard on who you choose to follow and represent you?! The LOWEST S&P earnings estimate from those considered the BEST, that most investor pay, was WRONG by -15% with the high estimate OFF by -30%; Only 3 out of 14 of these firms suggesting a flat to down year with the rest forecasting obnoxious positive growth … there’s simply zero accountability on wall street, your life’s savings deserves better.
While I won’t recap 15 months of our writing, we’ve been warning readers of this carnage since September 2021 … again, earmarking 2Q22 but clearly stating markets can discount phase transitions much sooner … we then wrote to readers in January warning readers that dark times were upon us…
If you’re still long risk assets, listening to the same person who’s been telling you things will recover based upon “valuation”, I’m not sure what to tell you anymore?! But there is one specific image comes to mind and sums things up perfectly…

You’re sitting in a room casually drinking coffee as the entire room is engulfed in flames around you. Given Hedgeye’s consecutive future #Quad4 forecasts, plus the current data, we’re likely staring at much more pain and downside ahead, and lord only knows from what levels most investors will be attempting to rebuilding from. If that’s you, we wish you the best of luck if you’re close to retiring!
We ask you think about the unaware turkey about to get its head chopped off, given the data, could there be the slightest chance this is you?!
Final Thoughts
While popularized by Nassim Taleb via his books, Fooled by Randomness (2001) and The Black Swan (2007), the concept of the Black Swan dates back much earlier. Until the 17th century, people had only seen “white swans”; in 17th century London, the term Black Swan was used to describe things that were thought of as “impossible”.
It wasn’t until Dutch explorer Willem de Vlamingh traveled to western Australia in 1697 when he saw a black swan, making the unthinkable, thinkable, hence the term…
I’m often perplexed … given all that’s occurred in financial markets over the last 3 decades it leaves me baffled that so many blindly follow the crowd, leading me to think there are a. those who are outright blind to these scenarios, b. those who don’t respect them or c. those who vigorously refuse to acknowledge the possibility that they exist.
As we’ve now witnessed trillions of dollars eviscerated in large cap bellwether companies like $AAPL, $AMZN, $MSFT (the list is virtually endless) … heck, Tesla $TSLA has lost 40% of its value in the last month alone … numerous bankruptcies, auditing firms walk away from multi-billion-dollar companies, while hedge funds gate redemptions is what I’m writing so difficult to conceptualize?! Again, the data is the data!
Two of the largest private REITs just gated investors from redemptions … Credit Default Swaps remain elevated, and the Fed is sucking liquidity out of the system at an unprecedented pace?!
Those working last week also just witnessed volatility (as measured by the VIX, VXN and RVX) spike, crater, spike and then collapse 8-10% in each direction on sequential days. This is NOT the sign of a healthy market; it’s as sickly a bird as they come!
As a primary mention throughout this piece has been liquidity (or lack thereof), one of the more poignant data points comes courtesy of Hedgeye; while in final edits this morning they dropped this bomb: from their 12/28/22 “Top 3 things” #1:
“Liquidity– Money continues to come out of the financial systems perpetuating the #Quad4. This week’s big data point is US M2 YoY (Nov) creating an all-time low of 0.0% YoY (data going back to 1960). This is while the road to zero has already been completed for US Commercial Bank Deposit Liabilities -1.00% YoY (Dec) and Federal Reserve Total Assets (Dec) -2.41% YoY.”
And you really think counterparty risk doesn’t exist?!
Should you watch or read any of Fed Chairman Powell’s recent speeches, there is no fed pivot coming any time soon … in their minds, history has provided them with powerful lessons, highlighting the dangers of taking their foot off of the gas too soon…
Our family eats heritage farm raised foddered turkeys freshly slaughtered for Thanksgiving, we do so because we have a choice; we believe there are health benefits over production birds; though, at the end of the day, both the production bird and foddered turkey are met with an unexpected beheading in its prime!
In a blink, the turkey’s life is ended!
Ironically, the Turkey with the best chance of survival happens to be the truly wild heritage turkey, without its wings being clipped or hindered. While this bird may be exposed to the elements with no guarantees, its free to make decisions it believes best for themselves, it eats healthy food and gets plenty of exercise. They also have the ability to fly within 8 to 14 days of being hatched, roosting in trees with keen eyesight, 3 times greater than a human with 20/20 vision, and a field of view of 270°.
If we’re going to be any turkey, we’re ok being that turkey … healthy, aware of our surroundings with perceptive vision providing it with the opportunity to live a much longer life than any production or farm raised bird!
Surviving these markets with nominal loss and fluctuation keeps us in much better position to compound and grow capital when markets eventually trough.
With the S&P down greater than 21%, Russell down close to 30% and Nasdaq down nearly 35%, it’s our belief this is just the start. With multiple #Quad4s ahead, a cost of capital not seen in the last 2 decades, the probability of a larger credit event is rising exponentially. Be aware, stay alive, don’t just keep your head but keep it connected to your body … be the Wild Turkey!
Good Investing,

Mitchel C. Krause
Managing Principal & CCO

4141 Banks Stone Dr.
Raleigh, NC. 27603
phone: 919-249-9650
toll free: 844-300-7344
mitchel.krause@othersideam.com
Please click here for all disclosures.

