

In This Article

It’s all over but the shouting
It’s meaning is universally understood, while its origin is often disputed. The idiom, “it’s all over but the shouting” refers to a certain event, decision, or situation, that are still in progress, but the outcome is as near certain as it gets.
The “shouting” can be two-fold, either celebration or public outcry following the announcement of the eventual, and inevitable final decision. Given there are two sides to this coin, both a winner and a loser; one side might celebrate while another cries out in displeasure, which has led to the variation, “it’s all over but the crying”.
As noted above, there is a small “dispute” re: the idiom’s origin which often falls between a. an American political election which took place in the early 1800’s or b. a Welsh sportswriter for The Sporting Magazine, by the name of Charles James Apperley in 1842; Apperley’s version being ever so slightly different; his version being, “it’s all over bar the shouting”, as in … the outcome has been decided so the only thing left to do is, shout (in either agreement or disagreement).
We freely admit our research found no definitive origin, so we’ll refrain from declaring one … though at the same time, the multiple variations all work given where we’re headed with this piece.
There are very few definitive absolutes in the world of investing. We believe there’s the data and how markets trade to the data, and then there are outside influences and narratives that show up daily in an attempt to prolong/defy gravity. Given our experience over the course of 27 years, gravity eventually wins.
Throughout our career in this business, each cycle has provided us with outside influences. Some remain constant, like the Federal Reserve; one way or another, we know we have to plan for them, and preferably with a healthy understanding of the data (and their methodology) we front run them given their most probabilistic move; adjusting on the fly should they throw us a curve ball. Funds gating redemptions, as we’ve talked about recently, is another one of these constants; in understanding current liquidity issues, things like this SHOULD BE anticipated; counterparty risk being another, so on and so forth…
Other extraneous circumstances do morph over time. For example, the rise of passive ETFs and target data funds have created a monster that is so large, we’ve got to be extremely mindful, and risk manage around certain calendar events throughout the year, such as large passive index rebalances.
Then there are the known unknowns lurking out there … you know they exist, but you’re not quite sure exactly what they are or how they are going to manifest or reveal themselves.
Collectively, this creates mini cycles within a much larger cycle! This is the foundation of Hedgeye’s trade, trend, and tail models; be it company specific or a much larger macro cycle.
In today’s note, we’ll detail the data, as we always do; for the data is always our north star. We freely note, we may not get every short-term trading cycle right, but so long as we get the directionality of the data correct, which is what drives markets, over time we should get the overall trend correct. This is what back tests, providing us confidence in saying, “it’s all over but/bar the shouting/crying”, depending on which side of the data you’re on.
With this in mind, when the largest players in the industry get caught offsides (and we’re talking really offsides), the known unknowns often rear their ugly heads exacerbating volatility and in turn, these shorter-term cycles. As we conclude, we’ll discuss a new dynamic that’s unlike anything I’ve seen in my career, at the same time, it’s something we’ve now got to be extremely mindful of.
Having said all of this, in the face of these new dynamics, when gravity does win, we’re of the belief that many should go to jail. We’re not so naïve to believe they will, but at the same time, the insanity that’s transpired over the last few weeks is nothing but outright market manipulation via options markets. As always, we urge you not to just take our word for it, below we’ll provide you with the data, the definition of market manipulation per the Securities and Exchange Act of 1934 and allow you to decide … to us, it screams “orange jump suit”?!
This type of behavior only happens in the most desperate of times and the data is screaming desperate times, so let’s get into it.
An outright train wreck
Manufacturing data continues to worsen across the board:
- U.S. December ISM Manufacturing decelerated to 48.4 from 49.0 in November; remaining sub 50 = contractionary
- New orders decelerated AGAIN to 45.2, from 47.2, a data point which often foreshadows poor future demand
- Empire State Manufacturing survey for January literally IMPLODED, coming in at a God awful -32, vs December’s -9.0 (THAT’S DECELERATION)
- U.S. industrial production for December fell -0.7% MoM, equating to a paltry +1.6% YoY growth rate
- This is an abysmal data point and is likely headed to 0.
- The ISM Manufacturing Prices Index also fell, December’s reading being 39.4.
- As Hedgeye Director of Research Daryl Jones noted on this particular data point, “It is now down nearly 48 points in nine months, which is the longest stretch of declines since 1974 – 1975”
This data comes to us as Inflation data continues to scream disinflation to outright deflation…
U.S. ISM services for December dropped and is now a contractionary 49.6 (below 50), after crashing 6.9 points from November’s report of 56.5 with new orders (again, more foreshadowing of things to come) falling roughly -20% to 45.2
Buzz words continue to include:
- slowing business conditions
- continuing inflationary pressures
- headwinds from higher rates
What’s obvious to all at this point is headline CPI continues to decelerate, most recently to +6.5% YoY with Core CPI coming in at +5.7% YoY. What’s taking place under the hood of this number is less discussed by others, but extremely relevant.
One of the larger components leading the decline in CPI was used cars, which was down -8.8 YoY. And while December’s Manheim Used Car Index increased +0.8% MoM, it’s decelerated -14.9% YoY. And as we’ll discuss below regarding credit data (sub-prime auto loan delinquencies), these decelerations are the largest declines in the history of their respective data series.
Additionally, we had a significant deceleration in U.S. PPI for December with it coming in at +6.2% YoY, vs. +7.3% last month; down roughly 40% from its 2022 peak. But again, we know disinflation/deflation is here, we’ve been screaming it for well over a year now and the data continues to decelerate, we know @Hedgeye #Quad4 equals both growth and inflation decelerating simultaneously (which it clearly is).
As we’ve noted in the past, while we’ve been dissecting the data under the hood with help from Hedgeye’s Josh Steiner and their macro team, the rest of wall street can now agree with what’s too obvious to ignore.
However, we have a few different dynamics colliding here … the first dates back to a concept we’ve been trying to explain for some time now, which is lead/lags in the data don’t necessarily reflect current reality (it’s backwards looking), and in this case, the reality is that while inflation is falling, it’s not declining at a fast enough pace to alter the Federal Reserve’s path, nor is it decelerating where the majority of Americans need it to the most.
The second & third dynamics deserve their own sections in the piece but are 2. an outright earnings recession staring us down with 3. being straight up market manipulation by larger players caught completely offsides.
Again, one of the largest contributors to the decline in CPI came from the deceleration in used cars; you’re not buying a used car every day … but you are eating multiple meals daily (hopefully), which means you are buying food … and frustratingly, both the food at home and food away from home components of CPI were up double digits at +10.4% and+11.8%, respectively.
You also heat/cool your home daily with fuel oil, electricity, and utility gas service being up 41.5%, +14.3%, +19.3%, respectively.
Speaking of homes … the shelter component of the CPI accelerated to +7.5% YoY and was the biggest positive net contributor to the data set; shelter should continue to provide upward pressure on the data set for some time, just as we said it would in June of 2022:
For example, while housing data, as measured by the Case Shiller National Home Price Index peaked last July/August, history suggests a 12/15-month lead lag before that data shows up in the CPI report; meaning there is still a very high likelihood that the “SHELTER” component of the CPI (representing 33% of the overall index) will continue to provide upward pressure on the primary data point the Fed uses to base its interest rate policy off of.
Additionally, we noted this in our 3Q2022 note:
Shelter’s 12–15-month lag as it flows through into the data should continue to act as a headwind for another 9 months or so; the Food component isn’t likely to lighten up much any time soon either.
Seems prescient?!
Having peaked July/August of 2021, and given a 12-to-15-month lead/lag that would then have the data rolling over around now … Unfortunately, as we’ve also noted in the past, the housing market remained at obnoxiously elevated levels for nearly 9 months before it started to crash; meaning … the shelter component of CPI could/should remain historically elevated for another 5-7 months before it becomes a net negative.
Housing
Euphoria returned to the TV pundit Rodeo Clowns over the past few weeks given a mixed bag of housing data … and while there may be some room to celebrate, the jury is still out?!
For starters, the Case-Shiller HPI saw yet another MoM decline or -0.5% while November’s pending U.S. Home sales registered one of the worst prints on record (inclusive of the GFC) of -37.8% YoY.
On the positive side, mortgage rates have ticked down slightly, with the 30-year fixed mortgage recently touching 6.15%, which remains greater than a 100%+ increase over the 3% rate last seen December of 2021, but a deceleration from October’s peak of 6.94% none the less.
On the heels of this move in rates, the NAHB series we’ve been writing about over the past 6 months saw increases in all three metrics for the first time since December 2021.
While the press release from the industry insiders screams “the lows are in”, we’d casually remind you that just about anything “bounces” when thrown from a high enough point; from the report:
“The HMI index gauging current sales conditions in January rose four points to 40, the component charting sales expectations in the next six months increased two points to 37 and the gauge measuring traffic of prospective buyers increased three points to 23.”
At the same time, the report also states:
“… many builders continue to use a variety of incentives, including price reductions, to bolster sales.”
While we may sound like a broken record, anytime you hear “variety of incentives” and/or “price reductions”, please thing “margins are getting crushed”.
One additional data point wall street’s been clamoring over were the recent MBA mortgage purchase applications, for they posted what appeared to be a “staggering” rebound, jumping roughly 25% or 40 points from 159 to 199.
While we consistently note, “the data is the data” … we also emphasize the importance of contextualizing it. With this in mind, is there anything that could have occurred the previous 2 weeks which may have allowed such an acceleration to take place?! There is no question that the previous two weeks were bombs, historically, these are both soft weeks to begin with … for a reason?! Why?! Ironically, they coincide with Chanukah, Christmas, and New Year’s. This year, there was an added bonus in the form of massive snowstorms and blistering cold weather literally blanketing a significant portion of the country!
If we’re being intellectually honest rather than grasping at straws, just as we discussed regarding the overall “trend” in the labor data above, when considering seasonality, the last three weeks hasn’t altered the overall trend in housing data (as can be seen in the illustration below):
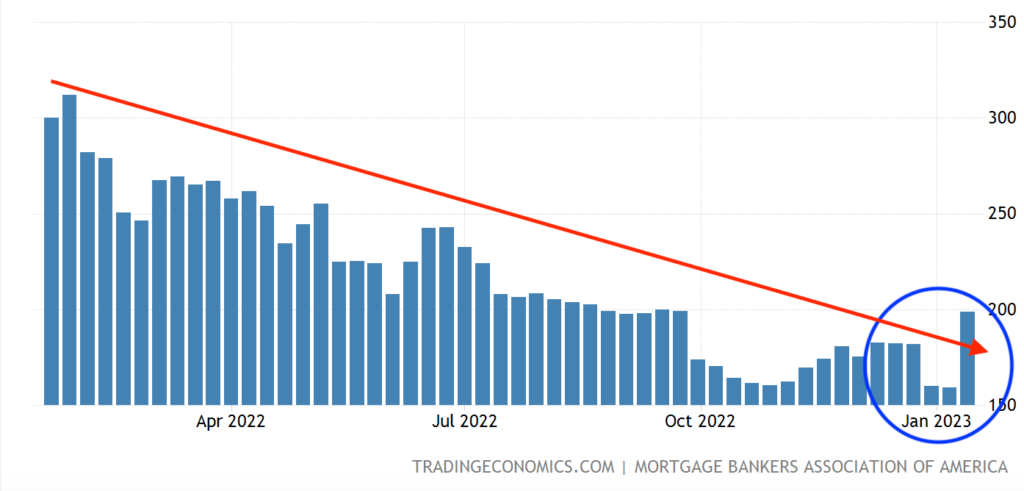
Understanding the importance of trade vs. trend is extremely important! We utilize @Hedgeye research’s trade and trend methodology defining trade as 3 weeks or less and trend as 3 months or more.
With this in mind, the more recent housing data continues to decelerate with:
- December Building Permits slowing to 1.33MM, from 1.351MM
- December Housing Start slowing to 1.382MM, from 1.401MM
- December Existing Home Sales slowing to 4.02MM SAAR, from 4.08MM MoM
In regard to December existing home sales, that’s down -34% YoY; it’s the 11th straight month of declines for this data set and sits at the lowest level since November 2010 (we’ll again remind you that in 2010 home sales were appreciating from their trough, today we are likely still heading downwards towards eventually troughing).
With this being said, we will be watching the housing data and related equities very closely, maintaining an open mind. As interest rates do fall, mortgage rates tend to fall with them, traditionally making housing a solid #Quad4 performer. We’ll see how this dynamic plays out given the newly elevate cost of capital structure, accelerating unemployment, and tapped out consumer … but still … we remain open minded, but we’re not there yet.
Earnings recession
We continue to see weakness from the U.S. consumer which ultimately shows up in corporate earnings but is again, often foreshadowed by retail sales … we can’t stress the importance of understanding how the data flows, it’s one of the reasons we spend so much time trying to educate readers; the signals are often right in front of you, just because markets don’t immediately trade as you think they should in the short term, it doesn’t mean the longer term trending cycle isn’t already in motion! Cycles take time.
This month we’ll again note yet another significant slowdown in U.S. Redbook weekly retail sales, as it increased +5.7% YoY vs. the +10.2% YoY the final week of 2022 … decelerating further to +5.0% YoY as we moved deeper into the month (+5.0% YoY representing a new post-pandemic low and consistent with what we’ve been saying, the data keeps deteriorating).
Again, Redbook weekly retail sales often foreshadows the monthly retail sales data, which it did as December U.S Retail Sales came in worse than expected at -1.1% MoM and +6.00% YoY, significantly below the full year growth rate of 9.2% for 2022.
Just as retail sales have slowed, inventory has been building; we’ve been highlighting the massive inventory builds in the system; one of last month’s specific call outs were Nike ($NKE):
Some of you reading may be thinking Nike ($NKE) blew Wall Street estimates away (of course it’s what Jim Cramer spewed), and on the surface we won’t argue, they reported $0.81 vs. the street’s $0.65; the sneaker business rapidly accelerated! HOWEVER, there’s still a $2.8 billion dollar elephant in the room so few are discussing. Literally, it’s inventory stuffed in warehouses around the globe (mostly in apparel).
Inventory builds continue to show up in the data with November wholesale inventories in the U.S. being up another +1% MoM; and 21% YoY.
Nike’s not alone … and as the consumer weakens, retail sales slow, massive discounting occurs, and margins compress; and currently we’re at the point in the cycle where the massive earnings recession we’ve discussed becomes more obvious; this is the second major dynamic taking place in markets right now, for example:
JW Nordstroms $JWN preannounce earnings last Thursday night with no more than 10 days left in the quarter and their data is screaming bloody reality:
Previous guidance from management was $2.30 to $2.60; new guidance as of Thursday’s release is now $1.50 to 1.70 … a 35% cut in previous expectations coming OUT OF the holiday season where everyone was screaming SALES are good! And while sales are necessary, margins matter more … which is something we’ve literally been screaming. I don’t know how much more succinctly we could have put it dating as far back as April 2022:
“As margins compress – profits fall – layoffs are around the corner” OSAM 4/1/22
And this is EXACTLY what’s happening! Again, cycles just take time and space!
As Hedgeye retail sector head Brian McGough notes: in the case of Nordstrom, currently 100% of the company’s earnings are coming from credit income. Given the tending inventory builds, sales and incentives, their retail products are literally being sold at break-even (in aggregate, ZERO MARGIN)
By McGough’s numbers, the credit business earns roughly $1.50 (which just happens to be the low end of the company’s newly guided range) … with this in mind, we ask you ponder a few thoughts:
- Given the increasing trends in credit delinquencies, when does their credit portfolio start to take on serious water?! (i.e., borrowers missing payments)
- Nordstroms is cutting estimates by 35%, what do you think guide downs are going to look like at retail companies with limited to NO credit income who have to unload their bloated inventory at pennies on the dollar?!
And remember, JW Nordstroms is typically a higher end buyer … consumers “with money” are slowing, too…
As discussed earlier, we’ve observed some improvements in pockets of the data, though as we noted with housing, context is extremely important. For example, January’s Michigan Consumer Sentiment came in at 64.6, which was up +8.2% from December’s 59.7 and a noteworthy move in current conditions, coming in at 69.9 vs. December’s 59.4, accelerating 15.5% MoM.
And still, as it stands, the sentiment remains below pandemic levels and near the lowest levels since the Great Financial Crisis.
At the same time, the NFIB Small Business Index continues to make new lows with December’s data decelerating yet again with an 89.8 print, vs. November’s 91.9; and has now spent a year below the 49-year average of 98.
Context is a common theme throughout this note … we’ve also previously discussed the importance of the small business owner and how they have their finger on the pulse of current economic conditions:
Small businesses have a difficult time navigating significant input cost changes. Large increases to raw materials, wage inflation, interest expense on debt, etc., all leads to margin compression and ultimately layoffs. OSAM – July 2022 – Painted into a corner … by the data
We do our best to take in all of the data in aggregate, though some does represent a greater importance. With small business being such a larger driver to the U.S. economy, and this data set literally taking the pulse of the small business owner, we keep a close watch on this data set. That being said, owners expecting better business conditions over the next six months declined 8 points from November’s negative -43% to a net negative -51% … OUCH!
We’ve been screaming slowing consumer … margin compression … layoffs … for nearly a year now!
- “They (the FOMC) are backwards looking – they don’t understand labor is as late cycle as it gets… As margins compress – profits fall – layoffs are around the corner – these (expletive deleted) will be tightening into one of the largest slowdowns in history” OSAM 4/1/22
- “Remember how we’ve been telling you that employment is a late cycle indicator?! As earnings collapse and margins get compressed!” OSAM – April 2022 -Hear my words that I might teach you
- “This will eventually lead to steep discounting further exacerbating margin compression leading into the back half of 2022” OSAM – May 2022 – Target $TGT
- “Inventory gluts, slowing sales, compressed margins (or net interest margins at financials) are translating into LAYOFFS!” OSAM – May 2022 – Target $TGT
In the past we’ve highlighted the margin compressions of many bellwether companies across numerous sectors, both Target ($TGT) and Walmart (WMT) to name a few … at this point, it’s omnipresent, credit, industrials, retail, financials, and as recently noted by Hedgeye analyst Jay Van Skiver, trucking! Meh, no matter, who needs over bloated inventories to be taken from warehouses to retail stores for no one to buy anyway?!
Below, please find brief highlights of his thoughts re: trucking company JB Hunt:
Trucking company JB Hunt ($JBHT) reported earnings last week of $1.92, a 22% miss vs. consensus estimates of $2.46 … excess capacity, which drives down utilization pushing unit costs up significantly … the flow through equates to revenue per truck load down: this in the face of a 6% increase in volume.
Again, margins, margins, margins … we’re seeing similar to the dynamics everywhere, margins are the more important story over volume, especially in a highly competitive price transparent market.
We could provide one example after another, though, most recently, the Grimm reaper appeared on financial behemoth Goldman Sachs’s ($GS) door as they reported 4Q2022 earnings last week missing on both top and bottom line. Revenue came in at $10.6 billion vs. consensus estimates of $10.8 billion YoY … a deceleration of 16% from last year’s $12.6 billion report.
Additionally, in stressing the importance of rate of change, 3Q2022 revenue was down 12% vs. this quarters 16% … which means the losses are accelerating (i.e., things are getting worse at a faster pace).
The real blood bath, however came in their bottom-line earnings numbers, reporting $3.32 vs. consensus estimates of $5.56; no big deal, just a 40% MISS for the brightest minds on wall street. Though as long-time readers know, we don’t really care much about what wall street has to say, we care about the rate of change of their year over year numbers…
Last year Goldman earned $10.81 … $10.81 that’s not a typo … for those who choose not to do math all that quickly in their heads, that’s DOWN 70% Year over Year … let that sink in … A SEVENTY PERCENT DECLINE IN EARNINGS! on a Year over Year basis!
That’s not only an earnings recession, but it’s more so an OUTRIGHT EARNINGS DEPRESSION!
Throughout the quarter Goldman experienced:
- Increased credit costs ($970mm provision vs. $630mm expectations)
- Core Global Banking/Markets business revenue down -14%
- Wealth/Asset management down -27%
- Provision up +180%
- Operating expenses up +11%
… and their retail credit card business is a disaster!
Speaking of Credit!
Synchrony, JP Morgan, American Express, Band of America & Citigroup are ALL showing eerily similar trends of higher delinquency rates across the board, as well as an acceleration in the rate of change of delinquency.
As Hedgeye financial analyst Josh Steiner notes: “YoY is accelerating while the absolute level is increasing”
Remember how we told you the explosion in credit wasn’t a good thing in both April and here in May?!
“Again, the last two months have literally hocky sticked (re: consumer credit) to SEQUENTIAL Month over Month ALL-TIME HIGHS, and while this data is subject to revision, it’s being corroborated by April’s most recent data coming out of credit card companies such as Capital One ($COF).
The national rate on credit cards is nearly 16.58% and climbing, lower credit scores borrow north of 25%, which means borrowers tend to tap their credit cards only as a measure of LAST RESORT; when they have exhausted all other resources, albeit cash or sources of cheaper credit such as home equity lines … (again, THIS IS NOT GOOD)!”
This trend is NOT bullish, and it falls squarely in line with what we discussed last month in regard to a significant spike in both subprime and deep subprime auto loan delinquency rates:
Consider recent data out of Public Auto ABS, Bill Ploog as recently pointed out by a @GuyDealership, shows a sharp acceleration in accounts 60 days PAST DUE: November 2022 subprime loans (501-600 credit scores) are up to 5.9% delinquent vs. 4.3% November 2019 (pre-covid reading gives a cleaner comparison) while Deep Subprime loans (300-500 credit scores) have just touched 8.2% vs. 5.9% in November of 2019.
Most recent data out of Cox Automotive (the owner of the Manheim) shows yet another ramp in severely delinquent loans, which again, is a loan that is 60 days+ delinquent … per Cox:
Of all loans, 1.84% were severely delinquent, which was an increase from 1.74% in November and the highest rate since February 2009. Compared to a year ago, the severe delinquency rate was 39 basis points higher. In December, 7.11% of subprime loans were severely delinquent, increasing from 6.75% the prior month. The subprime severe delinquency rate was 163 basis points higher than a year ago, and the December rate was the highest in the data series back to 2006.
While a +10 basis-point move in total delinquencies might appear small, the trend here is up +6% MoM and +25% YoY. There is nothing small about it, it’s yet one more data set that’s steadily increasing over a trending duration confirming what we’ve been telling you would happen for the last 9 months now … the consumer is in serious trouble!
they have tapped out the most expensive of credit lines as noted above; financial institutions have been highlighting this as a “positive”, consumption has come to a grinding halt, the music has stopped, and most will be caught without a chair to sit in…
We highly suggest you re-read the last sentence taken directly from the Cox report above. It is what we believe to be the most important highlight of their note.
If you’re wondering why, this data series dates back to 2006, which is inclusive of the Great Financial Crisis (GFC) and the pandemic of 2020 when the globe literally shut down … as “THE UNEMPLOYMENT RATE PRINTED A FRESH 50-YEAR LOW AT 3.5%” and yet, today still we’re experience, “THE HIGHEST DELINQENCY RATE ON RECORD”; now, square that circle!
Speaking of the unemployment rate, this brings us to labor…
Labor
U.S. labor markets continue to be … “meh”! By the data, labor markets remain tight, as Hedgeye Director of Research Daryl Jones recently noted, “Although subject to denominator effects, the unemployment rate printed a fresh 50-year low at 3.5%.”
While at the same time there has been a steady deterioration beneath the surface of the data that has been going on for some time and should be noticeable to those paying attention.
December ended with a slight uptick in weekly Jobless Claims +223K, from +216k, though has subsequently fallen to +206k and +205k sequentially as it continues to hover around historically low levels.
Continuing Claims fluctuated slightly throughout the month initially coming in at 1.634MM, which was, “a decrease of 63,000 from the previous week’s revised level” of 1.697MM, a number which was revised up 3k from the originally reported 1.694mm; a decline of roughly -4% … only to increase slightly later most recently to 1.647MM.
You may have noticed throughout this note, Initial Jobless claims, along with numerous other data series, have been trending negatively from their respective peaks or troughs. In the case of continuing claims, the trend has been higher since troughing in May.
The importance here lies less in the plus or minus 30k – 60k in fluctuating weeks, but the longer-term trend that’s been steadily rising since the May 21st trough of 1.306MM … meaning more and more people need unemployment insurance.
Similarly, while the November U.S. JOLTS Job Opening data continues to suggest a robust labor market, declining by a modest 65k jobs, falling from 10.51MM to 10.45MM … its trend is also a deceleration from the peak of roughly 12MM opening, which occurred in May of 2022, too.
We’ve mentioned data “foreshadowing” things yet to come a few times in this piece, so place this one in your memory banks … the “employment” component of the ISM services data dropped into contraction … which is often a leading indicator for non-farm payrolls.
The reality is we could discuss a myriad of data that falls under the “labor” umbrella: A mild improvement in the Challenger, Grey & Christmas Job report for December (43.7k vs. 76.8k); The ADP employment data accelerating to +235k in December vs. +127k in November; Non-Farm payrolls of +223k slowing vs. November’s +256k or Temporary Unemployment dropping -35k in December (good for it’s 5th straight decline, which is important as temporary employment is typically a leading indicator and more sensitive to a slow/no growth environment: think NFIB confidence).
While we may sound like a broken record; all of these moves are relatively small, but at the same time, the directionality and overall trend is slowing; and it is NOT favorable for a few reasons.
The first being, while weakening, the labor data remains robust enough, in the face of a 6.5% CPI, to maintain the Federal Reserve’s higher interest rates for longer mentality … when accompanied with the fact that the majority of layoffs we’ve seen to date have occurred much higher up the wage-earning pyramid than in previous cycles, our problems are compounded even further.
Hedgeye’s Josh Steiner summed this up brilliantly in his January 6th Early look note:
“In cycles past, it has been the base layer of the employment pyramid (lower skilled / lower wage) that has borne the brunt of the fallout in the form of significantly elevated rates of unemployment, particularly relative to the higher layers of the pyramid. This time around, however, this seems less likely to be the case. The newsworthy, large-cap layoff announcements that are happening with increasing frequency are not base-layer cullings, but those squarely in the middle to upper quintiles of earners. Facebook (Meta) announced 11,000 layoffs in early December last year (13% of its workforce) and its median-paid employee earns over $280,000/year. Yes, 11k people on a labor force base of >150M is small, but on a wage-adjusted basis, it gets larger.”
With this in mind, here is a brief list of fresh layoffs announced just this year (while being mindful of what we just noted above):
- $GOOGL just announced they are laying off nearly 6% of their workforce 12,000 employees
- Wayfair is laying off 1750 employees, which is more than double the size of August’s job cuts
- Capital One is also cutting 1100 jobs (mostly in technology)
- Microsoft ($MSFT) is laying off 10,000 employees
- Blackrock ($BX) is firing 3% of its staff
- Coinbase ($COIN) is firing nearly 20% of its workforce after already laying off 1,100 people a few short months ago
- Stitchfix ($SFIX) is laying off nearly 20% of its salaried staff
- Amazon ($AMZN) plans to fire another 18,000 employees
- Salesforce.com (CRM) will fire approximately 10% of its staff
- Newell brands ($NWL) will fire roughly 13% of their office staff
- 3M ($MMM) will be cutting 2500 manufacturing jobs
- We noted Goldman Sachs ($GS) layoffs earlier in the note
- Among other notable companies like McDonalds ($MCD), Vox media, IBM (4,000), SAP (3,000), LAM research, Oregon’s largest manufacturer (1,300 full-time/1,400 part-time), etc…
The majority of the aforementioned layoffs are in a much more highly compensated income bucket, most of which will be receiving severance packages, something we were VERY SPECIFIC with in our 3Q2022 note section “Odds and Ends”:
“Two quick important notes on labor: 1. As we continue to say, it’s the latest of late cycle indicators, patience, it’s coming (unfortunately). 2. When management gets fired, they often receive severance “packages”, which means no unemployment is filed until the “package” is exhausted; keep this in mind as we head into 1Q2023.”
Point number 2. being extremely important as it’s more than likely suppressing labor data.
I want to be crystal clear with this … I am NOT rooting for any one single “individual” or “income class” to be fired over another, I’d prefer no one get fired (which is why we’ve attempted to prepare readers for over 17 months now … that job losses would be ugly and inevitable).
The fact of the matter is that higher income earners simply consume and spend more money; it’s the point we believe Steiner is driving home when he notes “on a wage-adjusted basis”. We believe the avalanche scenario we’ve mentioned, both in November and December is much larger than most are modeling, though similar to an iceberg where 90% of the danger lies beneath the water line, when this avalanche gets rolling, it will collapse in a blink taking out most in its path.
Avalanche, iceberg, sinkholes … they’re all the same analogy … the surface area is last to cave!
Let’s circle back to a few familiar themes we’ve been discussing:
- Trends are moving in the wrong direction
- Things happen slowly … then all at once
- The layoff announcements continue, and are accelerating
- CEOs & Wall Street analysts are either: conflicted, liars or poor macro-forecasters
These layoffs that are currently occurring are in complete contradiction to what nearly all CEO’s stated just 9/10 months ago, as we were screaming layoffs are coming!
Following Microsoft’s 1Q2022 earnings call, as CEO Satya Nadella attempted to blame their business slowdown on currency exchange given the strength of the U.S. dollar at the time, suggesting the “digital transformation” was here and things would be “different this time”, that business would reaccelerate in the back half of the year, tech would be fine during any crisis and discussing layoffs was pre-mature … we called bull:
Old enough to remember $MSFT CEO being clueless roughly 110 days ago on his previous earnings call, to now be equally as clueless roughly 20 days ago on their most recent call. THEY WILL MORE THAN LIKELY BE FIRING PROPLE SHORTLY … it’s the cycle!
We can’t prove that he attempted to mislead the public on both his 1Q2022 & 2Q2022 earnings calls or not, at the same time, when he stated the below a mere 20 days post his Q2 call on August 9th, 2022, it truly makes one wonder:
- MICROSOFT TRIES TO REDUCE BUSINESS EXPENSES BY RESTRICTING SPENDING ON TRAVEL, TEAMS – WSJ
- MICROSOFT IS CUTTING HUNDREDS OF CONTRACTORS AMID LAYOFFS AND A HIRING FREEZE – INSIDER
How do you speak to the world about how things are fine, only to announce the exact opposite 20 days later? How were we writing what we were on April 9th well before Microsoft’s August 9th announcement?! And again on May 3rd, 2022:
“It’s just getting started … and what Q2 will reveal that Q1 didn’t is that $MSFT & $AAPL management have zero forecasting ability. $MSFT basically said, “this time it’s different” – $AAPL similar. $GOOGL doesn’t’ really guide – $INTC said “soft” and just wait for $TSLA in Q2”
We’re talking the CEO of literally, one of the largest, most successful companies in the world and he can’t forecast 20 days out?!
While certain companies may have the ability to be creative with their accounting for some time, the “cycle” or “economic cycle” eventually exposes those who are not being as transparent and accountable as we all would hope the CEO of a major corporation to be.
We reiterate what we wrote last month; given the conflicted nature of incentives within this business, when faced with the decision to be truthful or watch your income be impaled … “they ALL LIE!”
On their most recent earnings call, Nadella was more truthful about what lies ahead then we’ve heard before stating, “At the end of the day, we are all governed by what is happening in the world. Because one cannot defy gravity, and gravity here is inflation-adjusted economic growth.”
He also guided down off of the slowest data which hit in December … we’d say he’s nearly a year late, but good for him. Do you know what wall street did in response to Nadella’s negative guidance and outlook?!
They took their consensus numbers UP!
You seriously can’t make it up folks, if it’s not the CEO’s lying, it’s the unscrupulous individuals on wall street misleading the public … which brings us to our final point and third dynamic we mentioned above before we close!
Well, if all of this is true, why have markets rallied to start the year off?!
Known unknowns
As noted in our opening discussion we briefly discussed outside influences that need to be managed throughout bear markets, some being more easily identifiable and foreseen than others.
For example, given the Federal Reserve’s stance on hiking interest rates and reducing their balance sheet. Up until Tuesday when I had these next few sentences written, U.S. M2 (money supply) growth was an anemic +0.0% YoY; the lowest level of M2 growth in more than sixty years … then came the most recent data for December showing, “domestic money supply contracting to a new all-time RoC (Rate of Change) LOW at -1.31%” Hedgeye Macro Show top 3 things 1/25/23
We understand the directionality of the longer-term trend in the data. We know that the consumer is tapped out, real wage growth is negative, savings are anemic, credit/borrowing is at all-time highs in an elevated cost of capital environment … we know that liquidity is literally getting sucked out of the system.
We also know this new “cost of capital” regime we’ve been describing in recent notes, is decimating real estate markets and many locations and segments that fall under the real estate umbrella (i.e., malls & office space) will likely continue to get crushed in countless locations, not just here in the U.S., but around the globe. As an aside, should borrowing rates fall (meaningfully), this could alter the direction of housing, but like other things, we’ll adjust on the fly based upon the data and what’s transpiring at the time in the labor markets.
Blackrock and Starwood gating redemptions of their BREIT and SREIT funds as we noted last month wasn’t all that much of a surprise either, we’ve seen funds gate in the past during liquidity crunches … knowing what happened to BREIT and SREIT, $KKR doing the same should NOT have come as a surprise; $KKR becoming the latest of private REITS to freeze redemptions on their $1.6 billion dollar, non-traded REIT last week.
These are known unknowns where a. the probability gets greater that something beneath the surface is breaking, and b. while you’re not sure where or how it will manifest, you know most not paying attention are about to be blindsided by something.
To us, the marks private equity and pension funds will be taking in the next 2 quarters won’t be a surprise, how it manifests is something we’re watching out for closely … most will act shocked when it happens, we won’t.
These are all major signs that … it’s all over but the screaming/crying.
Another but anticipated sign, is CDS (Credit Default Swaps) on U.S. Treasuries have widened from 25bps at the end of December to roughly 35bps, which may not sound like a lot, but a. it’s a 40% increase in an extremely short period of time and b. it’s the U.S. Treasury … debt ceiling discussions have recently begun with both political parties spitting fire; increased political tension is something we’ve discussed, specifically calling out the lack of Washington’s ability to agree on anything in our September 2021 piece: “A Shoot-Out’s a Brewing” (one of the shoot-outs being political).
These are all dynamics one should be factoring into their investing thesis as we head into a highly probable, upcoming credit crisis; we see it as nearly inevitable. When the largest of private REITs gate investors from getting their money back because the underlying assets are imploding and there is no liquidity as money supply and access to credit/collateral the bombs are already blowing up.
All of these unknown knowns are things we’ve been discussing and risk managing for some time, which brings us to the third dynamic we mentioned in or opening section … which is straight up market manipulation by larger players caught completely offsides by current market dynamics.
Manipulation via the options markets is nothing new these days, most of you have heard of the YOLO (You Only Live Once) call buying dating back a few years now, most prevalent throughout the multiple Hedgeye #Quad2 bull market spawned by the nearly $7 trillion dollars of helicopter money provided courtesy of both the Federal Reserve and Government fiscal programs.
More recently however, those paying attention have borne witness to some of the most insane market manipulation via options markets most have ever seen, and I would never use the “M” word lightly, bringing us to…
“0DTE options”
0DTE is short for a “Zero Date to Expiration” option, meaning the option literally becomes void (or expires) the very same day they are traded; each minute that passes is another minute closer to its expiration. They are literally the shortest of short-term bets that exist and yet over the past few weeks, tens of billions of dollars are being poured into them!
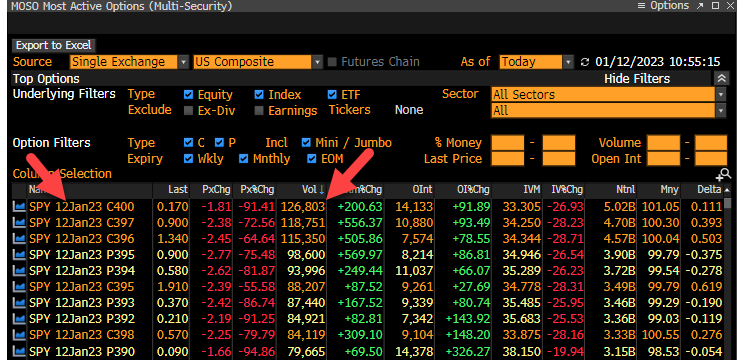
In the past two and a half weeks, volume within these 0DTE options have exploded. Hedgeye CEO Keith McCullough recently stated: “Define insanity (or outright options market manipulation)”
His tweet from January 12th highlighted the monstrous volume in 0DTE index call buying:
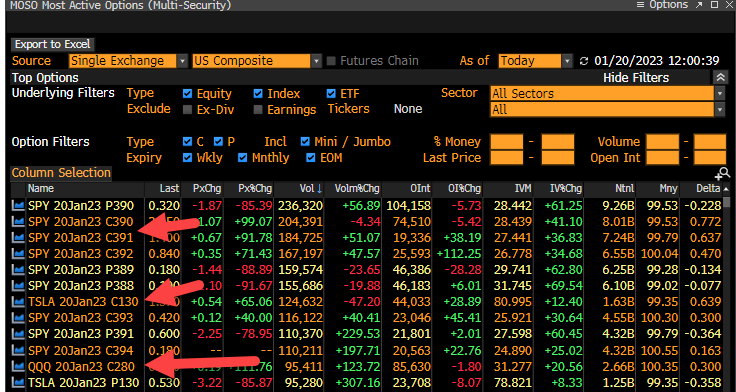
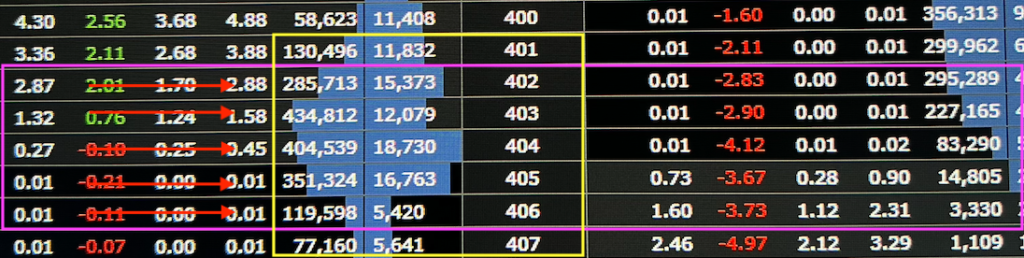
He followed up with last Friday’s January monthly expiration (1/20/23):
As seen in the below image, closing volume on the January 23rd SPY call options with a 400-strike price equated to roughly $17 billion in notional dollars … the volume on the SPY 401 and 402 strike prices were massive as well (that’s literally mind numbing given the odds of the option expiring worthless are massively high)!
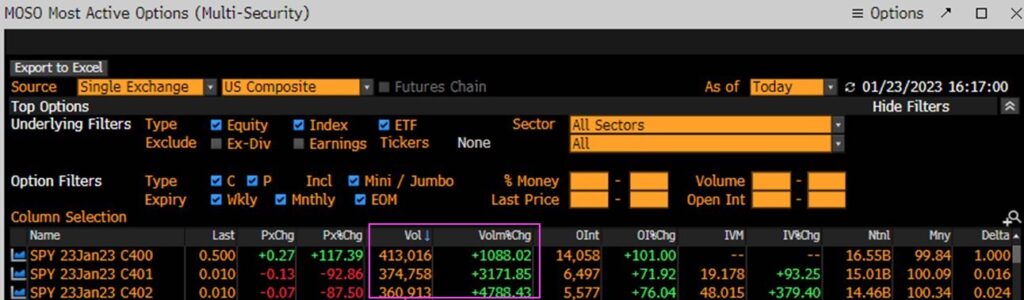
the closing volume on the January 25th 400 calls were, again larger (427,077) … though yesterday’s volume was the most, yet (as can be seen below) … literal insanity!
One doesn’t place tens to hundreds of billions of dollars at risk for hours to minutes unless they know that the very act of what they’re doing forces the largest options dealers on the other side of the trade to act in way that will be favorable to your short-term bet. In this case, dealers will “delta hedge” their books into expiration, which, in the case of these 0DTEs, is the close of business.
Delta hedging is designed to allow the dealer to “reduce” or hedge the directional risk associated with price movements in the underlying asset”, and while buying traditional options wouldn’t ordinarily be considered manipulation, Section 9(a)(2) of the Securities Exchange Act of 1934 has this to say about market manipulation (among other things):
“… to effect, alone or with one or more other persons, a series of transactions in any security registered on a national securities exchange creating actual or apparent active trading in such security or raising or depressing the price of such security, for the purpose of inducing the purchase or sale of such security by others.”
These are not retail investors; again, we’re talking about tens of billions of notional value in these 0DTE options being systematically purchased at sequentially laddered strike prices with an imminent expiry, with every passing second. If you’re risking as much capital that’s being thrown around here, you without question understand the action dealers need to take on the other side of the trade.
In turn, you’re literally “actively trading in a security, raising the price of such security, for the purpose of inducing the purchase or sale of such security by others”, (which, in this case, “others” happens to be the dealers or those who trade momentum). It’s the very definition of “market manipulation” per the Securities Exchange Act of 1934.
Betting tens of billions of dollars in options set to expire within such a short window of time is NOT investing, it’s desperation. The sad reality is, this suppresses volatility over a trade duration, which is typically just long enough to create an environment where everyday investors with their retirements and life’s savings invested will suffer when the vacuum sucks the life out of markets, just as they are led to believe the “bull market is back” … right at the time the surface area starts to cave in.
This is NOT normal activity … though it is without question another example of what we would consider to be a known unknowns. It’s also the type of desperation you see from large players, i.e., hedge funds positioned improperly for a Hedgeye, #Quad4, deflationary investing environment.
While we don’t currently know who these players are, imagine a large pension/long only or hedge fund locked in assets frozen by BREIT, SREIT or KKR where they can’t get their hands on liquidity and rather than admit it, they’ll do anything to stay afloat!
This is the type of desperation you see from those who will do anything to bail themselves out of a massive hole they’ve dug for themselves; and frankly, in a world where even the Federal Reserve “crosses many red lines”, the definition of accountability has been misplaced. At the same time, when negative -2 to -3% GDP hits in the next 3 months and sellers can’t get out fast enough, this trade will bankrupt many!
While we don’t know when, this is the kind of thing you’ll have senate hearings on.
Make no mistake, this dynamic is brand spanking NEW … as in 2 to 3 weeks new; and as much as we actively search for these known unknowns, we definitely did NOT see this one coming, but we’re on. I know what it “feels like” in the short term, I also know those who “feel” and act irrationally will likely not fare as well than those who understand how bear markets work.
Ironically, there are 3 primary options dealers in the markets, Susquehanna, Citadel and Goldman Sachs … and we noted above that Goldman reported earnings DOWN 70% YoY, while Citadel, just reported a $16 billion dollar gain for 2022; it’s recently been labeled the greatest trade ever.
While we won’t speculate on who’s doing the manipulation, eventually, buyers become exhausted and gravity sets in, especially as this current earnings recession forces more selling volume, increasing the amount of capital necessary to perpetuate this trade; eventually the desperation will be exposed. History suggests things won’t end well, for both the 0DTE call buyer, nor those sucked in to believing the “bull market is back”.
Again, we understand the definition of active market manipulation as defined by the Securities Exchange Act of 1934 very clearly, at the same time, it doesn’t change the fact that this is happening occurring … so, as frustrating as this new dynamic may be, it is what it is … we’re aware of it and will adjust to risk manage accordingly.
Final thoughts
The economic cycle is determined by the data, and outside of a few dead cat bounces, both noted and contextualized throughout this piece, in aggregate, the data, along with earnings are now decelerating at an unprecedented pace … and this with GDP still positive.
From a short-term trade duration, equity markets can be manic for multiple reasons … algorithmic programs read headlines instantly, passive flow, CTAs, technical traders, the offsides positioning of net neutral hedge funds/POD shops or outright manipulation as described above.
Per Goldman Sachs hedge fund positioning, as recently noted by Hedgeye CEO Keith McCullough, average hedge fund positioning is roughly 180% gross, and 51% net long exposure … with the last week being in the 99th percentile of short covering on a 5 year look back.
From March 2000 through November 2002 the Nasdaq had 11 rallies of 11% or MORE and still markets remained in a bear. April 00 +19%, May 00 +31%, July-August 00 +17%, Sept 00 +14%, November 00 +19%, December 00 +28%, March 01 +41%, April 01 +11%, September – November 01 +49%, February 02 +12% and August 02 +19%.
These facts are courtesy of Josh Steiner @HedgeyeFIG at the recent Hedgeye Regional conference in Miami that we were lucky enough to attended.
Now consider the current hedge fund positioning discussed, record short covering, then include the outright manipulation we outlined above re: 0DTEs … and STILL the NASDAQ and S&P 500 are up 10% and 5.5% off their December cycle lows, respectively (which is less than a month ago). These moves wouldn’t have even shown up as a “rally” during the tech bubble crash of 2000 – 2002.
At the onset of this section we said, “and this with GDP still positive”, when discussing how ugly the data and corporate earnings currently are … and while this week’s GDP print reads “positive”, a. it’s a December number and b. the +2.90% which “beat wall street expectations”, is a seasonally adjusted annual rate. “A SAAR”, as Hedgeye Director of Research Daryl Jones recently wrote:
“… takes the sequential quarterly increase and annualizes it” … he continued, “On a real GDP Y/Y basis … GDP slowed to +1% Y/Y, which was the lowest number since Q4 2020”
Per Hedgeye’s most recent NOWcast, which has been exponentially more accurate than anything wall street has ever produced, we’re slated to see one of the largest sequential declines from 2+% to negative -3% by April … which NO ONE on wall street is anticipating, nor any corporate CEO (less $RH’s Gary Friedman).
Data clearly shows investors aren’t SHORT, they’re grossly overleveraged long and not prepared for the current earnings recession, let alone with GDP at -3% (as the data deteriorates) … which will make this collapse that much worse … no one is paying attention, somethings going to break, and panic will most likely ensue.
More food for thought … the labor market is without question trending in the wrong direction though remains historically tight and inflation (as measured by CPI) remains nearly 3x times the Federal Reserve’s 2% mandate. Shelter will remain a headwind for inflation, Oil has accelerated in the last month & food at home and away are at nosebleed levels.
Current data gives the Federal Reserve ZERO room to alter their path … and without a MAJOR policy shift from both the Fed and Washington, the forward outlook is NOT good. As for policy shift, we don’t see one as probable given the current data is painting the Fed into a corner and the hateful tone from opposing political parties doesn’t bode well for even the debt ceiling debate.
Of course, the Fed may “pause”, at some point they were always going to stop, but it ain’t now … and as we’ve said, the damage has already been done, the current cost of capital is unsustainable.
The games certain larger players are engaged in remains, in our eyes, a sign of desperation that gravity will eventually fix (abruptly) … we do not believe this will end well for most. Bear market cycles do take time, though in the end, they often leave the macro-unaware with no process, crying.
We’re not perfect, but data and process dependent we remain.
As stated, prior, while there are no absolutes in markets, and it may not “look it” today, it is our opinion (based on the data, history, and market action), it’s all over but the shouting/crying.
Thank you for your continued trust and support!
Good Investing,

Mitchel C. Krause
Managing Principal & CCO
Please click here for all disclosures.

