

In This Article


Autostereogram
Some of you may be wondering what an autostereogram is … other’s may, in fact know exactly what they are or simply know them by brand name for “Magic Eye” books became very popular in the 1990’s, selling in excess of 25 million copies globally in multiple languages.
Either way, there is a high probability a majority of you reading might be wondering why in the name of all that’s holy, is an autostereogram this month’s lead off topic?!
The brainchild of Christopher Tyler, autostereogram’s were developed in the early 1970’s. With the help of early computers, borrowing from the concept of the stereogram, Tyler was able to blend the two visual theories in order to create a “random dot stereogram that allowed the brain to perceive 3D from a single 2D image without any optical help.” Vision and eye health
An Autostereogram is an abstract image where a 3D illustration is camouflaged or hidden behind a 2D picture with a repeating pattern. It is only when you view these images from a different angle, does the “hidden” 3D rendering appear from behind what appears to be a simple, pedestrian 2D facade.
Allow me to say that again, slightly differently. It is only AFTER you adjust your focal point, does what you actually SEE, change … and remember, once you see the 3D image, it’s not the picture that’s changed, you did; by simply altering your perspective!
Have a try … take a look!

What initially appears to be a sea of different shades of blue actually turns into a 3D image of two Dolphins swimming for those who are able to adjust their viewpoint (they’re there … I promise … keep looking).
If you are having trouble seeing them, the prescribed remedy per vision specialists is twofold.
- Concentrate on a focal point at the center of the 2-D image. (“Try not to get distracted by looking around the picture.”)
- Try not to look AT the picture but allow your eyes to relax and look through it; almost as if you’re looking behind the picture.
Said differently as we tie this analogy to investing. Allow yourself to relax … shift your focus from day-to-day noise and fluctuations, while using THE DATA as your “North-Star” to calmly guide you in making the best decisions. Filter out said “noise” in order to see the BIG PICTURE (the saying, “seeing the forest for the trees” might come to mind)?!
The parallels are eerily similar to what we discussed earlier this year, quoting famed poet Henry David Thorough in February: “IT’S NOT WHAT YOU LOOK AT THAT MATTERS … IT’S WHAT YOU SEE!!!”
How do we mean?!
We’ve been preaching “the data” for years now, allowing it to guide us … For example, the Hedgeye NowCast models, when coupled with the data prepared us for the disinflationary market environment we entered into in January of 2022. It was the data that prepared us and readers back in September of 2021.
At the same time, we now have a very good understanding of what we are looking at, it’s definitely not always easy to see. Especially when you’re used to primarily following those who don’t subscribe to data being their primary guide. Though it’s also why we do our absolute best to teach it as best we can.
Which is why we were VERY specific, in MAY, when we said this:
Again, topping is a process … the used car data will continue to decelerate, but at a less rapid pace. At the same time, the deceleration in other material inputs on lags such as agricultural products like corn and wheat, industrial metals like copper and housing, coupled with more difficult YoY comps (base affects) will start to kick in making the disinflation to deflation more visible over the next quarter or two.
Based upon the data, we saw the disinflationary investing environment coming as early as September 2021, repositioning ourselves in January 2022 (well in advance). The data is how we’ve educated readers as to what the “markets” would be looking for vs. what the Federal Reserve and Wall Street sees … we assure you; these views are MILES apart.
It’s how we penned the above paragraph roughly two quarters PRIOR to Wall Street finally waking up to “disinflation” given this month’s most recent CPI print, where they (wall street and poorly positioned hedge funds) decided to have a buying frenzy!
Congrats, we finally welcome them to the party, though do sincerely hope you’re not buying into the hype of this most recent bear market rally for unfortunately, as is typical, Wall Street, hedge funds, financial news pundits and most investors are late, ill prepared and focusing on the WRONG THINGS AT THE WRONG TIME … AGAIN!
Let’s start with inflation…
Last week investors were sold yet another narrative that the “better than expected” CPI print would tame future Federal Reserve interest rate hikes; that given (the now noticeable) falling inflation (and bond yields, for a few days), the “all-clear” has been signaled and it is once again time to buy “profitless technology stocks” … again … as investors sent the Goldman Sachs “profitless tech” basket up 25% over a 2-day period last week (forehead, meet palm).
While we’ll address the latter, later; let’s first touch on the “better than expected” CPI report.
Headline CPI came in at up +0.4% MoM and +7.7%YoY … which again, was … “better than” the “hotter” number “wall street consensus expected” (+0.6% MoM and +7.9% YoY, respectively). Yes, you’re reading that correctly, the difference between the data reported and wall street consensus was a whopping 20 basis points (0.20%) “better” … you really couldn’t make this stuff up if you tried!
Longtime readers understand, we believe Hedgeye produces the best NowCast models in the world of global finance. With this in mind, Hedgeye’s 4Q2022 CPI estimate was at 7.62% YoY; (GASP) they missed by a mind numbing 8-basis-points (LOWER than where both Wall Street consensus and the headline number printed).
If you use Hedgeye NowCast models as your “North Star”, the data actually came in “hotter than expected” (go figure). The only surprise from those of us who follow the data other than the idiocy of the buying, chasing, and FOMO frenzy that ensued.
Subsequently, after updating their models post the most recent data dump, Hedgeye’s 4Q2022 CPI estimate has now dropped to 7.52%. With this in mind, and as we’ve noted int the past, whether this CPI print came in at 7.5% or 8.0%, it’s ultimately irrelevant if you’re attempting to see the much more important BIGGER PICTURE!
Circling back for a second. What’s your North Star?! Are you concentrating on a process? a specific focal point (THE DATA)?! emotion?! Or a combination of the above?! If you’re operating by a process (which we highly recommend) does it include allowing yourself to alter your perspective by taking a step back, then a deep, relaxing breath, allowing you to see THROUGH the 2D surface area in an effort to see the full 3D image we discussed in our opening autostereogram analogy?!
Do you recognize that plus or minus a few basis points on CPI isn’t going to change the spending habits of the American consumer, nor will it alter the trajectory of what will likely amount to be one of the worst profit recession in modern history?! Will it change the path of the Federal Reserve?!
We spelled this out very clearly in June, and it rings truer today than it did when we wrote:
To be clear, Powell also said:
- “We will be looking for compelling evidence that inflation is moving down consistent with inflation returning to 2%”
- “I said just now that restoring price stability is just something that we have to do, there isn’t an option to fail”
- “The first thing I would say to every household is that we know that inflation is too high we understand how painful it is particularly for people who are living paycheck to paycheck and spend most of that paycheck on necessities such as food and gas and heating their homes and clothing…”
- “Our mandate is for headline of course it’s not for core”
- “I said that another unusually large increase could be appropriate”
For anyone to have taken anything in this press conference to be “dovish” … headline inflation, which is their mandate (as he just stated), won’t be below high 7’s in September and won’t be close to the mid 6’s until Q1 based on how headline CPI is calculated (nowhere close to returning to 2%).”
And if anyone thought this month’s FOMC meeting and press conference was “dovish”, I would sincerely question their sanity.
Within the first 75 seconds Powell firmly stated:
“Good afternoon my colleagues and I are strongly committed to bringing inflation back down to our 2% goal we have both the tools that we need and the resolve it will take to restore price stability on behalf of American families and businesses.”
- we are moving our policy stance purposefully to a level that will be sufficiently restrictive to return inflation to 2%
- we’re continuing the process of significantly reducing the size of our balance sheet
- restoring price stability will likely require maintaining a restrictive stance of policy for some time
It’s difficult to believe we have been reiterating ourselves for as long as we have, and that Wall Street continues to perpetuate absurd narratives rather than follow both the data and what Powell continues to say.
We’ll emphasize something we’ve written before and just noted above.
It was JUNE that we informed readers headline CPI wouldn’t be below “high 7’s” by SEPTEMBER “and won’t be close to the mid 6’s until Q1” … it’s NOVEMBER; we’d argue that quote has aged fairly well?!
In the spirit of Thorough’s above quote, as to whether or not you “see” the right information and data based off of what you’re “look(ing) at” it often boils down to a few simple things … though none more important than … are you allowing yourself to view things from a different angle or perspective as is required when attempting to “see” the 3D image hidden within the Autostereogram?!
How many “professionals” do you think have taken the time to understand how markets view the CPI data including the leads & lags of each component?
While many of you might think the answer to this question is “a majority”, if this to be the case, just know, every economist included in last months “CPI consensus estimate” was wrong, Hedgeye and their disciples were not…
How many of you read or heard anything from wall street pundits or PhD economists last month that read anything close to:
“next month’s (CPI) reading is also likely to include some unwanted strength from the oil component, as crude oil accelerated off its lows last month. Oil, as we’ve conveyed in the past, has a lead/lag flow through into CPI that is either concurrent or on a 1-month lag.” OSAM October 28, 2022
We understand the data came in “lighter than expected wall street expected, at the same time, energy was one of the components that largely accelerated in last month’s CPI print.
Can anyone imagine a scenario where “fuel/energy” further accelerates in next month’s data (as it flows through either concurrently or on a 1-month lag). We don’t know for sure if it will or won’t (as of right now, most likely NOT); but how many heads would explode on Wall Street if next month print were “higher” than expected alongside mildly accelerating GDP data given last years “Omicron” slowdown which has created easy YoY comps?!
The narrative will then be, bottom is in, recession is over, only to be pounded given November/December’s un-comp-able cycle high comps?! It’s so important to understand the data and not be emotionally driven.
This has been expected!
Moreover, and much more importantly, we’ve literally detailed this for the past year, a Hedgeye #Quad4 disinflationary investing environment is when BOTH GROWTH AND INFLATION ARE DECELERATING SIMULTANIOUSLY; IT’S THE VERY DEFINITION OF #QUAD4! As we wrote November 2021:
While the upcoming Q1 is going to be a tight race re: Growth and Inflation peaking or slowing (which we’ll likely be addressing shortly), Q2 is most likely another story all together.Mathematically, including base effects, I have no idea how (both) growth and inflation won’t be rolling over simultaneously into a Quad 4 (disinflationary investing environment)”
We’ve reminded readers of certain market characteristics along the way, for it’s much harder for most to see the disinflation until it’s blatantly obvious, as we noted in MAY:
“topping is a process … the used car data will continue to decelerate, but at a less rapid pace. At the same time, the deceleration in other material inputs on lags such as agricultural products like corn and wheat, industrial metals like copper and housing, coupled with more difficult YoY comps (base affects) will start to kick in making the disinflation to deflation more visible over the next quarter or two.
Unfortunately, once everyone can see it, it’s typically too late to protect yourselves!
And exactly as we said would happen, roughly 5/6 months later, the deceleration in both growth and inflation is now visible to all the “experts” who couldn’t foresee it back in September/November of 2021 (as we forecasted), or in May (as we entered the throws of it) … because most have not taken the time to adjust the angle as to how they view the data.
At the same time, a CPI print of 7.9%, 7.7%, 7.5% or even 6% is NOT:
“compelling evidence that inflation is moving down consistent with inflation returning to 2%”
As Fed Chairman Powell stated back in MAY and reiterated at this month’s most recent press conference.
Volatility is a primary characteristic of a Quad 4 investing regime (which we’ll discuss in greater detail below). It will create massive swings in both directions. However, so long as the downward trend remains intact, the bear market will persist.
It clearly doesn’t help that the Federal Reserve is “tightening” monetary policy INTO this GLOBAL economic slowdown as both growth and inflation are decelerating simultaneously.
We’re on the precipice of an epic earnings/profit recession, which is colliding with an unprecedented collapse in the housing market data, as ALL ASSET CLASSES ARE DECELERATING OFF OF ALL-TIME RECORD HIGH BUBBLE VALUATIONS!
What could possibly go wrong?!
Did someone say Housing?
We discussed the massive decline in both the FFHA and Case-Shiller Home Price Indices data series in last month’s note, which has only continued to decelerate since then, with August data, down -0.7% and -1.6% MoM, respectively.
While the Case-Shiller report shows prices up +13% YoY, they were up +15.6% YoY the previous month, registering yet, another sequential rate of change slowdown (the fastest in the history of the dataset).
Additionally, U.S. September New Home Sales came in +603K, down more than 10% from August, while September’s U.S. pending home sales were awful, down -10.2% MoM, -31% YoY which is a substantial deterioration to August’s, which was down a modest -2.0% MoM.
In September we offered the importance of this as it relates to GDP:
“it’s never just one thing, but the particular thing at particular moments in time.
Take Real Estate … it was THE single largest contributor to GDP in 2021, providing more than $4-trillion dollars to the $22.99 trillion dollar pot; just north of 17.3%. Given the speed of our current unprecedented rise in mortgage rates to 7%, with the largest buyer of MBS securities stepping away from the market (The Federal Reserve) do we not think of this as a butterfly flapping its wings?
And wouldn’t you know it, the most recent GDP report, showed housing contracting at a -26.4% annual rate in Q3; as Axios recently noted, “subtracting more from GDP than it has since 2007”.
We have a firm understanding that the data is the data … It’s very important to not bring stories or narratives into the data. With this in mind, we are very close to the real estate markets here in Raleigh. Anecdotally we are aware of a community that has watched their consistent 35 units sold per month, decelerate to a paltry 3 units closing in September, October & (most likely) November, respectively.
This is not a mere deceleration, it’s an outright collapse in what has been one of the hottest real estate markets in the country for nearly a decade.
This buyers strike comes in spite of large incentives being offered by this particular home builder; in the above case, buying mortgages down a full percentage point (from 8 to 7%), coupled with many other incentives.
One of the 3 November purchases is currently scheduled to close for $302k, $80k BELOW COST; ($382k) 21% in the hole … should they not walk away, cash buyers that can close immediately are apparently back in vogue?!
Again, while “anecdotal” this information falls right in line with the NAHB/Wells Fargo Housing Market Index (HMI) reports we’ve recently been citing. First in September, though we emphasized the speed at which the data has been decelerating last month:
“The NAHB (National Association of Home Builders) confidence index registered 46, dropping -3 points MoM (Month over Month), its lowest level since early 2014” … most recently, the NAHB builder confidence data fell for its 10 sequential month … but it didn’t just fall, it collapsed -8pt from 46 to a reading of 38.”
This month’s report did NOT improve, falling now for the 11th straight month from 38 to 33 MoM (with Wall Street expectations at 36). Most notable and pointed out by Hedgeye analyst Josh Steiner (@HedgeyeFIG) on a morning call was that while the data may not be at all-time record lows, the RoC (Rate of Change) speed at which ALL THREE COMPONENTS of the report (Current Sales, Expected Sales and Foot Traffic) have ALL seen their WORST RoC (Rate of Change) decelerations EVER; in the history of the data set.
Again, the speed at which the data is collapsing continues to accelerate…
It is very conceivable the housing market dries up like a stagflationary wasteland for some time; for if you think about it: how many rational reasons can you feasibly conceive an individual to want to sell their home (locked in to a ballpark 3% mortgage) to take on a new mortgage at roughly double the expense (given the current 30 year fixed rate at roughly 7-8%), while also saddling themselves with the thousands of dollars in moving expenses that comes along with it?!
Our current belief is that we’re entering into a “move by necessity only” time frame, for while buyers and sellers will attempt to find an equilibrium between what a buyer can actually pay/afford vs. what a seller is willing to accept for their home, most buyers won’t be able to pay up (due to tightening of credit standards and affordability), while the majority of sellers won’t want to slash the price of their home unless they absolutely NEED to.
Activity in the housing market (in most areas) is coming to an abrupt halt!
Obviously, some homes will sell, but as discussed, we’re currently operating at anemic levels (which is also showing up in the data). Recently, Wells Fargo ($WFC) has witnessed their loan origination pipeline fall by nearly 90% YoY, as recently reported by CNBC:
The bank ($WFC) had about 18,000 loans in its retail origination pipeline in the early weeks of the fourth quarter, according to people with knowledge of the company’s figures. That is down as much as 90% from a year earlier, when the Covid pandemic-fueled housing boom was in full swing, said the people.
Given the aforementioned data, it should surprise no one that Mortgage Purchase Applications came in down -41% YoY earlier this month … and with such a significant decline in mortgage volumes at Wells Fargo, it’s leaving many questioning whether or not they’ll remain employed as the U.S. housing market continues to decelerate; also per the CNBC note:
“Mortgage volumes at Wells Fargo slowed further in recent weeks, leaving some workers idle and sparking concerns that the lender will need to cut more employees as the U.S. housing slump deepens.”
While Wells has been laying off employees since April of this year (ironically the month we began detailing the spike in mortgage rates) and have reduced headcount by roughly 14,000 employees on the year, that number is very likely to grow.
With this in mind, given the speed of the deterioration in housing data, the time for financial firms to start thinking about how much money they provision for upside-down mortgages is … yesterday (which they have not done in any meaningful way); especially now that job losses, especially in the tech space, have begun to accelerate.
Bringing us to labor
We’ve been very vocal in discussing our thoughts regarding the Federal Reserve’s stance on labor markets and how wrong/misleading they’ve been in their comments:
“… as Fed chair Powell is citing the Beveridge curveto the American public regarding a strong labor market, we cited the below on April 4th, a full month before Powell took to the podium in May:
They (the FOMC) are backwards looking – they don’t understand labor is as late cycle as it gets… As margins compress – profits fall – layoffs are around the corner – these (expletive deleted) will be tightening into one of the largest slowdowns in history” OSAM 4/1/22
For months we’ve walked you through the labor cycle and why job cuts come as late as they do … though we highlighted some very important thoughts in August:
The list of companies now firing employees continues to grow. Just last week, Shopify $SHOP announced intentions to layoff 10% of its global workforce. Microsoft $MSFT, Oracle $ORCL, Groupon $GRPN, Robinhood $HOOD, Peloton $PTON, Walmart $WMT … the list is becoming a very, very long one, but more importantly:
- Apple $AAPL recently announcedthey are laying off more than 100 of their contract-based recruiters. These are the individuals responsible for hiring new employees. This move speaks volumes to us, for recruiters fill a pipeline and similar to when an oil well is closed, it can’t just be turned back on like a light switch. It takes quite a bit of time, money, and resources to get it operating again. So not only is $AAPL cutting head count, but they’re also telling you they won’t begin to rehire for quite some time.
- Ford $F just announcedthey would be laying off 3,000 employees to “cut costs” and pay for “EV” transition. The reality is they’d have to cut them regardless due to the consumer slowdown, but meh… #FACTS vs. #Narrative
- A recent surveyfrom Big Four accounting/audit/consulting firm PwC (Price, Waterhouse, Coopers) found that 52% of executives and board members polled said that they were “REDUCING HEADCOUNT OR PLANNED TO”
More than HALF the companies PwC polled are either FIRING or are PLANNING TO.
We’ve been telling you the layoffs were coming, there aren’t many times we wished we were wrong; this is one of those time. Unfortunately, we’re not.
Well, the list continues to grow … Twitter’s now laid off 50% of its staff, Cameo (25%), Intel (20%), Opendoor (18%), Stripe (14%), Lyft (13%), Snapchat (20%), Coinbase (18%), Meta (“thousands”), Apple, Amazon & Microsoft (“Hiring Freeze”), Verizon (“a small % of its workforce”), Zayo, Cox Communication, Dell Technologies … the list gets longer daily.
At this point we can now quantify both Shopify and Robinhood’s layoffs to 10% and 23% of their workforces, respectively.
Additionally, Meta’s “thousands”, just became 11,000 while Amazon’s “hiring freeze” has turned into a firm 10,000 (which will likely grow). We are also of the opinion Verizon’s “few thousand” will turn into a number larger than $META & $AMZN combined … only time will tell?!
Net net, we’ve now seen more than 120,000 layoffs to date in the tech sector, exceeding the number of job losses seen during the “Dot.com” bubble of the early 2000’s; which eclipsed 100,000 … and while we’ve just barely begun to scratch the surface of layoffs to come, the Fed has already conceded job losses will be collateral damage in an effort to slow the economy down.
Meaning, even as job losses tick up the Fed won’t alter their path as they will view this as “expected”.
The best analogy that comes to mind regarding what we’re currently witnessing in labor markets is the sound one hears when ice and snow begins to crack just before they’re about to get crushed by an avalanche … at first things happen slowly, then once in motion, the speed at which snow, and ice falls increasingly accelerates destroying just about anyone or thing that gets in its way!
There is no stepping in front of an avalanche! The cycle is much like gravity, it just is … and there is little to nothing that anyone can do in an effort to stop it; and at this point the carnage will be ugly.
The below quotes are brought to you by the same people who told you “Inflation was transitory” … as they continue to use the same failed models that lead them to these thoughts:
“Given the data that we have … this labor market can soften without having to soften as much as history would indicate …
… I think no one knows whether there’s going to be a recession or not; and if so, how bad that recession would be?!” Federal Reserve Chairman Jay Powell
We say it often, you get to choose who or what you want to believe … you can believe Fed Chair Powell, or you can choose a process and data?! Given the data we’ve already presented, you shouldn’t have to alter the angle you view it all that much to understand … Powell is full of **it, especially given this next data point.
As I type, the 2/10’s yield curve inversion reached its largest INVERSION since 1981 (at NEGATIVE – 78 basis points) … the 3-month T-bill is inverted with the 30-year treasury by a negative -33-basis points.
Yield curve inversions have a much better track record at predicting recessions than Fed Chair Powell. With a historical accuracy rate of 100%, yield curve inversions dwarf Fed Chair Powell’s … ZERO % hit rate at anything macroeconomics (dare we mention his “transitory” debacle … again?!)
Having said this, could we be witness to the very first time the yield curve inversion does NOT precede recession?! Of course, anything is possible … at the same time, if we presented the yield curve inversion as our sole data point supporting our thesis, this note would have been finished roughly 4,200 words ago…
Odds and Ends
While our primary focus this month has been more “cycle” related (inflation, Housing & Labor), it’s important we touch on a few additional pieces to the puzzle before wrapping up with our final thoughts.
The U.S. consumer continues to run out of both money and confidence, as we’re about to enter the most damning part of the labor cycle … this, too, is showing up in the data.
October’s U.S. Consumer Confidence index dropped to 102.5, from September’s 108.0 with the Expectations Index now below pandemic levels, ticking down to 78.1. This data which measures forward outlook for the consumer is now below what would historically be considered “recessionary” (sub-80)
So, it should come as no surprise to anyone (but maybe Jay Powell) that retail sales continue to hit new cycle lows with U.S. weekly Redbook retail sales slowing earlier in the month to up +6.8% YoY from +7.6 YoY the previous week (which in and of itself was the lowest reading of the year).
Spending is clearly slowing, but what’s equally important is recognizing the shift in spending habits we discussed earlier in May continues to unfold. The relevance in understanding this allows you to shift your perspective away from the constantly preached, “consumer is healthy” narrative to reality … which is the exact opposite.
Earlier this month both Walmart and Target reported earnings. With Walmart posting a solid quarter, the financial media and Wall Street talking heads got all bulled up on Target who was scheduled to report the following day.
While most anticipated these companies to post similar results, that’s not what we, nor Hedgeye analysts Daniel Biolsi, Brian McGough or Jeremy McClean believed would be the case … and it wasn’t! Target announced a disaster of a miss! Why?! the answer lies in understanding the shift in consumer spending.
Back in May we discussed both companies’ earnings reports highlighting the adjustments U.S. consumers had made to their spending habits … in regard to $WMT we wrote:
- Grocery was up low double digits (necessity)
- Health and Wellness was up high single digits (important items)
- General Merchandise was DOWN low DOUBLE DIGITS (discretionary – NOT NECESSARY)
Hedgeye Jr. retail analyst Jeremy McClean also cited an extremely important statement from the company:
“we knew that we were up against stimulus dollars from last year, but the rate of inflation in food pulled more money away from general merchandise than we expected as the customers needed to pay for food.”
We emphasized:
“The consumer is shifting their purchases from wants to needs … in a BIG WAY”
We continued:
“Sticky inflation has forced the American consumer to shift their spending AWAY from discretionary goods (i.e., general merchandise) TO necessities (i.e., FOOD) as companies overloaded inventories at extremely high prices and expanded at too rapid a pace. We also know from recent retail sales data that there has been a 37% shift in spending on fuel (gas) as the consumer is now putting the few extra pennies, they have left into their gas tanks”
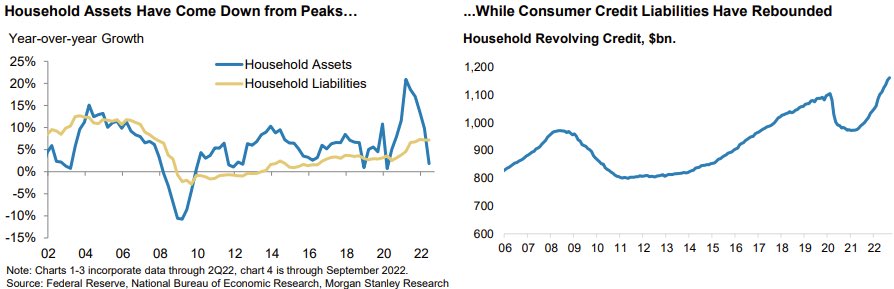
Today, this trend continues as household assets have cratered, while liabilities (borrowing) has skyrocketed, and savings have been depleted at an unprecedented pace. Total household debt is up to $16.5 TRILLION, up $351-billion last quarter alone (its largest jump since 2007). Mortgage balances are up a record $1 TRILLION, and Credit card debt we’ve been highlighting is up north of 15%
This is all taking place in an environment where the cost of capital (borrowing rates) has skyrocketed on everything from mortgage rates to Credit Cards, HELOCs, bond issuances, etc.
Again, we ask … what could possibly go wrong?!
Walmart’s solid quarter should not be confused or taken as a sign that the “consumer is healthy”; the disparity between Walmart and Target’s results are literally screaming more and more consumers from multiple income brackets are looking for deals and discounts on NECESSITIES like food.
This is not a “risk on”, “bullish” signal for the overall markets, (it quite possibly may be for Walmart, which is why we may own it in the near future should we get a pullback), at the same time, the readthrough of this data for the market as a whole is very bearish.
The above is just another example as to how your interpretation of the data can flip your perspective entirely based on a simple shift in how it’s read, but … this does come with a few caveats! First, you’re starting point/north star HAS GOT TO BE THE DATA. Second, you have to deliberately study it, daily … educating yourself on macroeconomics, business/credit cycles and how they work, and it’s what we attempt to do in writing these notes for you.
There is a reason we were able to tell you the consumer was not healthy 7/8 months ago … there’s a reason we highlighted “the consumer’s shifting their purchases from wants to needs … in a BIG WAY,” as far back as April/May.
These thoughts are a much more plausible read of our current environment than “the consumer is healthy” narrative, large in part, because they start and finish with a plethora of DATA.
IF THE CONSUMER WERE HEALTHY… WE WOULDN’T BE SEEING:
Some of the lowest readings in the NFIB Small Business Survey data, for while there has been SOME incremental improvement, it remains well below the 48-year average of 98, recently slowing to 91.3 MoM … (inflation being the top reason business owners are citing as the hurdle).
Nor would be seeing manufacturing data as feeble as it is … for example, U.S. Chicago PMI was reported at the end of October coming in at 45.2, down from 45.7 the previous month: well below the “consensus estimate” of 47.2 … the PMI is “a monthly survey of supply chain managers across 19 industries, covering both upstream and downstream activity,” making it a fairly good measure of economic directionality within the manufacturing industries.
If the consumer was healthy, these numbers would be robust and accelerating, not at recessionary levels.
Additionally, the general business activity within the Dallas Fed Manufacturing Index saw its 6th sequential negative reading of -19.4 with new orders falling … again … to -8.8.
October U.S. ISM Manufacturing also decelerated, albeit slightly, coming in at 50.2 vs. September’s 50.9, still … it’s the lowest reading since May 2020.
Headline PPI for October ticked +0.2% MoM, +8.0% YoY, yet another deceleration vs September’s print of +8.4% (which was an upward revision), while Core PPI was flat MoM, though falling from +5.6% in the previous month to its current +5.4% YoY.
Talking heads want you to believe the consumer is strong because they need you to “believe”, yet, all of the aforementioned data … small business NFP, retail sales, manufacturing, builder outlook (current, expected & foot traffic) are telling us a completely different story.
Additionally, if consumers were robust, we wouldn’t be seeing exports from those countries we receive goods from decelerate at an exponential pace; as recently called out by Hedgeye analyst Josh Steiner @HedgeyeFIG as he brought to our attention: (paraphrased below, credit to Josh)
South Korean exports reported down 16.7% YoY in the first 20 days of November (driven largely by weak shipment of chips “which were down nearly 30% YoY” & mobile devices) vs. down 5.7% in October…
Taiwan exports down 6.3% YoY for October (consensus looking for a 1% decline vs. down 3.1% YoY for September; nearly doubling YoY sequentially … with Taiwan’s Ministry of Economic Affairs also releases indicating that they expect exports for the month of November to be down between a range of 14.5% to 17% … and:
China Exports dropping 12.5% YoY in October, which was another deceleration from the previous month.
All of this is taking place as inventories continue to build here at home, which again … IS NOT BULLISH.
They refuse to see it
The frequency at which our notes differ from the primary narrative coming out of mainstream financial news networks and wall street is staggering; for numerous reasons, largely, but not limited to: A BEARISH THESIS simply doesn’t align with their financial interests nor how they get paid … we’ve discussed the conflicts of interest in great length in prior notes, but until these conflicts are addressed, it remains top of the list.
Running a VERY CLOSE second, is their refusal to follow the data … Why?! SEE #1 priority. Writing research that suggests that we’re about to see forward earnings guidance MISSES of 25-40% is NOT conducive to corporate finance deals … yet that’s exactly what just happened to Target (though, I could literally replace “Target” with countless companies).
Wall street will forever to continue to play games, cheering on earnings “beats” after multiple reduced earnings revisions vs. what markets actually follow, which is the economic cycles as measured by growth and inflation accelerating or decelerating … followed by the rate of change of sales, cash flow, revenue, etc., on an individual company level.
Understanding these dynamics is the only way we’ve been able to proactively predict with a great deal of accuracy what will happen in the future, as we’re allowing the data, as our north star, to lead us through the business cycle.
It’s how we were able to write with confidence in September of 2021, that both Growth and inflation would be decelerating as we headed into 2Q2022, as neither Wall Street nor the Fed understood this as they both look at stale data.
Or how we were able to tell you in May that this disinflationary environment would become, “more visible over the next quarter or two” … which is undeniable at this point.
The very same reason we were select in highlighting that, “the consumer is shifting their purchases from wants to needs … in a BIG WAY” (also in our May note) and its importance, for it remains a sign that persistently high inflation was/is adversely affecting an already weakening consumer, and this trend is likely to continue.
It’s also why we harp on things like:
“labor is as late cycle as it gets… As margins compress – profits fall – layoffs are around the corner”
Or …
We’ve been telling you the layoffs were coming, there aren’t many times we wished we were wrong; this is one of those time. Unfortunately, we’re not!
And finally…
“Real Estate … was THE single largest contributor to GDP in 2021, providing more than $4-trillion dollars to the $22.99 trillion dollar pot; just north of 17.3%. Given the speed of our current unprecedented rise in mortgage rates to 7%, with the largest buyer of MBS securities stepping away from the market (The Federal Reserve) do we not think of this as a butterfly flapping its wings?
Much like the autostereogram, the image (DATA) hasn’t changed, it is the angle at which it’s viewed does!
While financial pundits and Wall Street talking heads focus on the new shiny object of the day, just as a cat chases a laser pointer, we will continually attempt to shift your focus away from the distractions markets are famous for, and provide you with the proper vantage point that best allows you to visually see the full 3D picture hidden behind the 2D noise; educating you on both the data and business cycles which is what ultimately drives market TRENDS.
Before we go…
More months than not this year, we’ve written you while significantly outperforming markets. April, August and today, have been the anomalies, caught in what we would classify as … another bear market rally; today I raise my hand to it, I hold myself accountable.
These notes are important for multiple reasons. First, writing/creating a track record is one of the few ways we know how to build trust and credibility over time. We have been very prescient with our forward thoughts as can be proven by anyone who cares to look back into the volume of thoughts written … what has come to fruition exactly as we said it would while raising our hands to the few items, we may have fallen short on; everything is public and archived, nothing is behind a paywall.
Many ask me why I write such detailed notes, for it’s definitely NOT in the job description…
In a way, the answer is slightly selfish. While we of course, want you to read them … for it’s an important way to convey our thoughts to clients and prospective clients. At the same time, in writing them, I am able to firmly digest all of the data points out there in an effort to make sure we’re properly positioned for the intermediate and longer-term trends based upon what the full body of data suggests.
It’s a check and balance in an effort to make sure I’m properly visualizing the full 3D image accurately!
While we’ve done a fairly good job preserving our capital by utilizing some short exposure, it’s important to understand that when markets go up, the very same short exposure which helped us preserve capital during the downdrafts, can also hurt us; and as hard as we try, we are NOT perfect and will not catch every short-term trade perfectly.
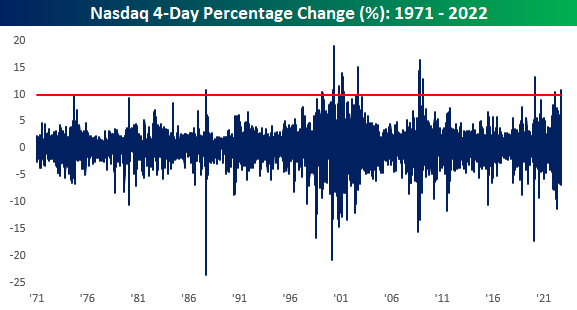
While every bear market is different, they often have similar characteristics … one of them being increased volatility across asset classes. So, we believe it important to provide some context to bear market rallies (inclusive of our current one): From 2000 – 2002 the Nasdaq had 14 individual days when it was up +6% OR MORE in a single day. Had you attempted to call the “bottom” following each said rally, while NOT following the DATA, you would have been WRONG 14 times, as markets subsequently fell lower after each knee jerk move higher.
Additionally, over the span of multiple decades, nearly half a century, there have been 16 times the Nasdaq has rallied greater than 10% over a 4-day span, each presenting as a bear market rally during extremely volatile times … from 1987, to multiple during the tech frenzy, the GFC (Great Financial Crisis), Covid crash and now 2 this year (typical #Quad4 environments) … Image provided by Bespoke Investments:
Volatility begets volatility … when Vol as measured by VIX, VXN or RVX (S&P 500, Nasdaq & Russell 2000 respectively) spike north of 29 into the 30s, it creates a massive downdraft for equities, making very little “investable”. At the same time, it’s this same volatility which in turn, perpetuates these violent upswings … while the TREND remains LOWER.
High volatility is NOT an investors friend, regardless of asset class; be it stocks, commodities, crypto currencies … even bonds.
When volatility as measured by the MOVE index is elevated it even becomes extremely challenging to be positioned of any size in what most would classify as “safe” and often “risk free assets” (government bonds); especially when it’s north of 130 (as it is today) and we’re staring at a negative -78 basis point 2/10’s yield curve inversion.
Recent single day fluctuations in rates have done what’s at times, taken months, even years to do in the past! Leading us back to … these are NOT signs of “healthy markets” or the “bottom being in”.
We’ve often noted, both bottoming and topping are processes which take place over time and space. Should anyone look at the current data with any semblance of intellectual integrity, it’s nearly impossible to conclude that we’re in the midst of a bottoming process or that this bear market is over.
As discussed above, wall street is constantly selling you, be it a story stock or a reason why the bull market is back. Again, over the last 5 to 6 months, they’ve sold you on why a YoY earnings miss of 40 to 60% is actually a “beat” after multiple downward earnings revisions.
Our September 2021 was fairly prescient as we’ve now cited it a few times in this piece, we’re going going back to the well once last time; again, we wrote:
By early next year, with slowing growth and inflation we’re likely staring at inflation adjusted GDP in the RED; yes, we’re talking negative real GDP … Top tiered Wall Street firms are predicting growth into the first half of 2022, but no one has a good answer on where they anticipate the growth to come from, outside of another expansive stimulus package (meanwhile, they are having trouble passing the infrastructure bill?!).
As we conclude, think about this … outside of the “best and brightest” on the street, in the media and at the Fed being abysmally wrong, what’s changed since we wrote these words OVER A YEAR AGO.
Consider all of the data we’ve presented in this note, coupled with the Fed hiking rates at an unprecedented rate (image courtesy of @realpristinecap):
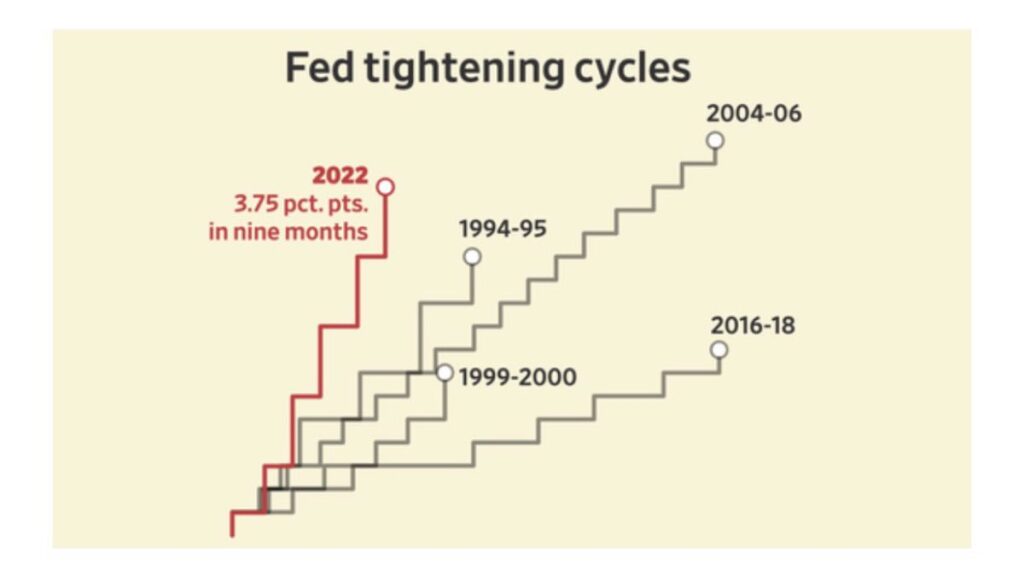
Which, as we’ve discussed in previous notes, creates a new, exceedingly high, cost structure across the entire global financial system, from individuals, to corporations and governments, while systematically tightening access to both capital and collateral.
Wall Street earnings growth per Bloomberg expectations for 2023 remains north of 5% in aggregate … again, they are lying to you.
They have no real data driven answers as to how they expect earnings growth, especially as GDP is about to be ZERO and then NEGATIVE in the foreseeable future (post the slight uptick due to YoY comps following last year’s omicron deceleration)
S&P 500 earnings have historically FALLEN by 15-32% during a typical recession (1991, 2001, 2020). In 2009 earnings declined 44% post GFC (the Great Financial Crisis)?! And here we’ll cordially remind readers that last month we detailed the housing market’s currently decelerating at a pace multiple times FASTER than it did during that 2008/2009-timeframe?!
We’ll also remind investors that markets from the S&P, Nasdaq and Russell are still getting smoked YTD in the face of wall street’s earnings shenanigans.
So again, investors have a choice. Are we going to get caught up in the daily panic attacks and noise wall street attempts to sell?! Or are you going to remain cool and calm; while fading your feelings?!
In our minds, the ultimate question most frequently boils down to, are we following the data to properly capture the longer to intermediate term trend?! So long as that answer is, YES, we’re not going to completely flip our positioning on every short-term bounce. If the answer is in fact, no, then we’ll immediately adjust accordingly.
Final thoughts…
It’s important to remember that the Fed’s policy ALWAYS lags. The current #Quad4 disinflationary investing environment we are now experiencing has always been in the cards; however, the Fed’s aggressive tightening via their “blunt tools” into multiple sequential #Quad4 slowdowns will without question, exacerbate the asset price pain!
A halt or pause in raising does nothing to address this new high cost of capital dynamic.
Additionally, in the spirit of Global recession: Eurozone inflation continues to rise, which shifts the spending of Europeans, as it does Americans and will also send them into multiple quarters of recessionary data.
This month alone, U.K. CPI was up +11.1%, Spain’s was up +11.8%, France up +6.2% and Sweden touched 10.1%, these are all new fresh all-time highs, while Italy’s +11.8% was 10bps off its all-time high; leading Eurozone CPI (in aggregate) up +10.6% YoY, up +1.5% MoM, which (say it with me folks) is a new all-time high!
And just as we detailed a few short months ago (September 2022), regarding the importance of where many FAANG stocks derive a large portion of their revenue/earnings from, components of the S&P 500 see north of 33% of their earnings from the eurozone. Given their continued inflationary pressures, it is sure to further contribute to a deeper U.S. earnings recession collapse.
As we’ve stated for nearly a year, GDP will first crater from 7 to 2, then to zero and eventually it will trough in outright negative territory. This, as we head deeper into a U.S. corporate profit recession. This will force even more U.S. based businesses to expand their cost cutting efforts (layoffs) even more than they originally believed they’d have to, creating a self-feeding downward spiral.
However, even with GDP and inflation falling, and layoffs rising … there will still be no data points directly tied to the Fed’s mandates that will be anywhere near a level which would trigger any meaningful bailout large enough to thwart off this U.S. corporate earnings recession.
So, given all the aforementioned, the below is a quick (and, yes incomplete) synopsis:
- Losses in Crypto estimated at $3T (roughly 40% of the GFC’s entire loss in one asset class alone)
- Nearly 20% of GDP (i.e., the housing market) is deteriorating at an unprecedented pace
- Auto markets collapsing
- The consumer has leveraged themselves on high interest debt
- Financial firms are tightening access to ALL credit
- Delinquency rates on ALL loans are spiking
- The Fed is tightening, increasing the cost of credit and collateral to institutions while shrinking their balance sheet
- Credit spreads continue to widen
- Volatility in all markets, including bond markets remain elevated
- And … Counterparty risk spreading (CDS)
Risk managing this environment is NO easy task, though, we’ve still got multiple #Quad4 disinflationary investing environments ahead to navigate and we’re up for the challenge.
Just as one would to reveal the 3D image inside the autostereogram, we’ll continue to:
- Relax in an effort to see through the noise, while
- concentrating on a focal point at the center of the 2D image as we “try not to get distracted by looking around the picture”]
We’re going to follow the data, which is the North-Star of our process, while at the same time, do our absolute best to crystalize the full, 3D picture, which is actively being suppressed behind a massive wall of repetitive wall street marketing (that continues to be proven wrong).
Again, your starting point should ALWAYS BE THE DATA!
We will also continue to write in an effort to provide readers insight from multiple angles which we believe to be extremely important in both keeping ourselves entrenched in all the data via deliberate study, while educating readers on how best to learn/understanding how economic cycles work.
Good Investing,

Mitchel C. Krause
Managing Principal & CCO

4141 Banks Stone Dr.
Raleigh, NC. 27603
phone: 919-249-9650
toll free: 844-300-7344
mitchel.krause@othersideam.com
Please click here for all disclosures.

