

In This Article


Fool me Once …
We’ve all heard the proverb before, “Fool me once, shame on you … Fool me twice, shame on me”. If you search the web for its “meaning”, you’ll find the following:
Knowyourphrase.com Recognizing that you fell for the same trick twice and realizing that you should’ve been able to identify it the second time around.
Wiktionary.com After being tricked once, one should learn from one’s mistakes and avoid being tricked in the same way again
Grammarist.com if someone takes advantage of me twice, I only have myself to blame.
Does the nuance matter? Does it have to be the “same trick” for you to not be tricked in the “same way” again for you to learn?
In the end, it simply means: Adapt, evolve, and learn from your mistakes.
It took me quite some time to learn and truly understand how the inner facets of this business work, while I won’t bore longtime readers with my story, this next statement cannot be stressed enough; what you are being told by @CNBC, C-level executives, Wall Street/Hedge fund “experts”, and the Federal Reserve Academics is most frequently factually incorrect.
They feed you a story that comes from people with an agenda: a CEO doesn’t want his stock to fall, so he tells you a story about “growth in the back half of the year” … the Wall Street experts have a business model which gathers assets and gets paid a percentage – as the stock market rises, so too do their revenues, so they tell you a story to “buy the dip” … Hedge fund managers will talk their book in an effort to find incremental buyers or sellers depending on their positioning … and the Federal Reserve officials have to maintain and portray “confidence in the system” or the house of cards will fall, so they maintain their story of confidence and predictable control.
I’m embarrassed to think it took me as long as it did to figure the system out, but when I did it was scary and liberating all at the same time. If you can’t believe all of these people, who can you believe? What can you believe?! And the answer is data … bean-counted by the best independent research team in the game (Hedgeye) … you can believe in Rate of Change math and calculus; none of which Wall Street does, because it doesn’t suit their purposes.
In our managed accounts, we teeter on flattish to up performance for the year. Meanwhile, equity markets are down 20 – 30% with many individual equities being down 60 -80% … we continue to pursue our goals of capital preservation and alpha. While we are not a true “long/short” manager, or a “short” fund, we’ve been strategic with the tools at our disposal to get to where we are now.
The answer to our success in this current economic environment is the Data … it lies in learning and understanding what economic regime we are coming from and where we are going based upon the Rate of Change and directionality of both Growth and Inflation.
The Federal Reserve is in the midst of hiking interest rates into one of the largest economic slowdowns in history, during which we, guided by the Hedgeye team, have outperformed. Meanwhile, Chairman Powell cites the “Beveridge Curve” in his most recent address, speaking directly to the American people. In today’s note, we’ll hammer home the data, but more importantly, what’s to come and why you need to stop listening the “Neon Gods” was in details that we provided last month. We’ll begin with the primary narrative pushed by Fed Chairman Powell …
JOBS
“The labor market appears to be more in balance and that depends not only on the level of those things it also it depends on how well the matching function in the labor markets are working because the longer these expansions go on you can get very efficient with all of that and the Beveridge Curve shifts out and that also tends to help” Fed Chair Jerome Powell 5/4/2022
In the spirit of last month’s discussion regarding the belief in “Neon Gods” (who are embarrassingly and perpetually incorrect) along with the theme of this note in learning from one’s mistakes … as Fed chair Powell is citing the Beveridge curve to the American public regarding a strong labor market, we cited the below on April 4th, a full month before Powell took to the podium in May:
“They (the FOMC) are backwards looking – they don’t understand labor is as late cycle as it gets… As margins compress – profits fall – layoffs are around the corner – these (expletive deleted) will be tightening into one of the largest slowdowns in history” OSAM 4/1/22
So, who should you believe?! Us or the Neon Gods?! The answer is neither … you should believe the data which we happen to cite, rather than cowardly referring to an obscure academic measure that you’ve never heard of (the Beveridge Curve) … but suits their narrative of confidence. Unfortunately, a fable is all they are telling you, allow us to explain…
The March U.S. JOLTS data showed a cycle high of 11.5MM job “openings”; up 283K MoM … with “RETAIL” leading the charge up +155K MoM; yet there are countless reports out there suggesting many of these job “openings” are reported MULTIPLE times over… See the below thread Mike Green (@profplum99) of Simplify recently had on twitter on this specific subject:
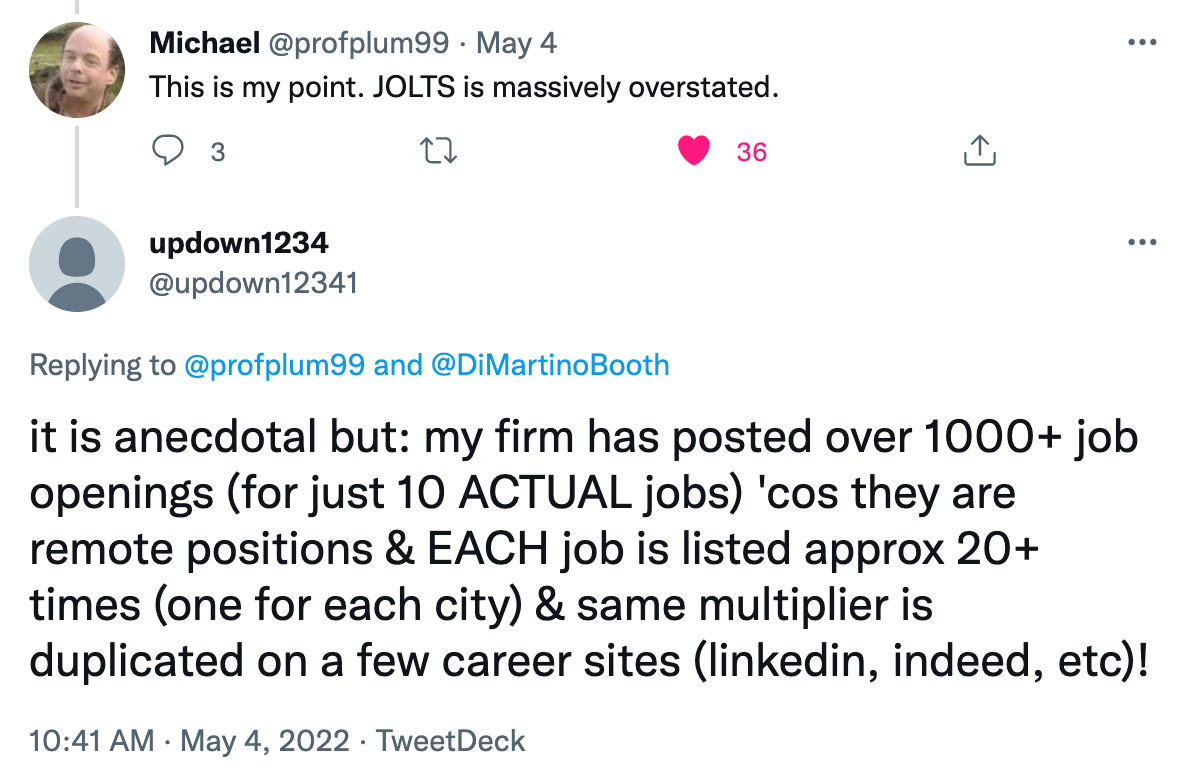
In this example, a single firm has posted over 1000+ times for a meager 10 jobs, listed in multiple cities, across numerous platforms. This represents a single example of countless, it would be impossible to list them all …. This is VERY bearish in our opinion! Mike is one of the smartest in the business and we’ve been screaming for the past 4 months (at minimum) LABOR is a LATE cycle indicator.
For months we’ve been screaming, as earnings shrink, margins will compress and it will lead to abrupt layoffs … which, again is what the data is already telling us with large companies such as $NFLX, $PTON, $CVNA and more importantly $AMZN (to name a mere few) having already announced layoffs, while tech monsters like $TWTR, $UBER & $FB recently initiated hiring freezes.
The FED’s disingenuous citing and “analysis” of the Beveridge curve does NOT pick up the overstatement in the JOLTS data which the accuracy of the Beveridge curve relies on. The Beveridge curve is the relationship between the unemployment rate AND the JOLTS data (or jobs vacancy rate). Are you beginning to understand why the Fed is always behind the curve doing the exact wrong thing at exactly the wrong time as they now raise rates into one of the most precipitous economic slowdowns in history.
And while many would consider our above twitter conversation example “anecdotal”, should you if layoffs are already showing up in the data?!
April ADP private payrolls report was just reported at +247K jobs (a near yearly low), a 48+% decline from March’s 479K print (a MASSIVE MoM DECELERATION?!). MORE IMPORTANLY, small businesses CUT roughly -120K jobs. Excuse me Chair Powell, care to remind us how strong the labor market is?
The more troubling aspect of Powell’s Beveridge curve statement is he’s got to know he’s full of **it, just as Jamie Dimon knew the economy was drastically weakening when he stated a month and a half ago that:
“The economy is strong” Jamie Dimon (4/4/22)
These two are either incompetent, lying through their teeth or both … but let’s face it, they likely didn’t get as far as they have in life by being dumb?!
The Economy…
…is so strong that April’s ISM Manufacturing saw a -1.7 decline to 55.4, its second sequential MoM decline. Additionally, new orders declined -0.3 points to 53.5 which brings us back to levels not seen since the belly of covid shutdowns.
U.S. ISM Services also decelerated in April to 57.1 from March’s reading of 58.3; digging even deeper into the data, new Orders slowed to 54.6 from 60.1 with Employment falling to 49.5 from 54.0.
Adding insult to injury, prices accelerated from 83.8 to 84.6 (again, another data point signaling margin compression as the consumer can only handle so many price increases before they crack). There was even an acceleration in the number of industries showing increased concern over elevated inventories as companies over ordered to replenish depleted inventories at exactly the wrong time.
We informed you about this absurd inventory bloat last month:
- Rail Traffic decelerated -3.12 in March from +5.69 as many companies have stockpiled inventory heading into an enormous consumer spending halt with:
- Inventory costs and warehousing prices are at the highest on record (h/t to Danielle DiMartino Booth for the important call out)
If you could imagine re-stocking empty store shelves, replacing your entire inventory over and above traditional levels at extremely elevated prices just as the consumer literally runs out of money … It is exactly what happened!
How do we know?!
First by being full cycle investors and having an understanding this deflationary investing regime would be hitting us Q1/Q2 of this year, as we told you it would last September. While the most “well respected” Wall Street firms had growth accelerating … we wrote:
By early next year, with slowing growth and inflation we’re likely staring at inflation adjusted GDP in the RED; yes, we’re talking negative real GDP … Top tiered Wall Street firms are predicting growth into the first half of 2022, but no one has a good answer on where they anticipate the growth to come from, outside of another expansive stimulus package (meanwhile, they are having trouble passing the infrastructure bill?!).
Our warning more specific to consumer spending coming to a halt in 2Q22 came in January of 2022 … primarily due to lack of transfer payments and a $1.3 Trillion government spending gap?
As you can see below, pulled directly from table 1 boxed in red, one can see total YoY spending shortfall of $1.3 TRILLION DOLLAR in 2022, the brunt of which landing squarely in Q2 of this year.
We continued…
This GAP in government spending alone is what creates a virtually mathematical certainty of a deflationary 2Q2022, irrespective of other inputs; Remember PPP? $1,400 checks? Additional $600 checks? $500 monthly child tax credit?? Yeah, they’re all gone, they don’t exist anymore!
Last month we reiterated the desperation of the US consumer citing Bank of America’s credit card data?! This, in the face of one virtually everyone telling you how strong the consumer was (Including JP Morgan CEO, Jamie Dimon).
“March retail sales DECELLERATED significantly MoM (Month over Month) from February’s up 18.18% to March’s up 6.88%. This is a massive RoC deceleration and only a matter of time before it goes negative as Bank of America credit card data shows the consumer literally hit a wall mid-March … just as we’ve been telling you they would; no more tax refunds, no stimulus, no government transfer payments, no child tax credits. All of this adds up to a $1.3-TRILLION-dollar black hole…
All at a time when spending on necessities like food, fuel and housing is at the highest levels of the modern era and over 50% of Americans don’t have more than $1,000 in a bank account.
Is this where we re-remind you consumer spending comprises 70% of US GDP?”
We provided you with what was a near mathematical certainty, while Wall Street provided sound bites, which again is in fact EXACTLY WHAT HAS HAPPENED!
Additionally, in April we also made a very particular call out regarding the only segment of JP Morgan’s business that happened to be accelerating, which were their consumer loans … noting a. it was a BAD THING and b. WHY?
“Consumer loans were one of very few things accelerating … but is this was not a good sign, because people NEEDED to borrow money!”
Please find below a historical graphic of consumer borrowing; due to the time log, we’ve emphasized the most recent sequential month over month (MoM) moves which have literally gone vertical.
Image courtesy of Hedgeye Macro analyst Christian Drake, @HedgeyeUSA – May 6, 2022
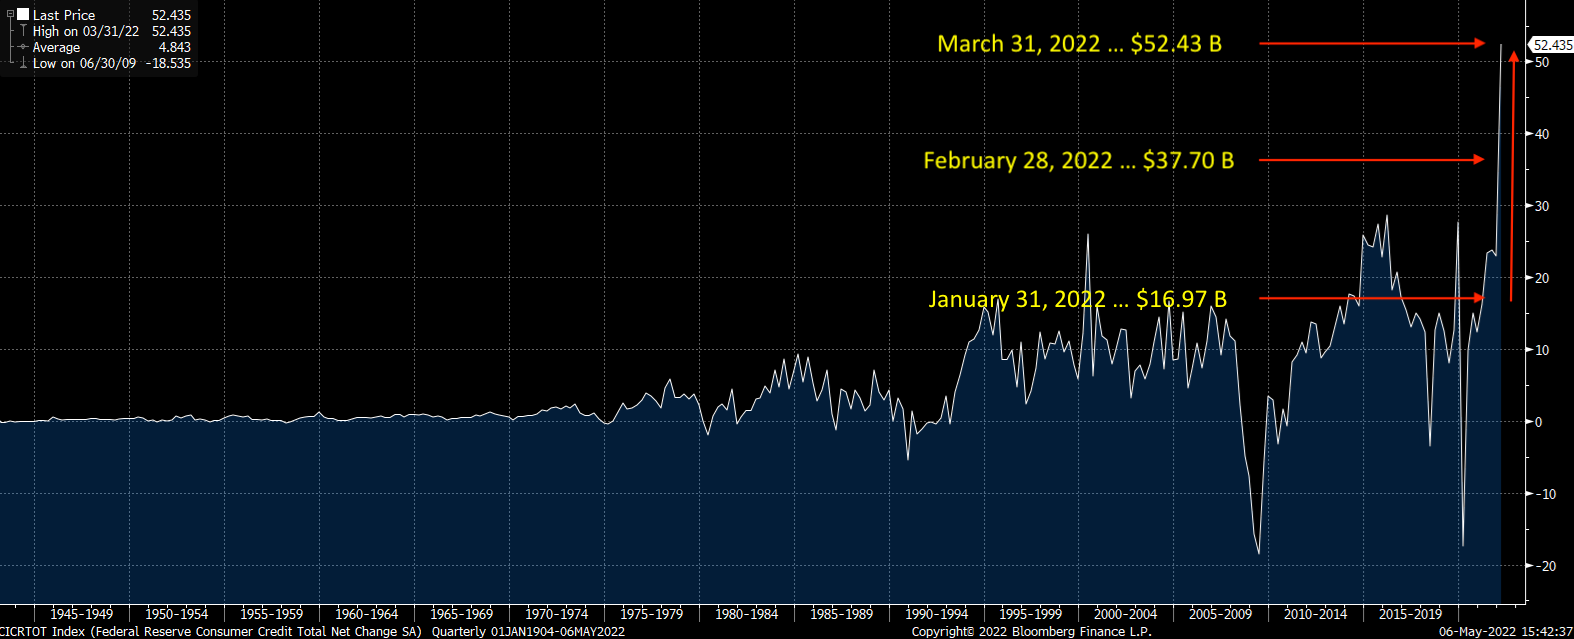
Again, the last two months have literally hocky sticked to SEQUENTIAL Month over Month ALL-TIME HIGHS, and while this data is subject to revision, it’s being corroborated by April’s most recent data coming out of credit card companies such as Capital One ($COF).
The national rate on credit cards is nearly 16.58% and climbing, lower credit scores borrow north of 25%, which means borrowers tend to tap their credit cards only as a measure of LAST RESORT; when they have exhausted all other resources, albeit cash or sources of cheaper credit such as home equity lines … (again, THIS IS NOT GOOD)!
All of this coincides with the Bank of America Credit Card data we shared last month showing the consumer hit a virtual brick wall in Mid-March!
As we discuss the current condition of the consumer, it’s also important to call out a very recent and pertinent data point per Equifax … subprime credit loans past 60-days delinquent are rising faster than normal and have done so for 8 consecutive months, nearing pre-pandemic levels. Additionally, per the WSJ article:
“Delinquencies on subprime car loans and leases hit an ALL-TIME HIGH in February (emphasis ours).
Equifax’s tracking goes back to 2007 … which means this all-time high is inclusive of the GFC (Great Financial Crisis) of 2008-2009 … I don’t know about you, but that also sounds bad to me?!
For a moment, let’s pretend that we haven’t been providing you with copious amounts of data on this very subject for months now … curated and modeled brilliantly by @Hedgeye. If only there was a proxy we could use as an example, detailing virtually everything we’ve been describing over the past 6 months regarding the health of the US Consumer?!
Ironically, last month we noted that certain bellwether companies are phenomenal barometers for taking the temperature of things to come. For example, we had been citing the deceleration in used car prices via the Manheim index as early as January, which flowed through into CARMAX’s ($KMX) most recent earnings last month; essentially front running the WSJ article by months…
IF ONLY we could get a glimpse inside some of the world’s largest brick and mortar retail companies that the majority of our country relies on for … oh, I don’t know …. let’s say … EVERYTHING?!
Walmart $WMT
$WMT announced earnings last week of $1.30 vs. Wall Street expectations of $1.48; a huge miss for them. While revenues held in, margins got HAMMERED due to sticky inflation, primarily in both food and fuel. The company took down guidance for both Q2 and the back half of the year. Readers know by now we’ve been citing a 2Q2022 consumer slowdown since mid-last year but apparently senior management of these companies along with Wall Street appear to be just getting the memo.
The importance of what’s in this release and the company’s admission means much more than people understand, as it provides a brutal painting which foreshadows things still to come in corporate America! The rippling affects are likely to be chilling. Walmart touches everything; technology, supply chains, shipping, trucking, fuel, food, consumer goods … EVERYTHING!
Hedgeye retail analyst Brian McGough @HedgeyeRetail made a few very important call outs noted below. The first being the company cited higher COGS (Cost of goods sold) due to inflation and “aggressive inventory buys over the past few quarters”
- Grocery was up low double digits (necessity)
- Health and Wellness was up high single digits (important items)
- General Merchandise was DOWN low DOUBLE DIGITS (discretionary – NOT NECESSARY)
Hedgeye Jr. retail analyst Jeremy McClean also cited an extremely important statement from the company:
“we knew that we were up against stimulus dollars from last year, but the rate of inflation in food pulled more money away from general merchandise than we expected as the customers needed to pay for food.”
The consumer is shifting their purchases from wants to needs … in a BIG WAY … these products often have smaller margins.
Avid readers know we’ve been pounding the table over the last quarter, discussing the looming negative impact wage inflation would have on company balance sheets; low and behold:
Walmart’s US operating expense (also known as SG&A: Selling, General & Administrative expense) was UP 95 bps “primarily due to increased wages related to last year’s hourly wage investments and associates returning from covid leave more rapidly than anticipated”
Which, say it with me folks, negatively impacts MARGINS
Walmart reported US comps of 3%, DECELERATING 2.60% (260 bps) from 5.6%, this slowdown is HUGE, even when smoothing the average over a 2-year duration considering the impacts of covid and supply chain issues. The negative flowthrough to Gross Margins was 92 bps QoQ (Quarter over Quarter): from a +54bps to a NEGATIVE -38bps
“Three-quarters of the decline related to higher-than-expected supply chain costs, including fuel and eCommerce fulfillment” – additionally, grocery mix shift was also a pressure”
We almost forgot to mention … US inventory being up 33.4% on sales up 4% … too much product, bought at extreme levels that no one’s buying! (now, where have you heard that before?! It sure wasn’t from Jamie Dimon or Jay Powell … when I told you above that most of what comes from Wall Street, Fed officials, Sr. management and Hedge fund managers is self-serving BS, I was NOT kidding!
What if it wasn’t just Walmart?!
Target $TGT
Walmart competitor and consumer goods behemoth Target also reported revenues that did come in slightly ahead of expectations”, though comps came in up 3% DECELERATING against last quarter’s 9%; EBIT margin came in at 5.3% vs. an expected 8%; translating into a 29% MISS on EPS of $2.19 vs. $3.07 “expectation”.
The company has now guided the full year (2022) DOWN by 25%, while modestly trimming 2Q22 margins by a meager 50% … FIFTY F’IN PERCENT!!! THAT’S NOT A TRIM, IT’S A MASSACRE!
The company cited pressure on the … say it with me again folks … MARGIN; including, but not limited to, higher markdown rates on LOWER-THAN-EXPECTED SALES in the “discretionary category”, increased compensation (i.e., WAGE INFLATION) flowing through as a negative.
Elevated freight and supply chain costs as well as … wait for it … higher than expected SG&A expenses also attributed to the miss. (If any of this doesn’t sound familiar, please re-read the “WALMART” section above)
Moreover, Target’s inventory build was up 43% YoY (larger than Walmart) vs. sales which were up a meager 3% (smaller than Walmart) … again, as they face a consumer that’s currently on life support.
This will eventually lead to steep discounting further exacerbating margin compression leading into the back half of 2022, quite probably exacerbating the disinflation to deflation.
For the inquisitive, the inventory to sales ratio would still be excessive stripping out the Covid year, looking back on a 2-year basis.
Sadly, it’s not just brick and mortar stores as Amazon $AMZN just told us they are attempting to “shed” 10 million square feet of Warehouse Space, and the Washington Post, the paper owned by former Amazon founder and CEO Jeff Bezos, just wrote an article last week discussing how Amazon has too many workers … the piece is titled, “Amazon’s new labor issue: What to do?”
Ummm, you FIRE THEM!!!
Fascinating, that’s not the articles conclusion … we’ll take the other side of that trade…
So, please forget about what executives are telling you. What does the Walmart $WMT and $TGT results, coupled with the $AMZN news say to you, for the data speaks more loudly and HONESTLY than any corporate CEO ever would … and it’s screaming:
Sticky inflation has forced the American consumer to shift their spending AWAY from discretionary goods (i.e., general merchandise) TO necessities (i.e., FOOD) as companies overloaded inventories at extremely high prices and expanded at too rapid a pace. We also know from recent retail sales data that there has been a 37% shift in spending on fuel (gas) as the consumer is now putting the few extra pennies, they have left into their gas tanks as the current administration literally just cancelled:
“one of the most high-profile oil and gas lease opportunities pending before the Interior Department”
The decision, which halts the potential to drill for oil in over 1 million acres in the Cook Inlet in Alaska, comes at a challenging political moment, when gas prices are hitting painful new highs.” Per CBSNews
Aaaannd then decided on May 5th to bid for 60 million barrels of oil come the fall of 2022 to replenish the SPR (Strategic Petroleum Reserve) … you know, the reserves they began depleting no more than a 6 months ago to reduce the price of gas.
Nothing like telling the oil market there will be a large bidder in the market come fall as fuel prices remain elevated (you seriously can’t make this up).
Speaking of not being able to make this stuff up … between the time I wrote this note and got it back from my editor, on May 24th, the Biden administration just announced another release of 50 million barrels from the SPR … the economic incompetence is truly mind numbing.
The above exercise isn’t to discuss which flaming dumpster fire of a company one should be buying today, the read through to everyone should be how virtually every recent earnings report is telling you the same story about the condition of the American consumer; and it’s NOT a good one.
You see, it’s NOT JUST Walmart, Target or Amazon!!! It’s Kohls, Children’s Place, Ross Stores, TJ Maxx … Foot Locker Inventory is up over 37% vs. sales up 1%. It’s not just retailers … it’s healthcare, technology, financials … it’s John Deere ($DE) missing sales across multiple segments even with strong pricing increases of up 9%.
Inventory gluts, slowing sales, compressed margins (or net interest margins at financials) are translating into LAYOFFS! As Hedgeye CEO Keith McCullough has said in the past, “crashes happen slowly, then all at once”, as this corporate earnings recession gets even more ugly, first layoffs happen slowly, then all at once!
Most C-level executives at the largest of corporations have ZERO forward thought or macro-economic awareness. neither do majority of “financial professionals” who “manage” assets, they have NO risk management process … both have relied solely on the Federal Reserve to save their businesses, careers and client’s retirement accounts for the last 2 decades … only now, with inflation at 8%, there are limited levers for the Fed to pull.
So again, is it shame on them or shame on you for allowing the “neon Gods” to fool you again, and again, and again or are you going to learn from your mistakes?!
Dear Jamie Dimon…
… would you be so kind as to remind us of what drives the economy?!
Last I checked, small business was considered the heartbeat of America (and they just laid off 120k) and consumer spending equates to roughly 70+% of US GDP (and they just run out of money) … so, if you’d be so kind, what will be driving future GDP growth?! And before you say…
Housing/Mortgages
In March we began highlighting the rapid deceleration in housing data. Much of which can be attributed to the rapid acceleration in mortgage rates due to, but not limited to the Fed’s lack of MBS purchases which stopped in mid-December (among a handful of other central planning induced failures). leaving us to ask some very pertinent question re: housing:
“As 30-year fixed mortgage rates just spiked to a 4.66% average making the average house roughly 13-15% LESS affordable than last year as most home buyers determine purchase price based off what monthly payment they can afford; begging the questions:
◦ Who’s going to be refinancing homes at these levels?!
◦ Who is left to refinance with rates being so low for so long?
◦ How will this move in rates affect borrowing via home equity lines?!
◦ And more importantly, how large of an impact will this have on housing prices?!
All of this leads to a slowdown in spending!”
April’s housing data (recently reported in May) coupled with numerous other economic data releases have begun to answer many of them and it will disappoint even the most avid promotors!
The most recent NAHB HMI (National Association of Home Builders Housing Market Index) data, which essentially measures builders’ confidence focusing on three major subcomponents … current sales conditions, traffic measures and future sales expectation … released last week FELL 8 points MoM, plummeting to 69 from 77 (the lowest reading in 2 years). It’s important to note ALL THREE metrics cracked in unison, exposing weakness across the board.
- Housing Starts came in at 1.724 million, decelerating from March’s 1.728 million
- building permits decelerated to 1.819 million vs. 1.879 million in March
- And … MBA mortgage purchase applications collapsed -11.9% WoW – Index reading at 225 which is down 25% from the average January level of roughly 300
-
U.S. Weekly Mortgage Apps saw a mild uptick to +4.1% W/W, however the trend continues to be a YoY deceleration, the second lowest week of purchase apps in two years
- While Refi Activity remains an unmitigated disaster -9% W/W and -71% Y/Y
Remember last month when we told you refi’s would slow as only 3% of mortgages made sense economically??! That’s what the data is confirming, that’s why we follow the data!
And finally, the “housing” river card was just thrown … with New Home Sales just coming in at 591k vs. 749k expected and last print of 763k … ladies and gentlemen, talk about DEMAND DESTRUCTION.
Shifting gears
We won’t dissect the most recent CPI report at length this month, but it’s important to take a brief look under the hood to provide as to explain the “topping is a process” thesis. The most recent CPI data came in up +0.3% MoM and +8.3%; which is a mild disinflation from +8.5% … but why?!
We first noted the decline in used car prices in our 4Q2021 note published in January…
“Used Cars as measured by “Manheim Market Report (MMR)”saw a 1.3% price decline over the first two weeks of January”
At the time the 1.3% decline was small, but noteworthy in our eyes for you need to “dis-inflate” before you “deflate” … Since then, the Manheim Used car index has seen one of its worst starts on record.
The most recent Manheim mid-month update shows used car price with a YoY gain of 9.7% … you might be thinking, UP 9.7% is not deflation … and you would be correct. At the same time, we’ve attempted to brow beat this point home … again, the Fed cares about “absolute” levels, Markets, however, care about “directionality” and “RoC” (Rate of Change); so, while 9.7% is up YoY, it is a DECELERATION from April’s up +14% from March’s up +25%, February’s up +37% and January’s up +45% … this is a MASSIVE deceleration in used vehicles which removed roughly 37 basis points from the CPI calculation.
This data also coincides with the Equifax reports of the auto loan delinquencies at all-time highs and CARMAX’s earnings report.
Had it not been for the deceleration in used car prices, the most recent 8.3% CPI print would have been roughly 8.7. Again, topping is a process … the used car data will continue to decelerate, but at a less rapid pace. At the same time, the deceleration in other material inputs on lags such asl, agricultural products like corn and wheat, industrial metals like copper and housing, coupled with more difficult YoY comps (base affects) will start to kick in making the disinflation to deflation more visible over the next quarter or two.
Wealth effect
All of the above correlates directly with this next section … the importance of these thoughts can’t be stressed enough. Unfortunately, it took me longer than it should have to figure it out over my career … talk about shame on me … better late than never!
Nothing in this universe is ever just one thing but a collective of many things, how they flow, how the interconnected pieces affect each other and more importantly, what are the implications of and where/how will they manifest?
These next few nuggets of data and information come from Hedgeye financial analyst Josh Steiner. Just one more of many additional knock-on effects that have yet to be figured into this enormous jigsaw puzzle. No one really knows exactly how all of this will turn out, if someone tells you they do, RUN, they are lying.
At the same time, these are conversations that need to be had in an attempt to stay ahead of the curve.
I’ll be both paraphrasing and quoting, though the credit should go to Josh. He has been lights-out accurate with his data and second level thinking; he forces those willing to pay attention to play 3-D chess while others are playing simple checkers….
At the beginning of the year, the NYSE & NASDAQ had roughly $30 and $25 trillion on the exchanges, respectively. Quick and dirty math given ballpark YTD declines of 15-25% (they are currently larger we publish). This equates to a quick and dirty $4.5 trillion wiped away from the NYSE and $6.25 Trillion from the NASDAQ totaling between $10-11 Trillion in negative wealth effect.
Per @HedgeyeFIG, there are different academic thoughts to how the wealth effect flows through to spending though, “most of the studies converge around a number of 5.5 to 6% so for every dollar of unrealized gains or losses the impact on spending is around $0.055 to $0.06.”
If you apply the above to the $10-11 trillion currently lost year to date, we’re staring at a negative wealth effect of approximately $600 to $650 billion dollars. With nominal GDP at roughly $24 trillion dollars, the negative wealth effect has the potential to shave approximately 270 bps (2.7%) from GDP.
For perspective, Hedgeye’s 2022 GDP growth currently sits at 278 bps (2.78%) … stated differently, impact from this negative wealth effect can alone wipe away this entire year of GDP growth. Hedgeye CEO Keith McCollough had this to say about these thoughts:
“200 to 300 basis points of GDP is the former cycle pre-pandemic peak of GDP … GDP typically peaks around 3% and decelerates towards 1%. So, when you talk about unplugging 80% of it, that’s a major, MAJOR issue” ~ Hedgeye “The Call” 5/18/22
And while this is back of the envelope, quick and dirty data, it doesn’t even include the wealth loss in the crypto markets which peaked at $3 trillion in November of 2021, and currently sits at $1.3 trillion (Steiner notes this is a global number, with the US global share of that wealth at ~30%). Things get a bit muddled here as the representation of someone’s total net wealth is typically more concentrated in crypto making the flow through multiplier far greater than the $0.055 to $0.06 though, less important for the overall point).
Additionally, we’ve been discussing the meteoric rise in interest rates and its negative implications on housing prices, coupled with the lack of availability to capital via HELOC (Home equity lines of Credit) or straight up cash out refi’s (refinances) based on them no longer being economically sound to 97% of mortgage holders … it all ties together!
While the overall size of crypto markets may be small, consider the total value of housing market cap closely rivals that of total equity market cap of the stock market … so as housing prices roll over, the negative wealth multiplier compounds on this as well. (Housing carries with it roughly a $0.04 flow through, but still … you get the point).
We didn’t even mention the average student loan payment being $450 per month, which hasn’t been paid in 2 years but will restart come August. That’s $450 LESS disposable income of spending from anyone with a student loan payment…
When considering the negative wealth effect of both Crypto and Housing collectively, with the negative impact from equity market declines coupled with the anemic consumer, GDP can outright contract (as in … go negative)
Last month we noted:
“the confidence of the top quintile that represents 40% of that spending (who are those who make over $100k per year) has shrunk at one of the fastest paces in history!”
Wonder no more why consumer confidence data that has literally reached epic All-Time-Lows?! Things can get pretty bad when even the wealthiest of Americans have lost confidence; it’s not just us saying so, when we say data dependent, we mean data dependent:
- NY Fed’s May Empire State manufacturing survey dropped 36 points coming in at -11.6, vs. expectations of +18.2 with new orders & shipments falling at:
- “their fastest pace since early in the pandemic”
- The Philly Fed’s regional survey dropped -15 points (a 25-month low)
- May Michigan Consumer Confidence registered a new low of 56.3, down from April’s 65.2; expectations also declined to 56.3, from 62.5
-
NFIB: Forward Outlook a new ALL-TIME low:
- Owners expecting better business conditions in the next six months dropped to the lowest level ever recorded”
- Q1 Productivity fell -7.5% (worst drop in over 70 years)
- Q1 Labor costs up +11.6%
- U.S Services PMI slowed to 53.5 vs. 55.6 in April (lowest level in 18 months)
- U.S Manufacturing PMI slowed to 57.5 vs. 59.2 in April
The data is screaming both All-Time HIGHs and LOWS negatively on the margin … “worst drop in over 70 years” … “All-Time low” … “falling at its fastest pace since” … there is NOTHING good about any of this data!
The lack of availability to capital combined with persistently high prices is quickly revealing itself devastating, even to those who provide the necessities of the world to the consumer, now consider how it will adversely affect large ticket items and home expansion projects ala big box home renovation names like Home Depot and Lowes?! At this point, I don’t know who this won’t adversely affect?!
Final thoughts
In the Walmart section we began by writing this:
The importance of what’s in this release and the company’s admission means much more than people understand, as it provides a brutal painting which foreshadows things still to come in corporate America!
Not only does the data in this entire piece provide foreshadowing of things still to come, but it also more importantly should educate every single reader neither Corporate America nor Wall Street understand business cycles or Rate of Change math. I am NOT the smartest guy in this business, the $1.3 trillion dollar spending gap and lack of transfer payments was so glaringly obvious a high schooler could have figured it out … and yet, the CEO of the largest bank in the country tells you the economy is strong a week before his year over year earnings got decimated by -42%. “Fool me once, shame on you. …….”
They will blame things like supply chain issues, the Fed now tightening, inflation, Russia, et. al. but at the end of the day … everything we’ve written since September of last year has proven accurate while little to nothing of what the “experts” have said has been even remotely close to true and every single one of these CEO’s, Wall Street analysts, Federal Reserve officials and “experts” have literally MISSED this corporate earnings recession that’s just getting started.
Inflation is transitory … The economy is strong … The consumer is in good shape … We should be able to achieve a “softish” landing … Inflation is too hot; we’re not doing enough … The FED is ALWAYS behind the curve.
Yet, something continues to bother me, which we touched on last month in the “and the people bowed and prayed” section. We talked in that section about the old adage, “don’t fight the Fed” … to which I wondered “So … now it’s ok to fight our NEON Gods at the Federal Reserve?!” I continue to wonder, why everyone now trying to fight them (The Fed)?!
As the Fed continues to scream hawkish rhetoric, forcing structured product managers to bid treasury yields higher based on “Fed expectations”, rate hike expectations continue to hit new highs daily!
Having said ALL of the above … with all major indices having either their worst or second worst starts to the year, CFTC options positioning is NOT all that negative: SPX remains a net long at +64K contracts, Nasdaq remains a net long at +14K contracts, while the Russell 200 is net short of only -70K contracts.
While implied volatility positioning is still showing complacency with IVOL discounts, especially in mega cap tech names such as AAPL -17%, MSFT -17%, AMZN -25%, and FB -35%.
Meaning, professionals are still VERY LONG AND COMPLACENT … typically not the signs of the end of a bear market.
Multiples on story stocks with no earnings remain extremely elevated, suggesting (at least to us) that there is way more room on the downside than people think … At the #HedgeyeLive investors conference, Danielle DiMartino Booth stated it much more eloquently, as she detailed why the Powell Put most likely has a much lower strike price than the majority of people think (paraphrased)…
Structural deficiencies still exist, as we wrote in April 2018 and as we reminded readers last month:
“the level of corporate debt back then was just north of $10 Trillion, while today it’s pushing over $12 Trillion with nearly $1 trillion of non-financial debt globally that needs to be refinanced this year alone…”
Earlier this month, Hedgeye macro analyst Drago Malesivic emphasized this thought in his 5/6/22 Early Look note:
“total U.S. nonfinancial private debt and public debt has risen to ~282% of GDP, up +26 percentage points over 3Q18 levels”
In our August 2020 note, we again detailed market structure, specifically in High Yield bond ETFs and structured income products … though things have deteriorated further today, as both political and legal headwinds exist (detailed in our September 2021 note).
The Exit
When I was a child growing up in NJ, football was EVERYTHING to me. It was constant, non-stop … I think I slept with a football in my bed. Living relatively close to the Meadowlands, 30 minutes outside NYC, the Giants were my team. I used to love going to watch them play in person. The tailgating, the smell of charcoal grills, the food … the players looked larger than life and truthfully, being with my father and brother are memories I’ll never forget! I could go on endlessly about what I loved about those Sundays … but there was one annoying thing that my Pop did, which I could never figure out.
We would get to the stadium fairly early and regardless of how many parking spaces were open closer to the stadium, my father would always park super close to the exit, while also facing the exit. The part that bothered me the most was that we would always leave in the 4th quarter with a good amount of time on the clock. Yet I always wanted to stay until the end of the game … until I finally got my wish.
While I don’t remember the specific game, it was one where the score was very close into the 4th quarter and I begged my Pop to stay till the end… “They still have a chance Pop, we missed the last come-back, come on … please, please, please…”. I wore him down to the point that he acquiesced. All it took was that one experience where we stayed until the very end for me to learn that not I, nor my brother, nor my father, were prepared to pay the price of sitting for hours in traffic as everyone in that stadium was trying to leave at the exact same time; every exit was bottlenecked for what felt like miles in distance and forever in time. “Fool me once, …..”
When these markets really crack, everyone will be headed for the exits at the very same time; markets will likely hit circuit breakers, possibly day after day and you’ll be lucky to get out. So, remember, sometimes it’s OK leaving the game a little early, especially when you already have a big lead and the known outcome of that game is highly probable.
Sincerely,

Mitchel C. Krause
Managing Principal & CCO

4141 Banks Stone Dr.
Raleigh, NC. 27603
phone: 919-249-9650
toll free: 844-300-7344
mitchel.krause@othersideam.com
Please click here for all disclosures.

