

In This Article


A = kB or A = k/B
In the world of Mathematics, the above equations represent a direct relationship (positive correlation) and inverse relationship (negative correlation), respectively (where k = a nonzero constant). A direct relationship is one where two variables do the same thing, while an inverse correlation is a relationship in which two variables move in opposite directions (as one increases, the other decreases and vice versa).
Mathematically speaking, an extremely remedial example of a direct relationship would be the radius of a circle and its area; the larger the radius, the larger the area, they are directly correlated. An example of an inverse relationship would be the correlation between speed and travel time; the faster you go, the shorter your trip will be and vice versa.
In the world of economics, an example of a direct correlation would be the number of hours worked relative to pay; the more hours worked, the larger your paycheck while an inverse relationship would be interest rates relative to the price of a bond. As interest rates increase, the price (and in turn, value) of a bond will go down, as rates go down prices will increase.
Some correlations are perfect … they are rules, laws if you will. A perfect positive correlation means that 100% of the time, the variables in question move together in the same direction; this is statistically represented by the value of +1.0, while a perfect inverse or negative correlation is a relationship that exists between two variables that move in the exact opposite direction all the time; the perfect inverse relationship is represented by the value of -1.0; a 0 indicates no correlation at all.
As noted, not every correlation is perfect, for instance, there is an inverse correlation between the US Dollar and commodities, when the dollar rises, commodity prices often fall; when the dollar falls, commodities frequently rise. Currently the S&P 500 has a -0.83 relationship with the US Dollar over a 15-day period while the CRB Index has a -0.84 relationship with the USD over that same period. Brent Oil has a -0.70 relationship over a 15 day yet a 0.44 positive correlation over a 30-day period.
Clearly, these correlations are NOT lock n step, they are NOT absolutes, so while it’s extremely important to know they exist and understand them, it’s equally important to not anchor on them. It takes a tremendous amount of information and data at your fingertips to function at a high level in this business, the granularity and quality of data Hedgeye brings to the table, like the above correlations, is truly second to none…
Today we’re going to draw your attention to an observable correlation, while being extremely mindful of “resulting”.
Resulting occurs when one attempts to directly connect or correlate a consequence or outcome to something that’s just occurred.
As we noted in both our July and August notes, our performance diverged from broader indices with the increase in the SARS CoV “Delta” variant. Our portfolios were set up for “the reopening” and performing very well heading into the Q2 quarter end, though as the Delta variant cases spiked, our reopening trades suffered at the onset of Q3.
It’s important to remember much of October’s data comes from both August & September, which is telling us (in the rearview mirror) what July prices already have – a rapid acceleration in Covid cases created a deceleration in consumer confidence, which adversely affected both services activity and service sector employment (leisure, hospitality, food service, etc.); which, is why our “reopening trades” suffered.
Given Delta’s rise, the US experienced a slowdown in economic growth from July through Delta’s mid-September peak, which further exacerbated Q3’s stagflationary investing environment.
Keep the correlations in mind as you read on. If the surge in Delta cases adversely affected consumer confidence, which in turn, created a deceleration in services activity and service sector employment, then the inverse would be that a decline in Delta cases should lead to a reacceleration for confidence, activity and employment, no?!
Having said that, covid cases are now in decline, having fallen -48% off their peak in the last month.
Markets are smart, the data has been mixed, and while Stagflation is the current market regime, it won’t take much to shift the regime from stagflation back to reflation, which is something we are watching very closely. A better-than-expected print in one of the heavier weighted metrics like, Hours worked, Labor Income, Jobless Claims, and Non-Farm Payrolls and we could find ourselves back in a “reflation” regime relatively quickly, OR NOT at all; we’ll allow markets to provide the answer to this question, they will tell us.
With inflation remaining persistently strong, the investing regime for Q4 was most likely to be determined from the economy’s growth side of the equation anyway.
Though, before hitting on growth, let’s briefly touch on the inflation side of the equation first, for not only is it persistent, but a very strong case can be made for a reacceleration in this data as well.
INFLATION
For some time now, we’ve been preparing you for persistent inflation. First, we began buying commodity related assets well over a year ago; last August (2020) was when we added ($FCX) to our portfolios. While we’ve discussed our more neutral positioning though the election, we noted in March just how truly out of touch Wall Street historically is with commodity cycles, we wrote:
“CLUELESS … Is where Wall Street has been through all of this! As we were long select commodities in 2019, Goldman Sachs literally cut their commodities trading desk February of 2019”
We continued to educate our readers on the most probabilistic path for inflation in June as we literally walked readers through the CPI release. Though, while outlining the explosion higher, we were very deliberate in stating inflation was very likely to hang around for a little while suggesting it would be “persistent”; first noting the price of Oil/Energy (which we’ll discuss below), though more specifically, we called out the “Shelter” component of the CPI calculation as the primary Elephant in the Room.
“One of the largest components to the CPI calculation, a subsector of “ALL items less food and energy” is SHELTER; broken down into two components … Rent of primary residence and Owners’ equivalent rent of residence. Shelter comprises nearly 33% of the CPI …THIRTY THREE PERCENT … and as you can see from the below image, the cost of shelter has recently begun to move higher.”
In that same June note we attempted to provide readers with a mental image of inflation’s persistent nature:
“we’re moving from an environment where growth and inflation has accelerating faster than any previous time in history to one where both will be mildly decelerating, yet still persistently high. For a moment, think stepping on the gas of a Porsche, launching it from 0 to 100 mph to then lighten up on the gas pedal gently settling your speed at a comfortable 90 mph. Quite different than a deflationary event which would be akin to slamming on your breaks abruptly decelerating from 100 to 20 mph.”
That was then, this is NOW
While it is NOT our goal to have you re-read previous notes in their entirety, in understanding a cycle within a cycle, many things we stated in certain notes remain true today, for example:
“Energy prices have exploded as Oil continues to push new cycle highs nearly daily. Economies around the globe continue to re-open, summer driving season is upon us, air travel is normalizing to pre-pandemic levels while refiners have yet to fully ramp production; all of which has oil pushing $75 p/barrel. June’s most recent CPI print does NOT reflect current per/barrel oil prices of $75.”
Everything we stated (outside of summer driving season being upon us) remains factual. Though, just as the CPI levels for June did NOT consider $75 per barrel of Oil, with the deceleration of activity in July and August, the price per barrel of oil fell to the LOW $60’s in August, the current CPI is NOT factoring the CURRENT $83 price per barrel of Oil (which would represent a significant reacceleration off August’s $61 level); Oil/Energy being one of the heavier weighted CPI components.
Additionally, while we may not be staring at the summer driving season, we are NOW facing what is slated to be a very cold winter, with oil, gas and propane inventories at historically low levels AS we’re also seeing a clear reacceleration of Travel and leisure off the August lows. While just one of many examples we could cite, Delta Airlines CEO Ed Bastian recently stated on the company’s earnings call:
“Business traffic improved in July “but paused at approximately 40% recovered for the September quarter 2021 compared to September quarter 2019 as corporations delayed the reopening of offices due to the COVID-19 [Delta] variant.”
Though he expects business traffic to pick up as “Nearly 60% of our [corporate] accounts are telling us that they’ve already reopened their offices with an additional 10% expected to open their offices before year-end,”
Bastian notes the slowdown and further highlights the reacceleration into year-end just as everyone on Wall Street and Federal Reserve officials have cut growth estimates. As is typical, they have gone the wrong way, at the wrong time, and they’ve gone too far (for now)
As we also stated in that June note: “Given oil’s weighting in the CPI calculation, this data point alone could change the trajectory of inflation. But it likely won’t be alone”
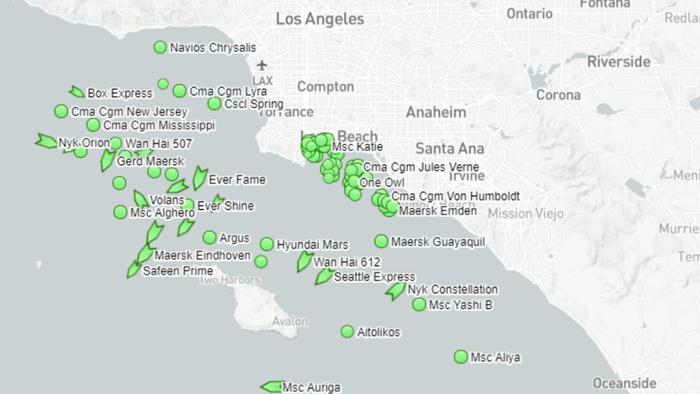
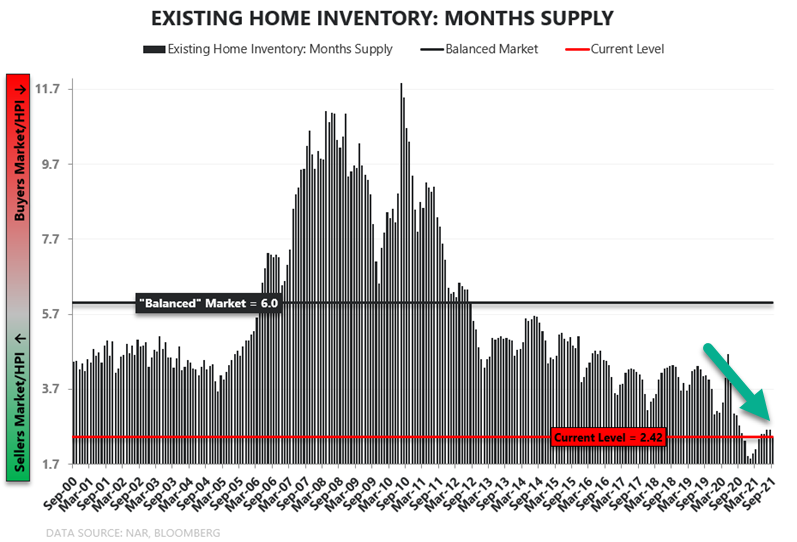
Remember Housing – i.e., Shelter?! OR 33% of the CPI component?! While EXISTING home sales were reported by the National Association of Home Builders as 6.3mm units, good for a 7% MoM acceleration during October. What few homes are available for sale are selling like hotcakes, those under construction attempting to be built are having trouble being completed. With a record setting, estimated $22 BILLION worth of cargo just sitting, stuck on container ships off the coast of California, do you wonder why?! (Think toilets, tub enclosures, sinks, faucets, etc. manufactured in China)
In the spirit of a picture is worth 1,000 words, Hedgeye CEO Keith McCollough recently provided twitter with a snapshot into the current housing inventory debacle, noting: “What’s the catalyst for US Housing Deflation again?”
Adding insult to injury, LATE OCTOBER PPI DATA came in at +8.6% YoY, representing a new cycle high. While some might suggest this number is slightly “lower” than “consensus expectations” we’ll remind you of a few things courtesy of Hedgeye Director of Research Daryl Jones (@hedgeyedj).
“Interestingly, while final demand PPI was +8.6% . . . intermediate (pipeline) prices were much higher -> Stage 4 +11.6%, Stage 3 +20.2%, Stage 2 +22.7%, and Stage 1 +19.9% … he continued, “Obviously as leading indicators go, these pipeline prices suggest that the PPI has more upside from here”
For those who don’t know, PPI (Producer Price Index) is a LEADING INDICATOR FOR CPI (Consumer Price Index) … Here is another example of correlation – PPI feeds through to CPI.
As inflation hangs around for a little while longer, CPI should as well, especially with price increases broadening in everything from, Rubber, Palm oil, Natural Gas, Oil, Cotton, Lumber, Shelter (rent), you name it – it’s higher.
With our case laid out for #inflation, let’s take a look at the other side of the equation; that being:
Growth
Statistically speaking, the most probabilistic outcome for Q4 was for us to remain in a #stagflationary environment (one in which inflation #accelerates (which we discussed above) coupled with a #deceleration in economic growth; (again, #Quad3 in Hedgeye vernacular)). However, since the unexpected Delta spike pushed GDP lower than anticipated in Q3, we expect to see a rebound in Q4, with a reacceleration in both growth and inflation that we are well-positioned for.
This is what we mean by an unexpected cycle within a cycle. The slowdown paused the reopening, but it didn’t kill it. Spending is reaccelerating as Covid cases are decelerating at an extremely rapid rate – a good example of an inverse correlation.
Markets are forward looking; they are a discounting mechanism for the future, constantly pulling in data; some of which is from the past, though without question, it has the potential to change future investing economic regimes. Most investors often dismiss old information as “STALE”, when in fact, these data could have a direct correlation to the future directionality of the Rate of Change off the previous quarters numbers.
Markets are simultaneously looking backwards anxiously awaiting perceived “lagging” data points, while at the same time, discounting the probabilities as to whether forward-looking data will accelerate or decelerate off a final (yet to be determined) number (real growth in this case or inflation as outlined above).
The more data markets can digest, the more firmly planted markets will trade within the highest probabilistic economic regime (#Goldilocks, #Reflation, #Stagflation or #Deflation; as outlined in July).
REMEMBER, how we began the piece discussing both positive and inverse correlations:
If the surge in Delta cases adversely affected consumer confidence, which in turn, created a deceleration in services activity and service sector employment, then the inverse correlation would be that a decline in Delta cases should lead to a reacceleration for confidence, activity, and employment, no?!“
What does the data say???
Data from early October confirmed the July to mid-September slowdown, it also unveiled incrementally positive data from September (suggesting improvement) while late October data continues to confirm a #reacceleration in growth; allow us to explain:
October 1st US PCE was reported up 0.42% MoM, marginally decelerating 20 basis points YoY, to up 7.0% (AUGUST DATA). Both services consumption and aggregate private sector income decelerated by 60 basis points … Those decelerations incrementally push down Q3’s numbers.
We then saw a glimpse of incrementally positive data with September’s U.S ISM Manufacturing report, again, released in early October, which came in at 61.1 vs. 59.9 (+1.2 MoM). As shocking as this may be, businesses continue to cite “escalating costs from every direction”, but who could have seen that coming (palm, meet forehead)?! Additionally, U.S. ISM Non-Manufacturing data accelerating in September to 61.9 vs. August’s 61.7 with the price component increasing to 77.5 from August’s 75.4.
LATE OCTOBER has been showing us what earlier October did not … actual October data, NOT August, NOT September, but OCTBER and currently, this data is confirming a #reacceleration in Consumer Confidence … with the OCTOBER Consumer Confidence report coming in at 113.8, which was an acceleration off September’s reading of 109.8 and crushed the more bearish “consensus” number of 108.2. Additionally, September New Home Sales can in at up 800k which was another acceleration off August’s 702k and “consensus” of up 760k.
Additionally, with roughly 42% of the S&P 500 reporting Q3 earnings, earnings growth is up north of 36.62%, beating “estimates” at this point by over 13% on average.
One month into Q4 we’ve seen a significant reacceleration off the Delta-suppressed Q3 data and that’s what markets are telling us … until they don’t; till that day arrives, we’ll say it again: “#persistentinflation + a #reacceleration in growth = a #reflationary investing environment (or #Hedgeye #Quad2) and it’s showing up in the data…”
We do, however, believe ambiguity remains in Labor Markets…
I’m going circle back to a sentence from above: “A better-than-expected print in one of the heavier weighted metrics like, Hours worked, Labor Income, Jobless Claims, and Non-Farm Payrolls and we could find ourselves back in a “reflation” regime relatively quickly”
Labor market data has been mixed September into October with the labor component of the ISM Non-manufacturing report mildly decelerating to 53, while ADP private payrolls accelerated +568k vs. August at 340k. Initial Jobless claims followed shortly and continue to drop week over week sequentially from 364k to 329k to most recently 290k, respectfully. Continuing claims also continued to fall to 2.59mm from 2.72mm. The employment number that startled investors most was total non-farm payrolls rising by a “meager” 194k IN SEPTEMBER, again, leaving the door open for a significant acceleration off these data points.
Whether it is or not, we anticipate labor data to be muddled over the next few months. While it’s being reported that more individuals voluntarily left their jobs in August, we’ve seen all too many reports of workers being forcibly removed from positions in not complying with vaccine mandates.
Muddled or not, markets care less about the why and more about the directionality of data. So long as the data is moving in the right direction markets will likely categorize this as a win for growth in the services sector. Markets appear to be front running the data, with the deceleration in cases being the catalyst; how’s that for an inverse correlation?!
GLOBAL CYCLE
Covid’s Delta variant has not only created a cycle within a cycle domestically, but globally as well. Since Delta cases are peaking at different times in different locations, each market is being treated, well … differently!
It is important to note, that correlations both shift and change – as we stated above, it’s also important to note that the same correlations don’t always carry across the globe.
From a portfolio positioning standpoint, much of Europe is in a #reflationary investable regime, however, Covid Case counts are rising in some places; a primary reason we’ve reduced our exposure to Germany, Switzerland, France and the Netherlands; at the same time, there are some countries whose case counts are nearing all-time highs, yet their markets continue to scream higher, like Russia among others.
These countries are your COMMODITY RICH countries; the inflation is trumping the covid correlations. Russia doesn’t need their consumer confidence levels to be high when Oil is topping $85 ppb, neither does Norway or the Netherlands.
Delta cases are still increasing in some areas and have yet peaked, though when they do (or get close to) we might just witness the same cycle within a cycle that we’re seeing here in the US?!
One thing is for sure, similarly to what we’re seeing here at home, European countries are seeing a reacceleration in inflation data with some numbers coming in at levels that haven’t been seen since 1981, such as German Import Prices registering up 17.7% YoY and up 1.3% MoM as France PPI accelerated to up 11.6% YoY is an all-time high.
Most recent COVID data per Hedgeye has “trends in the U.S. down -14% W/W, w/ global cases +3%, as Europe continues to accelerate (Russia +12%, Ukraine +46%, Netherlands+51%, Germany +33%, France +16%, Poland +89% and so on)”. We’ll be watching closely to see how these correlations play out.
Final Thoughts
The thing with correlations is that there is no way to specifically prove a “DIRECT” causal link between covid cases and equity markets.
The markets were telling us what we needed to know … interest rates began to rise, gold and utilities began to sell off, at the same time small cap, high beta, financials, commodities, and energy related equities began to outperform …
From mid-September through the first two weeks of October two items out of the MANY were out of place. First, markets languished, which brought with it Wall Street “experts” calling for crashes, large investment firms along with Federal Reserve Banks slashing growth numbers. Though, while trading up and down over 1% for five straight trading days, market internals were signaling higher lows and lower highs, which is more a signal of a consolidation phase for those who recall that lesson.
The singular item “out of place” was the USD, which was “on the rise” per “technicians”; having broken above the 50-day moving average (GASP).
Amongst the noise and calls for crashes, on his morning Macro Show, Hedgeye CEO Keith McCullough offered a sense of calm among the storm, in song no less; “one of these things is not like the other” (it’s from Sesame Street for those that recognize it)
Follow the data, ignore the noise, on the whole, markets were screaming #Quad 2 #reflation and has rewarded those of us who positioned for it. While we haven’t picked up all of our July divergence pieces off the floor just yet, the last 3 weeks have been very favorable to us, and the quarter is only a month in…
I’m 25 years in this industry, have crushed markets in given years and yes, have underperformed at times. The underperformance typically comes in short spurts; while it’s not an excuse, it’s a factual statement. When I do diverge, I raise my hand, call out my mistakes from the very onset and hold myself accountable to them (as I have since writing about our divergence from its onset in July).
In ALL instances, I will NEVER stop learning from my mistakes, which in turn will make me better. At the same time, I have also accepted the reality that a solid historical track record will come with hiccups. If predictable returns are what you seek, I’ve got some great AAA-rated government securities that you might want to invest in. Granted, those securities yield negative returns, but still, very predictable.
I have built my business on a foundation of accountability, integrity, and solid performance, while avoiding large drawdowns and smoothing out the daily ride over the course of full investing cycles. If this is what you are looking for, then you’re in the right place.
Good Investing!

Mitchel C. Krause
Managing Principal & CCO
Please click here for all disclosures.

