

In This Article

“We continue to think that markets are functioning pretty well and are generally appropriate given the underlying differences across countries and policies and economic situations.” U.S Treasury Secretary Janet Yellen, 10/11/2022
The Ass & His Driver
An Ass was being driven along a road leading down the mountainside, when he suddenly took it into his silly head to choose his own path. He could see his stall at the foot of the mountain, and to him the quickest way down seemed to be over the edge of the nearest cliff. Just as he was about to leap over, his master caught him by the tail and tried to pull him back, but the stubborn Ass would not yield and pulled with all his might.
“Very well,” said his master, “go your way, you willful beast, and see where it leads you…” Aesop Fables, Library of Congress
Unless you’ve been living under a rock, you’re familiar with Aesop and his many fables. You may not know them all, but you likely know more than you think you do. Many believe the more than 600 fables were not all composed by Aesop himself; historians believe Aesop to be an aggregator, a collector of stories which he retold to children over time, as “teachable moments”.
The beauty in these fictional tales resides in their elegant simplicity; clear enough for a child to comprehend.
The moral of this fable is simple … “They who will not listen to reason but stubbornly go their own way against the friendly advice of those who are wiser than they, are on the road to misfortune.”
We’ve paired today’s fable with a few recent quotes from our illustrious Treasury Secretary, Janet Yellen:
- “We continue to think that markets are functioning pretty well” 09/27/2022 & 10/11/2022
- “I think the United States is doing very well” 10/11/2022
- “I’m concerned about the loss of adequate liquidity in Treasuries” 10/12/2022
No, I’m not kidding … these quotes and dates are accurate (palm meet forehead). In this note we plan on addressing the idiocy … and if you’re not doing so already, you may want to think long and hard about who’s “friendly advice” you’ve been taking as it relates to your hard-earned wealth, accumulated over a lifetime!
As we noted in June, what’s transpiring in financial markets today isn’t a joke. Data shows a large acceleration in calls to suicide hotlines as investors are losing absolute fortunes in markets; housing/real estate, retirement accounts, 401k’s, private equity investments, pension funds, among numerous other investment vehicles are in an outright free fall while the head of the U.S. Treasury regurgitates contradictory nonsense; on the same day no less.
How the head of our U.S Treasury can utter the words, “We continue to think that markets are functioning pretty well” and “I think the United States is doing very well!” on October 11th, followed up by, “I’m concerned about the loss of adequate liquidity in Treasuries” on October 12th is downright scary.
The only thing that is clear about her statements are they showcase the seriously impaired mental capacity of an individual unfit for the position she holds.
While a lack of liquidity in the treasury markets should be of concern to everyone, the fact that we have an inept treasury secretary should be more distressing to all … especially in the face of reports that surfaced Friday, October 14th that the treasury department had called larger financial institutions asking them:
“… if the Treasury should buy back some U.S. government bonds to improve market liquidity.”
October 2019 we wrote about the Federal Reserve’s ever-growing problem in the “interbank lending” or “Repo markets”, which became extremely noticeable a few weeks into September of that year. The stress in the system was visible quickly. In December 2019 we attempted to simplify the complicated detailing the plumbing” of our financial system, in our piece titled, “Complexity, Fragility & Contagion” … we wrote:
“Money is constantly flowing from banks to dealers to the Federal Reserve; both on and offshore financial institutions constantly transact and, in an effort, to settle transactions/obligations from day to day … The liquidity primarily comes from overnight borrowing via repurchase markets (Repo) … Financial transactions take place and settle based upon a belief a security will be delivered in exchange for cash.
Collateral, typically in the form of short-term T-bills (Treasuries), is provided in exchange for dollars. The vast majority of these transactions occur on an o/n (overnight) basis (rinse/repeat) …”
You may recall markets proceeded to collapse a month and a half later, though I digress…
Today the problem is slightly different, for while Treasury Secretary Yellen believes there to be a liquidity problem in treasuries, we’d argue a. that’s what happens when the largest buyer of Treasuries (the Fed) removes itself from the market and b. we’d also contend there to be over $2.2 TRILLION of liquidity tied up in what’s called the RRP or (Reverse Repo Markets), where financial institutions are parking their dollars O/N (over/night) at the Federal Reserve in exchange for collateral (typically in the form of Treasuries).
Currently the Fed is paying these institutions roughly 3.1% for nothing other than the privilege of parking their dollars with the Fed on an overnight basis (bet you’d love to be getting 3.1% in your checking accounts, wouldn’t you?!
Apparently, rather than freeing up that cash and improving liquidity in treasury markets by slashing the interest rate paid to these financial institutions in the RRP markets (or outright limiting/temporarily closing the RRP window), the head of the U.S Treasury suggested … the government buy even MORE treasuries, thus further reducing supply; in turn, sucking even more liquidity from in the most critical market in the world.
You seriously couldn’t make this stuff up if you tried.
As we wrote in 4Q2018, the root of our problem largely lies at the hands of the Federal Reserve and their suppression of interest rates for an extended time frame … removing any form of true price discovery from the equation; thus, the very reason there are so few buyers of treasuries outside of the Fed and those who are captive to buying them.
“The Fed’s actions have artificially suppressed the truest of price measures our economy has; INTEREST RATES … Having done so for such an extended time frame, it’s nearly impossible to have honest price discovery in any asset class when THE asset just about everything else is priced off of (i.e. a spread off of these rates) is an artificially low manipulated disaster.” OSAM 4Q2018
As noted, the above quote was written in 4Q2018; needless to say, the problem has only gotten worse given the exponential growth in debt levels and leverage in the system since … but again, I digress!
The data vs. their Ouija board
Given the treasury secretary’s back-to-back quotes a single day apart, our best guess as to what drives their policy is either the use a Ouija board or child’s Magic eight ball?!
Long-time readers know we’re data driven … we do as the data does! It’s large and part the beauty of the @Hedgeye growth & inflation models … they measure both, accelerations and decelerations based on RoC (Rate of Change) math, which makes us largely agnostic to the direction of the data but gives us confidence in our set up/positioning among other things, such as:
- per the data this carnage is only the beginning … as we have been detailing for nearly 10 months!
- If for some reason the data changes … we know how to react to a change in trend
While we embrace uncertainty, the data is screaming so loudly an ostrich with its head buried in the sand could hear it, but apparently NOT Janet Yellen and her ilk as they continue to act like the stubborn ‘Asses’ jumping off the edge of the nearest cliff ignoring what both markets and the data are saying.
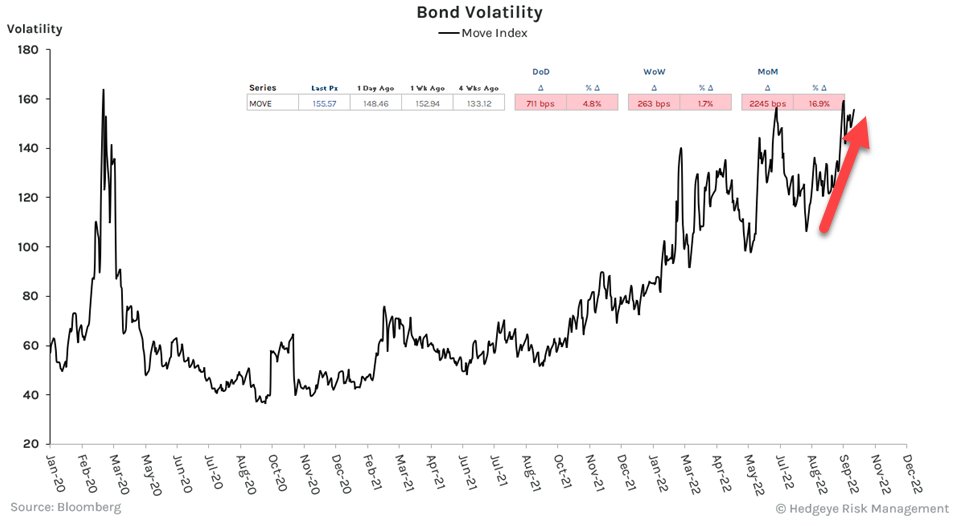
We’ll start with the simple example of bond Volatility, which is something that should have captured everyone’s attention some time ago. Bond Vol, as measured by the $MOVE index began trending higher at the same time both economic data and equity markets peaked (nearly a year ago, November 2021). Saying the MOVE index recently eclipsing 160 is “bad” is quite the understatement, for it’s a level last seen at the height of the Covid “pandemic”, though it’s been screaming “look at me, trouble is brewing” for multiple quarters now.
Hedgeye’s Josh Steiner @HedgeyeFIG, recently provided historical context for the MOVE index…
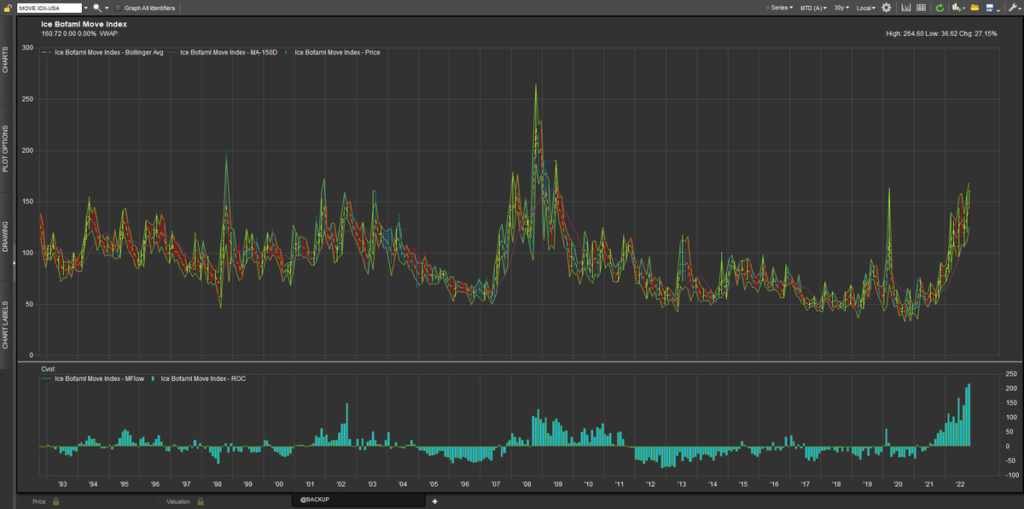
Historical context is so important for if you know your market history, you’ll note a 160 reading is NOT the company you’d like to keep! But if you’re Janet Yellen, markets can look strong (or not) … all on the same day?! (Be mindful of Aesop’s Donkey)
With this in mind, as noted above … given most all assets are priced off of “risk-free” assets (a spread off of U.S. Treasuries), credit market spreads have also been steadily widening alongside the MOVE index’s move, which again, began November 2021 (again, NOT NEW information) … this also coincides with a deceleration in corporate debt issuance and refinancing’s, along with a significant slowdown in high yield bond activity.
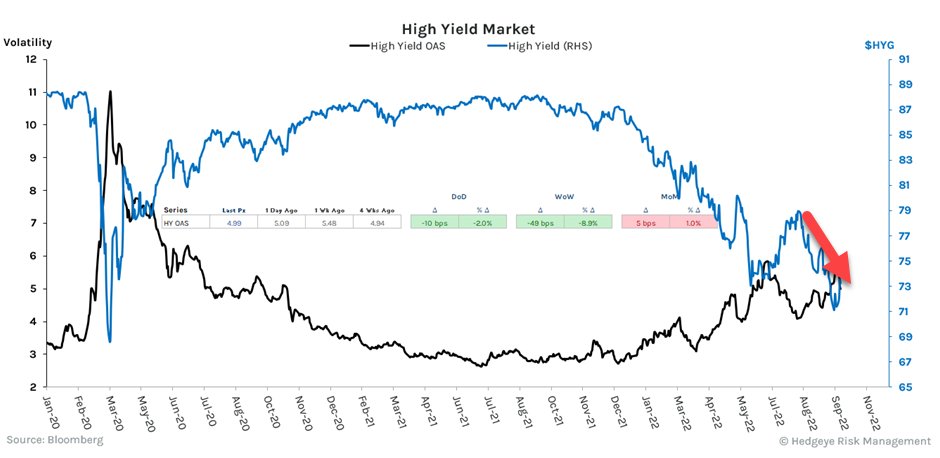
Again, please note from the above graphic high-yield OAS began to rise (black line) as bond prices began to fall (as measured by $HYG – blue line) in November/December 2021 (there are very few coincidences). Today, credit conditions are rapidly deteriorating, and bond prices continue to fall.
Dear Treasury Secretary Yellen, the MOVE index, interest rates & high-yield credit spreads all began trending higher at the same time the S&P 500, Nasdaq, Russell 2000, and all of Crypto peaked … which also happens to be around the same time economic data began to decelerate (again, mid-November 2021).
This didn’t just happen, it’s BEEN happening; and only a few of us have been documenting it from its onset; ironically, ZERO highly paid PhD ‘Asses’ (I mean, economists) the federal reserve employs …
As the MOVE reaches levels last seen during a modern global pandemic and the GFC (Great Financial Crisis), both of which Secretary Yellen FAILED TO SEE COMING, she was able to “earn” over $7.2 million dollars in speaking fees; paid for by Wall Street firms, hedge funds and large corporations the two years leading up to her taking on her new role as Treasury secretary … though, I digress … again)
It’s mind-boggling to think this is possible for someone who has failed in every measure of the word, of course, this is Wall Street!
The aforementioned market signals are NOT a sign that markets are functioning properly … these among countless others, coupled with the data are screaming BEARISH … and it’s about as bad as it gets, which we outline below.
Strong statement, maybe … though as we always say, don’t take our word for it … what does the data say?!
As we type, the Freddie Mac PMMS (Primary Mortgage Market Survey) touched 6.94% w/ .90 fees/points roughly making the loan 7.25% … however, the average mortgage lender is well over 7.35% at this stage of the game and those borrowers considered ‘less credit worthy’ (also known as ‘most of the country’), can expect a rate near 8.00% … (OUCH!!!)
These are levels not seen in over a quarter of a century and they’re impacting housing affordability greater than any time in history. It’s so noticeable, even the Rodeo Clowns are starting to talk about it, Per Morgan Stanley’s James Egan:
“Affordability is deteriorating faster than at any point in our data history” … “If we assume a 7% mortgage rate, affordability looks materially worse than today. And the pace of its deceleration has already more than doubled compared to almost any time in history” … “Sales are falling faster today than they did during the GFC”
I don’t know about you, but everything in that quote sounds “about as bad as it gets” on the bearish side to me?! Much like “ever” … “in our data history” is a long time, no?!
If Egan were merely pontificating, we may be talking about a different story, but he’s citing Rate of Change (RoC) data, and as we often say … the data is the data.
Hedgeye’s Josh Steiner has recently contextualized this deceleration in housing data about as clearly and succinctly as one can: it’s startling:
“It took roughly ~18 months for home prices MoM (Month over Month) on a SAAR (Seasonally Adjusted Annual Rate) basis to go from +10% to -10% in the lead-up to the GFC. It’s taken just 3 months for prices to go from +19% to -7% this time around.”
Think about that for a moment … in roughly 3 months, housing prices have fallen at a faster pace (MoM/SAAR) than that which led us into the abyss history knows as the Great Financial Crisis (GFC).
The current negative -26% delta (change) in data, is a greater percentage change than what took nearly 18 months to occur (negative -20% delta) in a fraction of the time.
While Steiner’s quote speaks to recent FHFA (Federal Housing Finance Agency) data (which is more current, though excludes larger ticket home sales), even those who focus on Case-Shiller data (which is a more delayed data series as it’s based off a 3-month rolling average, but does includes all sales) shows home prices decelerating at its fastest pace in the history of the data series moving from +17.4% YoY in June to +14.9% YoY in July (which is nearly 3 times the normal seasonal decline) though, includes sales initiated as early as March/April.
Making matters worse
If you could imagine things being worse, the results cited above are a product of mortgage rates being in the 4.5 to 5% range (a mere 2% increase off of December 2021 mortgage rates) … TODAY’s rates, however, are 2%, and in some cases 3% points HIGHER from the reported time frame, which again … produced the fastest deterioration of affordability than at “any point in our data history!”
As is the case with the CPI calculation, there is a lag in housing data for the home buying process can take months from contract to closing (this data is calculated off of closing home sales, while mortgages are typically locked in 1 to 2 ½ months in advance). With this in mind:
“The NAHB (National Association of Home Builders) confidence index registered 46, dropping -3 points MoM (Month over Month), its lowest level since early 2014” … but also:
The most recent housing ‘Permits’ data decelerated AGAIN, down -3.5% MoM, hitting new cycle lows … ‘Permits’ are a LEADING indicator for the housing industry … fewer permits = fewer homes = housing slowdown continues to accelerate … and while this data is bad, it can without question, get much worse.”
And it has … most recently, the NAHB builder confidence data fell for its 10 sequential month … but it didn’t just fall, it collapsed -8pt from 46 to a reading of 38. Mortgage purchase apps came in down -3.7% WoW, down -38% YoY; its lowest reading since 1Q2015 and single-family housing starts came in down -4.7% MoM, down -18.6% YoY, its lowest reading since 2018.
Outside of minor bounces off multi-year lows, the data continues to deteriorate, getting worse at a faster pace.
Recall: It’s all connected
Let’s think back to last month’s note and what FedEx ($FDX) CEO Raj Subramaniam, told the world:
“macroeconomic trends significantly worsened later in the quarter, both internationally and in the U.S”
We placed that quote in the section titled, “IT’S ALL CONNECTED” for a reason.
The macroeconomic trends didn’t just “significantly worsen” for FedEx alone, they are imploding globally and … it is ALL CONNECTED!
As we finish final edits, $AMZN (Amazon) is DOWN nearly 20% in after-hours trading with $AAPL (Apple) down 4.5%. Facebook or Meta ($META) had its turn getting crushed earlier today down -24%, while $MSFT (Microsoft) & GOOG (Google) jumped off their respective cliffs yesterday.
In our 2Q2022 note we wrote:
As if we haven’t cited enough data, the irony is we’ve barely scratched the surface of the elephant in the room which is the earnings recession unfolding right before our very eyes. If you’re buying into this “better than expected” absurdity, focused solely on your screens when they’re green, you’re missing the massive deceleration in data; from bellwether companies like $MSFT, $WMT, $GOOGL, $JPM, $SHOP, $SNAP to the smaller businesses reporting massively negative YoY data squeezing margins.
We’re not soothsayer, at the same time, understanding how things are connected via the business cycle, matters. It’s also important to understand the cycle through the lens of interest rates and leverage, for again, it’s all connected.
“in June of 1981 the Federal Funds rate peaked at 19.10%, in September of the same year the 30-year treasury rate peaked at 15.14%” OSAM 4Q2018
A factual statement, at the same time we’d suggest moderately higher interest rates in a vacuum are not entirely bad … but, when you combine the RoC (Rate of Change) in which rates are accelerating, with the leverage in the system that’s purchased everything from obnoxiously overvalued “assets”/equity to copious amounts of worthless debt as credit quality deteriorates and collateral evaporates in a blink forcing everyone to deleverage at the same time; we’ve barely scratched the surface of how “bad” things will get given the current rate environment.
In back to back sections of our 4Q2018 note, we described the very dynamic we’re faced with today, from the pickle the Federal Reserve had gotten themselves into: The Fed: 650… 535(+400)…250(+?) … followed up by an extremely remedial, but easily understandable example as to how the Fed’s policies allowed too much leverage to build up in the system over time: Understanding the game…. While we encourage you to go back and read those sections, we’ll do our best to summarize here.
We argued then, that the prolonged length of time known ZIRP (Zero Interest Rate Policy) where the Federal Reserve artificially suppressed interest rates pinning them to zero, encouraging irresponsible borrowing paired with poor capital management are the largest contributors to our current ticking time bomb.
For it gave:
“… every government, corporation, consumer, student, car buyer, etc., the opportunity to refinance/ borrowing more at a lower interest rate, while maintaining a similar payment.”
Insanely low interest rates paired with extending repayment timeframes gave everyone the illusion that they could:
“… afford “more house”, “more car”, “a more expensive education”, “bigger boat”, “more cloths”, “name brands”, “a bigger flat screen”, “a newer smart phone”, “larger acquisition”, “larger corporate repurchase plan”, etc.”
But we warned this charade could only last only so long in the face of rising rates, as we also noted:
“… for now, $T is ok, until they are forced to refinance copious amounts of debt at a rate 250-300% greater than where their debt is currently priced (just imagine where their debt should be priced if true price discovery were allowed to take place without manipulation from the Fed). When investors demand more interest for the risk they are taking, what do you think happens to companies who borrowed, overspent and over-levered in a raising rate environment?”
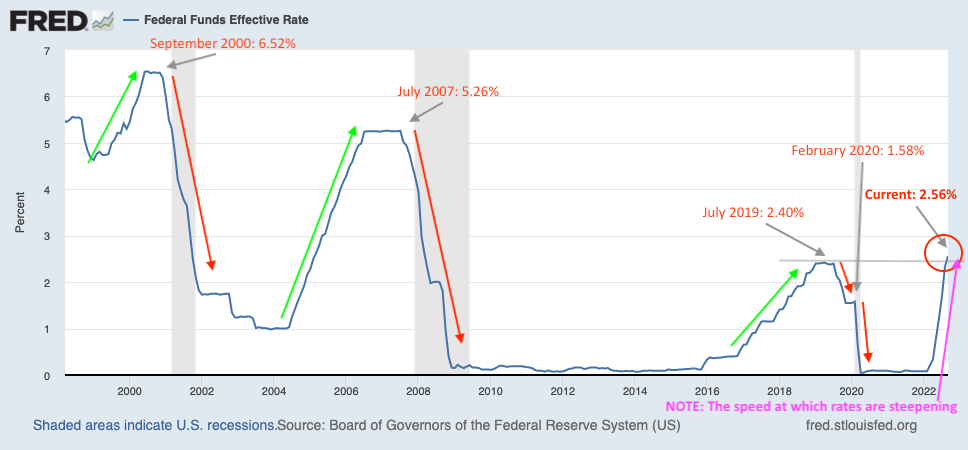
The duration of Fed rate suppression, created a near irreversible threshold (sans a complete credit default cycle) where borrowers no longer have the ability to absorb any notable increase in the cost of capital … which is why in past cycles, the Fed has never been able to increase the Federal Funds rate higher than the previous cycle high, which has just recently occurred (GULP)
Each subsequent bail out from the Fed’s own manufactured crisis (via failed policies) needed to be exponentially larger … Hence the section written in 2018 titled; The Fed: 650… 535(+400)…250(+?)(the 650… 535(+400) & 250(+?) representing the required basis points of stimulus needed to fund the next bail out.
We learned in 2020 that the (+?) amounted to nearly $5-7 trillion dollars of direct handouts, bond purchases, tac credits, etc., which fueled the inflationary hangover we’re dealing with today … just an unprecedented, staggering amount of money!
The Fed’s actions had been on a rinse, repeat cycle until now … for multiple reasons. First, typical QE produced asset price inflation, not the real-world inflation like what we’re dealing with today, which has left the fed with a very large problem. Simple asset price inflation can be ignored with the Fed pretending they didn’t do anything … they didn’t have to address it. However, with everything from food, gas and shelter choking the average Joe, now they have no choice but to address it.
Second, no one … not us, or anyone else with integrity truly knows bad this carnage will get, for too many reasons to cite, though allow us to paint a partial, unfinished picture.
We’ll again use mortgage rates in an effort to illustrate the price destruction dynamic that’s occurring in the housing market alone, right now. In December, a 30-year mortgage was roughly 3.00%, by March we had been warning readers about the demand destruction that was already underway, we wrote:
“• As 30-year fixed mortgage rates just spiked to a 4.66% average making the average house roughly 13-15% LESS affordable than last year as most home buyers determine purchase price based off what monthly payment they can afford; begging the questions:
◦ Who’s going to be refinancing homes at these levels?!
◦ Who is left to refinance with rates being so low for so long?
◦ How will this move in rates affect borrowing via home equity lines?!
◦ And more importantly, how large of an impact will this have on housing prices?!
All of this leads to a slowdown in spending!”
Now, we’ve answered many of these questions in recent months, for example, a mere month after writing the above, in April we noted:
“… the 30-yr fixed rate mortgage has shot up to nearly 5.25%, including points and fees … at these levels, per Danielle DiMartino Booth of Quill intelligence, there are only 3% of mortgages in the US able to be refinanced economically”
At today’s rates, it’s not economical for anyone to move, let alone refinance, but that’s less the point, in this section we’re talking price/demand destruction.
As discussed above, per the Freddie Mac PMMS mortgage rates, with points are equating to over a 7.22% rate for some borrowers, but as equity (i.e. collateral) like the value of stocks, bonds, mutual funds, other real estate holdings, lose value, banks tighten lending standards pushing the rate for the majority up near 8%.
So, let’s do an exercise together. Google “Mortgage Rate Calculator” and let’s use the same inputs: loan amount ($400,000), Loan Term (30-year fixed), Interest Rate (let’s first enter 3% … which is what your payment would have been based off of back in December).
Your payment should have come up as $1,686
Now keep all variables the same EXCEPT for the interest rate, go ahead and bump that up to 8% (which is what the majority of the country is currently facing) … did you get $2,935?!
That’s a 74% increase in mortgage payment over a 10-month time frame … staggering really!
Last step: hold the 8% interest rate and 30-year fixed time frame constant … why don’t you see how many times it takes you to change the loan amount until you match the previous payment of $1,686 per month!
We began this exercise in an effort to illustrate the “price destruction dynamic” currently engulfing the housing market, when you conceptualize what’s happening here in real time it’s truly mind numbing.
Think about it … the homebuyer who could “afford” a $1,700 payment in December 2021, had access to $400,000 of capital based off a 3%, 30-year fixed mortgage rate.
The current demand destruction in housing data we know about, which has led to:
“Affordability deteriorating faster than at any point in our data history”, as Morgan Stanley’s Egan noted
Or
“what took 18 months leading us into the GFC from a RoC deceleration in prices that’s currently taken 3 months to occur in home prices MoM (Month over Month) on a SAAR (Seasonally Adjusted Annual Rate) basis,” per Hedgeye’s Steiner…
Reflects mortgage rates from the April/May/June contracting time frame (when the 30-year fixed rate had increased to 5% (roughly)). The very same $1,700 per month home buyer now only has access to $292,600 (which equates to a 26.9% drop in “house price” that same buyer could “afford”)
Today, with rates nearing 8%, that same buyer can now only access $229,800, which is a further decline of 21.5% from what that very same buyer had access to in April/May/June. (Tell the truth … how many guesses did it take you to get to $229,800?!)
That’s a staggering 42.55% DROP in borrowing power over a 10-month time frame; or stated differently, it’s 42.55% less most Americans can pay for a house based on maintaining the same monthly payment. And for those not aware, most American’s budget their lifestyles around the belief of what they can “afford”, on a “monthly” basis.
As bad as the housing data is, it, like CPI is LAGGING DATA!
This is another example of both, a “cost of capital increase”, while also an illustration of a “collapse in the value of collateral” most have borrowed/leveraged themselves against, that the markets have yet to realize/price in.
And when it does, it will create an enormous deleveraging event across multiple asset classes. Who wants to go out and invest in financial firms (think BANKS/THRIFTS) right now?! (NOT US!!)
But could it get worse??? Yep! data per @GuyDealership:
- The average monthly payment on a new car just hit a new record high of $738 per month.
- 14% of new car buyers who use financing, now pay over $1,000 per month
- More than 1 in 4 consumers who financed an EV in Q3 committed to a monthly payment over $1,000
- New-vehicle affordability is the worst it’s been in years
In the spirit of “it’s all connected” … if consumers are getting buried in car payments at the same time mortgage rates have skyrocketed, as they’re getting squeezed at the gas pump and in the grocery store, does anyone really think the majority of consumers have the ability to afford more of … ANYTHING?!
While $AMZN (Amazon) earnings just gave us the answer to this question, longtime readers know that rather than guessing or selling you some marketing narrative, we’ll let the data answer this question!
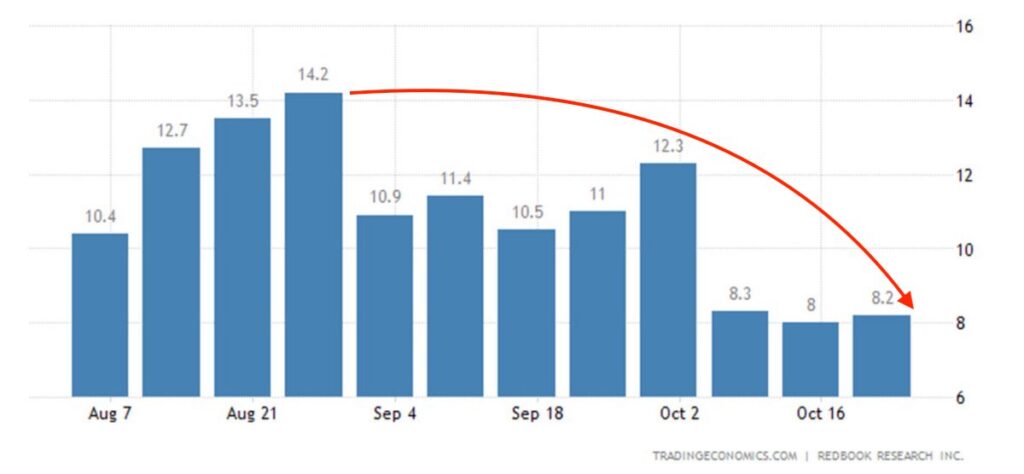
The data suggests the consumer is drowning … U.S. Redbook Retail Sales continues to collapse recently registered a new YTD low, up +8.0% Y/Y, versus +8.3% in the prior week and +12.3% before that … the lowest reading in over 2 years.
In November of 2021 (the Cycle peak) Real PCE (Personal Consumption) which measures “spending by and on behalf of the personal sector, including both households and nonprofit institutions serving households” … was up +7.43. In plain English, PCE measures the health of the U.S. Consumer which represents roughly ~70% of the U.S economy.
The Rate of Change of consumption has been decelerating since the cycle peak; though it really fell off a cliff from February 2022 into March 2022 collapsing from +6.67 to + 2.27; just as consumers started to run out of money … which is when we told you they would back in September 2021:
“By 2Q22, the deceleration in growth via GDP, earnings, etc. should be very noticeable”
It’s NO coincidence consumers then began tapping credit cards at a record pace heading into 2Q2022, just as there won’t be any coincidence that charge offs at financial and lending institutions will be spiking 1Q/2Q2023 as delinquency rates skyrocket (almost as if cycles have a pattern).
Nor should it come as a surprise to anyone that these same financial firms will be under-reserved for the onslaught of losses staring them in the face.
As we’ve been saying for what feels like an eternity now, everyone is running out of money and no one has access to cheap capital any longer, which is why this quote from last month’s note is so important to understand.
“The fundamental problem here is that you have entire business models and capital structures that have been built up over the past decade that were just based off of zero percent or very low levels of interest rates and now with rates and spreads where they are, and continue to go, the math just doesn’t work.” Andrew Friedman @Hedgeyecomm “The call” 9/27/2022
Friedman’s using the term capital structures, we’ve been saying cost of capital, but in the end, we’re saying the same thing. When your capital structure is based on anemically low interest rate levels, to zero in some cases; at the time rates move higher as cash flows are disappearing … WE’VE GOT AN ENORMOUS PROBLEM.
We believe those who want to compare this crisis to 2008 are in for a rude awakening, for back then the primary issues were more isolated to the housing sector and poor risk assumptions in the CLO/CDO markets.
Today, with every tick up in rates it equates to a higher cost of capital (borrowing cost) up and down the entire borrowing vertical in an obscenely over leveraged WOLRD.
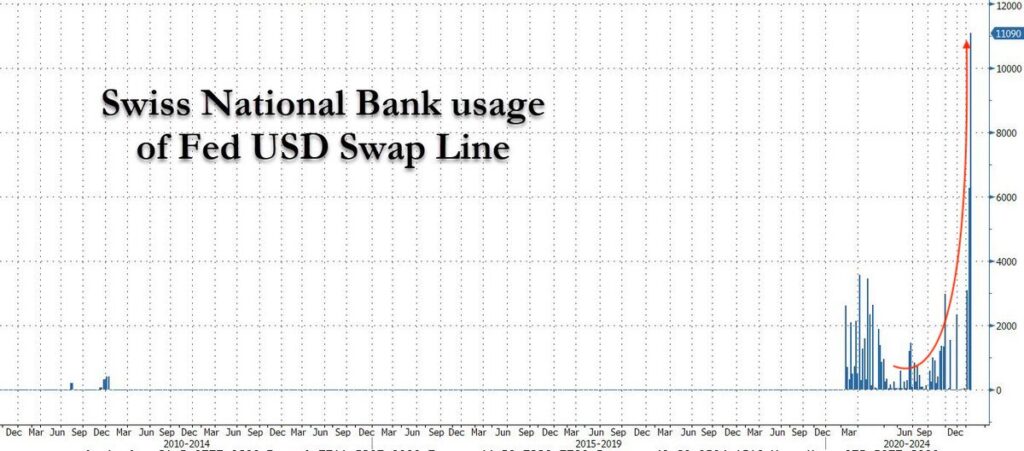
Everything from an individual’s credit cards, auto loan and mortgage to the capital/debt structures of corporations and sovereign countries … up to INCLUDING THE BALANCE SHEET OF A CENTRAL BANK LIKE THAT OF THE SNB (Swiss National Bank), which had been buying equities like $AAPL (Apple) and other mega-cap tech companies for years NEED TO BE DELEVERAGED!
This couldn’t possibly be why the SNB’s swap line usage with the Fed looks like a moon shot, could it?! (I’m sure it’s nothing (SARCASM)) Credit @ZeroHedge for below Image
As collateral values in all asset classes are collapsing, those who have borrowed/leveraged themselves off these assets will be forced to deleverage (REDUCE LEVERAGE). This holds true for those who took margin loans off Chinese ADR’s (which were down nearly 25% overnight earlier this week), hedge funds that are still levered long to global equity markets down 23-33% on the year (they will need to further reduce gross exposure to equites in this current trending bear market).
It will also largely affect Real Estate companies who will have to refinance their debt at significantly higher rates but don’t have the pricing power to increase rents; along with real estate investors who have layered into mountains of vacation rental units, squeezing every penny of equity out of them at the peak of the largest real estate market bubble in history (in an effort to list them on AirBnB, just as people run out of money and can no longer afford that lavish vacation).
Wouldn’t want to be the bank that holds those loans/notes with collateral now down 30-40% as the above exercise illustrated. (GASP)
Dare we mention the corporations, now in a clearly visible earnings recession who has to refinance all that debt they took on in order to buy back stock at “valuations” MUCH HIGHER. Ladies and gentlemen, we’ll tackle this one next month, but mass layoffs are coming, they’re inevitable.
In these notes we attempt to provide you with clear, real-world examples of the dynamics currently in play, making it easier for those not engulfed in the world of global macroeconomics to understand what’s happening and why it’s so important to understand!
Especially, since the entire globe is under pressure from the same dynamic!
For years we’ve attempted to warn people of this unwind; sadly, it’s largely fallen on deaf ears. As pension, hedge fund, mutual fund and bond ETF managers were literally buying bonds hand over fist with negative yields, they attempted to justify to investors why a worthless, negative yielding piece of garbage was a good idea?!
Seriously … just because they manage billions or are considered “high profile” it doesn’t mean they are intelligent or know how to manage risk; be mindful of Aesop’s ASS … in many cases we’re dealing with:
Straight up idiocy
The more global central banks attempts to squash inflation by raising interest rates into this global deceleration in both growth and inflation, the more damage their blunt tools will do … and that destruction is collapsing on everyone’s shoulders like a ton of bricks; all the while, Aesop’s “ASS” in Treasury Secretary Yellen continues to address our current situation by saying things like this: all on the same day (10/24/22):
- I don’t see a problem in the U.S Treasury Market right now
- the U.S. economy is healthy, financial system is resilient, credit quality is good
- The20-year bond is less liquid. No decisions have been made on it. It is conceivable something could be done with buybacks
- We could face financial stability risks
Only to be followed by my favorite
- Cannot rule out risk of a recession
Yellen’s message is about as clear as mud! Are things healthy, resilient with good credit quality or are we facing financial stability risk with illiquid bond markets as head into a recession?! Can you say, “mixed messages”?! Anyone?!
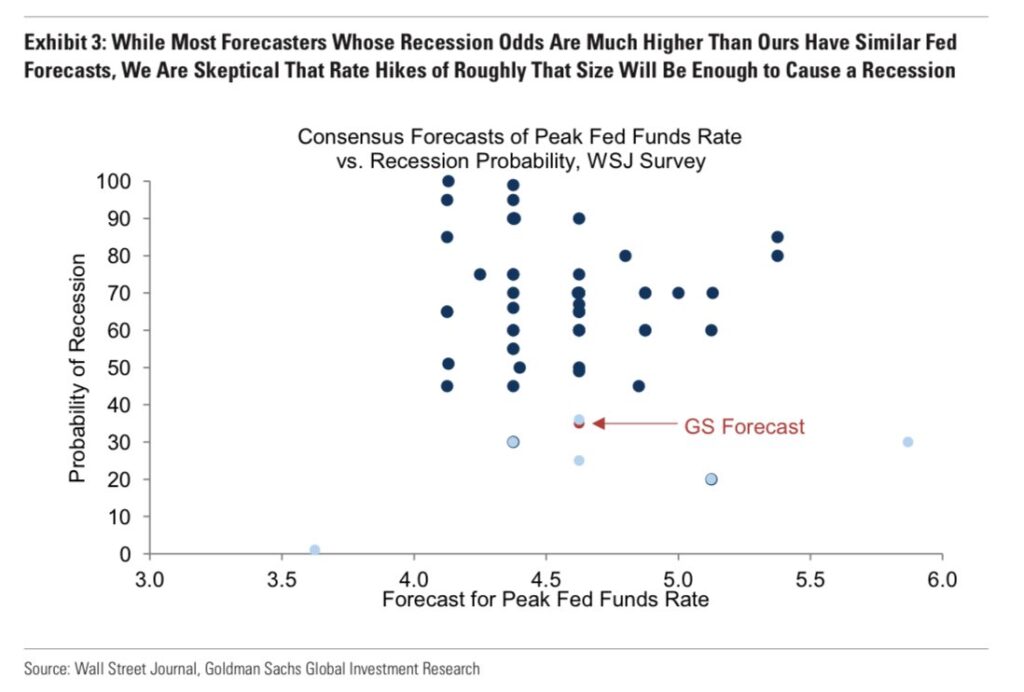
But she’s NOT ALONE, Goldman Sachs recently stated:
“The US economy does not appear to be on the brink of recession … Our recession odds of 35% over the next 12 months … are well below the 63% consensus odds … We are skeptical that rate hikes … will be enough to cause a recession.” Hatzius
Paint me skeptical, but I’m old enough in this business to remember Lloyd Blankfein of Goldman Sachs being grilled by Congressional and Senate committees for advising clients to do one thing as they, as a firm positioned for a different outcome internally during the GFC.
Relatively speaking, the fines were paltry of course, but they eventually admitted publicly to defrauding investors, paying over $5 billion for their “role” in the GFC … so forgive me if we don’t really care or place any credence into what they’re currently saying as we head into a crisis … we remain mindful of the old saying, a tiger cannot change its stripes! We’re of the opinion they’ll protect themselves and worry about the slap on the wrist later, only time will tell.
Odds and Ends
We could walk you through pages upon pages of current data, though, as is this note is getting a little long in the tooth, we’ll be mindful and keep it muted:
We’ve yet to touch on Manufacturing, CPI/“inflation” (both here at home and Globally) as well as the “labor market. We’ll try to sum things up quickly; with Headline CPI and labor being two of the “Federal Reserves” mandates, we would be remiss in failing to mention these points of interest.
First, Manufacturing … it’s an abhorrent disaster:
- U.S. September ISM Manufacturing fell to 50.9, lowest level since May 2020
- New orders were crushed, coming in at 47.1, down -4.2 points MoM
- October U.S. Flash Markit PMIs came in at contractionary levels
- Manufacturing PMI fell -2.1 points MoM to 49.9, with new orders also in contractionary territory down the most since May 2020; services PMI also fell -2.7 points MoM to 46.6
- Empire State Manufacturing cratered in October registering -9.1, from -1.5 last month
- the U.S. Philly Fed Index also came in at -8.7 for October
I could go on, but I think you get the point…
As for October’s CPI, it “surprised” Wall Street to the upside. Headline CPI came in at +8.2% YoY, +0.4 MoM with Core registering a 40-year high of 6.63%. We’ve suggested a “hot” reading to be the most likely outcome with “Shelter” being the primary driving force.
Shelter’s 12–15-month lag as it flows through into the data should continue to act as a headwind for another 9 months or so; the Food component isn’t likely to lighten up much any time soon either.
While we’re talking bad news for those praying for a Fed “pivot”, next month’s reading is also likely to include some unwanted strength from the oil component, as crude oil accelerated off its lows last month. Oil, as we’ve conveyed in the past, has a lead/lag flow through into CPI that is either concurrent or on a 1-month lag.
Two quick important notes on labor: 1. As we continue to say, it’s the latest of late cycle indicators, patience, it’s coming (unfortunately). 2. When management gets fired, they often receive severance “packages”, which means no unemployment is filed until the “package” is exhausted; keep this in mind as we head into 1Q2023.
With the two largest components in the CPI calculation showing strength, next month’s reading is likely to give the Fed near ZERO cover to alter their current stance. At the same time, the labor market has yet to meaningfully crack … we expect the Fed’s rate hikes to continue as planned, at the same time, we reiterate the damage is already done, cycles just take time to play out.
In regard to whether or not this recession is or will be GLOBAL, there is no debate. Nearly all data points are more negative than the next; from inflation, which is adversely affecting the consumer sentiment due to the pain in the pocketbook. This, in turn, flows through to manufacturing, as it, too continues to get worse.
CPI in Denmark, Norway, Greek, Sweden, Portugal, Germany, U.K., and Austria (among others) have all accelerated to nosebleed levels, in some cases reaching 40-year highs. Consumer confidence across the region has fallen to either all-time lows, or damn near close to them; so it, too should be of no surprise:
October data for Eurozone Manufacturing PMI, Eurozone Services PMI, U.K. Services PMI and U.K. Manufacturing PMI all slowed; EZ Manufacturing PMI decelerated to 46.6 from 48.4, EZ Services PMI fell to 48.2 from 48.8, U.K services landed at 47.5, and U.K. Manufacturing PMI settled in at 45.8 respectively…
Anyone care to share with us what the “bullish” case for equities other than “Fed Pivot” which none of the central banks have the ability to do without sending Inflation higher than the current nosebleed levels around the GLOBE?! Stop hoping, START FOLLOWING THE DATA!
Final Thoughts
Our hope is the data is speaking much more loudly to you than any Ass trying to tell you a different story … the current market deleveraging phase we are experiencing is in its infancy. We’ve noted in prior notes, per @Hedgeye NowCast models, we’ve just exited the FIRST of FOUR consecutive disinflationary investing environments.
While no one knows for sure how bad this will ultimately get, we do know with certainty that the signs of our current disinflationary investing environment have been around for nearly a year; we’ve been writing about them monthly, with accuracy.
For “experts” like our U.S. Treasury Secretary, our Federal Reserve board members, most all of Wall Street and the talking head pundits in the financial media (we refer to as Rodeo Clowns) to have missed such glaring warnings, it should tell you everything you need to know about how broken the system is, how under-educated the masses in this business are and finally, how mis-aligned incentives drive willful ignorance.
If Aesop’s Asses at the Treasury and Fed needed more data to consider in regard to where ‘signs of trouble’ might have been over the past 6 months, we’d engrave that final nail we’ll place in their coffin with the inscription, Credit/CDS markets.
While high-yield spreads continue to be an important marker in spotting stress in credit markets, they are still influenced by the passive investing dynamic … which means so long as it trades and has a ‘suitable rating’, some investment vehicles MUST buy them by prospectus mandate. So, again, they’re a good indicator, but not perfect.
CDS or (Credit Default Swaps), on the other hand, often paint a much cleaner picture.
A credit default swap (CDS) is “a contract between two parties in which one party purchases protection from another party against losses from the default of a borrower for a defined period of time.”
Ultimately, CDS is a form of reinsurance against default, both on corporate debt, as well as the debt on sovereign countries! In the spirit of slowly, slowly, then all at once, CDS spreads had been inching incrementally higher in tandem with high yield credit, the MOVE index, etc.
Recently though, they’ve exploded to the upside, and not just on the “usual suspects” like $CS (Credit Suisse) and $DB (Deutsche Bank), the hockey stick move higher has occurred in numerous corners of the market from financials to homebuilders and worse … SOVERIGN COUNTRIES.
The MoM (Month over Month) moves in CDS for many countries are startling. Earlier this month, we saw a MoM acceleration of 17% in Greece CDS moving from 169 to 198 (and that was a smaller move).
India’s CDS increase saw a +47% MoM, Indonesia was +62% MoM, Malaysia up +62.5%, Mexico up +39%, Peru up +59%, South Africa up +44% … all on a Month over Month basis … these are FLASHING RED LIGHTS!
It’s important to note that a CDS doesn’t eliminate credit risk, it’s merely SHIFTED to the seller of the CDS, which means there is a lot of risk out there and not enough premium being collected to cover the volumes of losses that lie before us; in our humble opinion.
I can’t think of any economic data points currently being released that would lead anyone with a shred of investing intelligence to:
“continue to think that markets are functioning pretty well” U.S Treasury Secretary Janet Yellen
As our illustrious Treasury Secretary recently stated.
Nothing we have outlined in these pages suggest anything other than the EXACT OPPOSITE, regardless of what a bunch of “Asses” are telling you.
Much like Aesop, we have attempted to guide readers towards the safety of the “stall at the foot of the mountain”, as the Rodeo Clowns and Asses, who have proven to be consistently wrong for decades, guide you off the cliff.
Aesop did this by aggregating and sharing stories with morals so obvious a child could understand them. Similarly, we aggregate, disseminate, and provide you with DATA, allowing it to tell the primary story, while we attempting to teach/guide you as to how one might interpret the data as the market most probabilistically does.
Risk managing and navigating this complex, yet fragile system is not easy; this is not your grandfather’s market anymore. At the same time, it’s our humble opinion that preserving what you’ve worked and saved over the course of your entire life is worth the effort.
Janet Yellen may be the Secretary of the U.S. Treasury, but the only thing she’s got a perfect track record with is her ability to faceplant down the mountainside just like Aesop’s Donkey; UNABLE to see/forecast any danger ahead for U.S. financial markets of any kind … EVER!
She’s openly admitted she, nor any of her ilk saw the GFC coming (this, while head of the San Francisco Federal reserve).
- “We really didn’t see that (the financial crisis) coming”
- “Would I say there will never, ever be another financial crisis? … Probably that would be going too far. But I do think we’re much safer, and I hope that it will not be in our lifetimes, and I don’t believe it will be”.
NONE OF THE ‘EXPERTS’ DID, and yet … the cast of characters at the “top” of the economic world remain the same; it’s shameful.
A final “ask”
The majority of American’s have witnessed an evaporation of roughly $250,000 to $300,000 from every $1,000,000 they had in savings (EXCLUDING REAL ESTATE HOLDINGS) and the data is screaming this is only the beginning.
We’re a small firm with a de minimis marketing budget, and yet we’ve written volumes since last September documenting the current investing environment, again, accurately.
Our “Final Thoughts” last month detailed the early lead up warning we provided readers from September 2021 until our positioning pivot in early January 2022, feel free to click here if you’d like to read the receipts…
Our “ASK”:
We were recent guests on The Stansberry Investor Hour, which you can listen to by clicking HERE …please consider sharing the Podcast link, our work OR BOTH in an effort to help us lengthen our reach to others.
Our goal in opening OSAM was to provide true risk management to investors, especially in turbulent times. Today, we know the majority of investors are getting crushed and they’re being sold the narrative that “everyone is” … our clients know this is NOT the case for everyone.
Remember, we’ve only seen the first of FOUR @Hedgeye #Quad4 disinflationary investing regimes. Buckle up and hunker down, things are about to get spicier than they already are.
As is always the case, we’re happy to discuss our market thoughts, positioning, strategies and more … never hesitate to reach out with any questions or concerns.
Thank you for your continued trust and support!
Good Investing,

Mitchel C. Krause
Managing Principal & CCO
Please click here for all disclosures.

