

In This Article

Higher for longer
“We’ve got nine months of 2-1/2 percent inflation now and we’ve had two months of kind of bumpy inflation. We were saying that well, it’s going to be a bumpy ride.” Federal Reserve Chairman Jay Powell 3/20/24
We’re going to keep this note as short and tight as possible … as the lies/mistruths are simply embarrassing at this point. If it hasn’t been clear to you that your unelected officials could care less about the majority of Americans by now, you’re just not paying attention.
The above quote came from our illustrious Federal Reserve Chairman, Jay Powell roughly a week ago at the most recent FOMC (Federal reserve’s Open Market Committee) press conference where he & the committee decided to leave 3 possible rate cuts on the table.
Sadly, at this stage of the game we’ve got to caveat just about everything we say, but without a severe fudging/revision of the data (as revisions have become the new normal), we would liken/parallel the current “rate cut” narrative to markets placing the odds of a March rate cut at 97% as 2023 ended; especially given the Fed’s 2% target rate, trending inflation data and the comp set up throughout the rest of the year!
Headline CPI has had a single YoY acceleration below 3% once in the last 24 months, when it bottomed June of 2023 coming in at +2.97% YoY. It has been ‘hotter’ ever since … which is why we’ve been screaming “HIGHER FOR LONGER”!
March’s most recent report had February’s CPI coming in stickier than anticipated, accelerating by 10-basis points MoM with headline data reading +3.2% YoY. Core decelerated slightly MoM from +3.9% to +3.8% though, it also came in 10-basis points higher than expectations of +3.7%.
The Fed’s beloved CPI Core Services less shelter accelerated to a SIX-MONTH HIGH of +4.5%!
Bumpy, huh Chair Powell?!
“… the inflation data came in a little higher than expected… but we think that will keep coming down” Jay Powell, FOMC press conference 3/20/24
Powell opened his press conference as he typically has stating that he and his colleagues remain, “squarely focused on their dual mandate to promote maximum employment and stable prices for the American people”!
It’s easy to spew garbage without presenting any data, as the media lobs softball questions for Powell to ‘address’; never holding his feet to the fire … while it’s much harder to be completely transparent, clearly explaining the data, which, as we’ve said before, proves he’s either completely full of sh*t or outright lying!
It takes work, often times you feel as if you’re swimming upstream fighting a narrative driven world!
Yet, the empirical data is what it is … longer term readers have heard us previously state, “the data is the data”, and unlike Powell, we’ve been providing it to readers on a RoC (Rate of Change) basis for years!
We find it unsettling when unelected bureaucrats fail to be held accountable for the destruction they are doing to our economy, and the millions of hard-working Americans adversely affected by their selfish deceit every day. Even more so for our future generations who will ultimately be saddled with the fiscal irresponsibility of these borderline criminals.
Inflation has receded from exorbitant levels coming out of Covid for many reasons, as we detailed the “when” to readers in beginning September of 2021… recognizing it is what helped us avoid the massive downdraft of 2022. This is not the note to discuss them, though one primary reason was been due to increased rates contracting money supply and constricting the extension of credit … a theme in which we’ve discussed at great length over the past few years.
Though, just as we started calling Powell out in September of 2023 for his unsubstantiated claims (**cough** … lies) when he claimed the move in interest rates late last year was not due to inflation expectations moving higher (again, we provided the receipts (data)) … currently he’d like you to believe that even though:
“the inflation data came in a little higher than expected” (his words) … he think(s) that will keep coming down” (see above quote).
Think about that statement for just a minute … in order for inflation to “keep coming down”, it would have to be coming down to begin with, no?! and yet, it’s been accelerating or sticky at a higher level since LAST JUNE, the simple concept that markets flow in RoC cycles; peaking and troughing, seems to escape him?!
Think about this … the inputs weighing on the most recent CPI data were ENERGY COMMODITIES -4.2%, Utility gas services -8.8% and fuel oil -5.4%.
While the inputs that most influenced the data from a positive were transportation services at +9.9% YoY basis, food away from home at +4.5% YoY, and shelter at +5.7% YoY!
We’ve made all efforts to explain the impacts of lead/lags into the data for multiple years now … and if you’ve taken anything away from our attempts, we’d HOPE it would be that the two largest contributors to the CPI data would be SHELTER and ENERGY … which flow through on different lead/lag cycles.
Let’s hold the thought on shelter for a brief moment as we discuss Energy/Oil for, while shelter is the larger component of the two, energy is the largest input which is most impactful into the data set with the shortest lead/lag; be it oil/gas/fuel/diesel, etc.… it typical flows through into the CPI data is either “concurrent or on a 1-month lag” as we’ve noted as far back as October 2022 … while shelter rests at an 18 month lead/lag.
In January we noted that oil had accelerated by 10% MoM:
OIL RECENTLY ACCELERATED BY OVER 10% MOM on news of this current administrations next war! Ok – simple math … with oil being roughly 7% of the CPI data, a 10% move would contribute nearly 70 basis points of acceleration (yes, we know it’s a more complex, but it gets the point across).
January’s data reflects the levels from either November or December (possibly a combination of the two predicated on timing), while February reflects January/December … and so it goes.
Light Crude Oil futures are up roughly 21% since troughing at $67.71 on December 13th; while currently trading north of $81. Meaning … so long as those calculating the inputs are being honest, it would be very difficult for energy to not be a positive contributor to the CPI data moving forward… and while there may be some minor lingering pressures to the shelter component of the data (given lead/lags and base effects), we’ve noted other components within the data set to be re-accelerating at an uncomfortable pace!
For example, dry bulk shipping has increased north of 150% since November as shipping through the Red Sea has closed due to the escalating tensions/war in Israel, Gaza among other things, which most likely won’t flow through into the data for roughly 6 to 8 months given its typical lead/lag.
Soft commodities such as Cocoa is up roughly 130% since early January … and while I’m sure my friend and colleague Christopher Moir will be proven correct when he recently stated (with his dry wit and UK charm) that “we’ll still be able to buy a Mars bar in a year” as other unsubstantiates panics never came to fruition … the broader CRB commodity index is up nearly 11% over the past few months as a whole.
Recently, Hedgeye macro analyst Christian Drake wrote the following in regard to “Comps”:
“March-June represent part of the steepest decel in base effects which, at a baseline level, will work against further disinflationary progress.”
So, “higher for longer” is something we’ve not only been saying for quite some time but it’s also the camp we will likely remain in for the foreseeable future … the data and markets are showing a re-acceleration in inflation into the back half of the year, which is likely to accelerate at a faster pace given the longer-term base effects and comps as most recently discussed last month.
Which means what?
Those who follow our work know we follow the Hedgeye quad framework very closely; accelerating inflation places us into one of two investment regimes or “Quads” in Hedgeye vernacular; “Quad 3” (stagflation) or “Quad 2” (reflation).
The determining factor would be determined by the growth side of the model … and as we mentioned last month, with the government deficit spending like drunken sailors in the section titled … ‘Bending gravity’; manipulated or not … deficit spending or not … a RoC acceleration of the data if even incremental, i.e., a ‘less bad scenario’ still back-tests to having a positive impact on equity markets.
So, a RoC (Rate of Change) acceleration in BOTH growth AND inflation, from an investing regime, should place us in a ‘quad 2’ (reflation) scenario.
“Comps”, as noted above during our discussion on inflation, aren’t isolated to that side of the equation … they apply to the growth side of the models as well. Whether you’re comparing something as simple as retail or restaurant traffic or the internals of manufacturing or industrial production data (which had been decelerating for more than a year), recent trends in data have shifted to mildly positive.
And given the depth of deceleration in the data over the past 16 plus months, it should make the year over year comps much easier to comp (or beat) … so, similarly to the inflation dynamic we discussed above, there is likely to be a tailwind for both the growth and inflation side of the equation moving forward?!
So, when we look at the ISM data … on the surface, it was, well … meh?!
With both new orders and headline data down -3.3 points to 49.2 and -1.3 to 47.8, respectively, while backlogs and export orders were up +1.6 to 46.3 and +6.4 to 51.6, respectively…
At the same time, both new orders and headline data are positive on a YoY basis … with new orders seeing its strongest data in 18 months and the breadth of industries reporting growth jumping from 2 in November 2023 (a cycle low) to now 11 industries seeing positive growth as of this most recent report.
Industrial production numbers also saw a MoM acceleration in February, it was de minimis, but still, it was an acceleration of +0.1% MoM with headline data nudging higher by +8bps to -0.23% YoY, as auto production increased by +280bps to 4.80% YoY; and both Manufacturing ex-Autos and manufacturing production accelerated +40bps to -0.9% YoY and +30bps to -0.7% YoY, respectively!
So again, while the data is NOT earth shattering, the incremental and trending ‘less bad’ scenario heading into easing base effects continues to point to incremental growth moving forward, especially when considering the copious amounts of deficit spending.
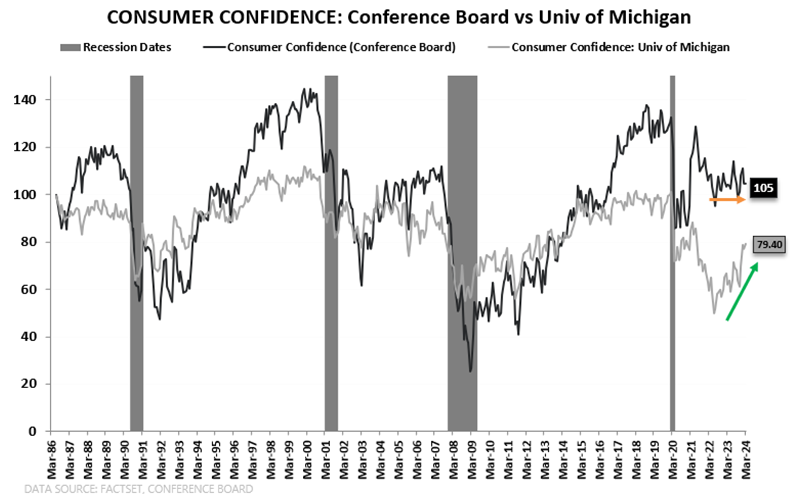
Moreover, something else that benefits from copious amounts of deficit spending is consumer confidence, which, after a +2.5-point MoM final revision, just saw the University of Michigan consumer confidence survey hit a 33-month high of 79.4! Image per @Hedgeye @KeithMcCullough 3/29/2024
At the same time, we’re seeing incremental positives throughout financial markets. For example, Global trade volumes bottomed alongside Global industrial production growth in August/September 2023, though both have seen sequential RoC accelerations since!
We’ve also seen a similar dynamic out of both South Korean and Taiwan exports (they’re exporting/shipping products somewhere?!!) And here at home, both U.S. rail freight and trucking demand saw a positive shift nearly 6-8 months ago…
So, again … while both U.S. manufacturing and industrial production appear to be in a bottoming process and we’ve yet to see a massive ramp/acceleration in the data, the trend is moving in a positive direction with easing ‘comp’ tailwinds ahead.
There’s another positive shift taking place on the growth side of the equation, which directly ties back to our Ouroboros thesis we’ve maintained for some time now, this being something that we’ve caveated since quoting Josh Steiner in April of 2023:
“Bank lending conditions are causal and reflexive, and they feed forward on themselves … so as they tighten conditions, economic activity slows … slowing economic activity drives non-performing rates (both consumer and commercial) higher … that causes banks to further tighten and contract activity and so on and so forth… UNTIL … you get the circuit breaker, which is the Central Bank, doing a full 180”. Josh Steiner, The Call; 4/6/2023
While the central bank hasn’t done the 180°, government deficit spending to the tune of multiple trillions in non-war time/non-emergency, along with temporarily cancelling billions in student loan debt, has acted as a circuit breaker we would have anticipated from the Fed. This has fostered the re-inflation in both asset and commodity prices in an inelastic market driven by passive flows. This has helped loosen bank credit and in turn, the extension of credit … which continues to act as a tailwind for asset prices.
There are many more components to the growth side of the equation that are showing some signs of life, and admittedly, some of these victories are small, though incrementally less bad on a RoC (Rate of Change) basis is, in-fact good.
Before moving on we’re going to take a moment to touch on something which has the potential to shift models back and forth in a blink, and that’s:
Labor
For labor, in our opinion, is a massive wildcard?! It’s highly ranked in Hedgeye’s GDP nowcast as things currently stand, and on the surface … headline labor data remains strong. Though, at the same time, things look bleak under the hood; and given its size/weighting, this component has the capacity to shift modeling quickly.
Headline NFP (Non-Farm Payrolls) came in at +275K, with the government continuing to add to their payrolls, which increased by another +52k jobs which is just shy of 19% of total job adds … government jobs and pay has ties to inflationary pressures over the decades, but we’ll hold that story for another time, though I digress…
So, all’s good in labor market hood, right?! everything’s fine?!
Not so fast … It ain’t all roses!
We’ve been highlighting the outright manipulation in the BLS’s data via revisions for months now … in November 2023 for example:
Government jobs now accounting for roughly 14% of total jobs … we don’t see this ending well, either.
Additionally, following last month’s upward revisions to the payroll data (thatwe called complete B.S. on); this month, negative revisions came back for a curtain call, returning to the data to now make it 9 (NINE) consecutive months of negative revisions with August being revised lower by -62K from +227K to +165K, and September revised down -39K from +336K to +297K! You couldn’t make this stuff up in you tried, folks…
More recently, in our February 2024 note in the section titled ‘Labor & government’:
“Public sector jobs as a percentage of payroll gains was north of 23% last year, but more interesting … as the government spending slowed down in the back half of the year, the government jobs quietly became 31% of all new jobs added.”
We continued:
We’ve been a broken record; labor is the latest of late cycle indicators … highlighting the massive distortions, revisions, and revisions of revisions in the data has become a full-time job.
So, what did this month’s labor report have in store for us?! Among other things, negative revisions found their way back into the data set, with last month’s 353K ‘beat’, being negatively revised by -125K jobs, to +229K … meh, what’s a meager THIRTY FIVE PERCENT NEGATIVE REVISION amongst friends?! It’s just the largest MoM negative revision in roughly 2 years … (I’m betting no one got fired)?!
It also brought another massive disconnect between the Household survey and NFP data with the Household survey being reported down -184K jobs; making it the 3rd consecutive month of job loss, totaling a negative -898K over this time frame … this divergence between NFP and the Household survey, has opened up to nearly 3.7-million jobs! uh, Houston … we have a massive problem?!
If only financial media outlets, the Federal Reserve Chairman, 785 PhD economists who work at the Fed or any major Wall Street firm would address it as opposed to cheerleading … “yay labor”!
Additionally, we’re also seeing quite a few disturbing and unsustainable trends in the data which tie into other items we’ve been highlighting. First, IN ADDITION TO the massive negative revisions (which appear to have become today’s new normal), NFP headline data’s continued ‘beating’ of expectations, have come on the heels of an explosion in the hiring of part-time and multiple job holders vs. a massive loss in full-time employment creating a facade or perception that labor markets are strong, when, in fact they are much weaker in reality!
Stated differently, we’re trading solid, stable, ‘higher earning’ full-time positions for a weaker, more transient part-time workforce, which most often come with fewer benefits.
It also means individuals are working exponentially harder for what likely amounts to less pay and higher expenses, especially should these individuals need to find health care coverage on their own (which has seen a massive amount of inflation over the past few years with premiums skyrocketing).
If that weren’t enough, per @zerohedge, citing recent BLS data:
1. In the past year, the US has lost 284K full-time jobs, these have been replaced with 921K part-time jobs
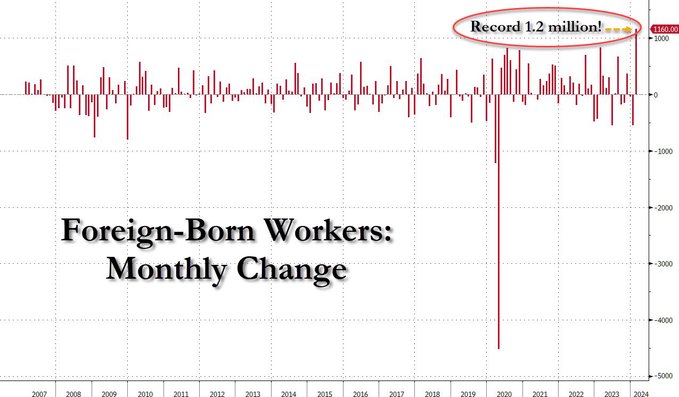
2. In February alone, a record 1.2 million foreign-born jobs were added.
3. In the past three months, a record (ex-covid crash) 2.4 million native-born jobs have been lost, including 494K jobs lost in February.
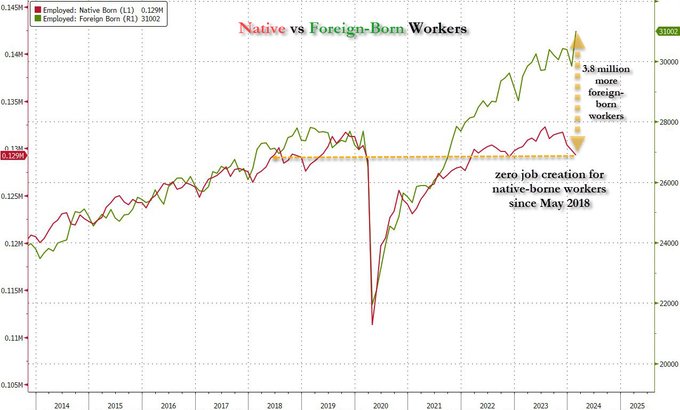
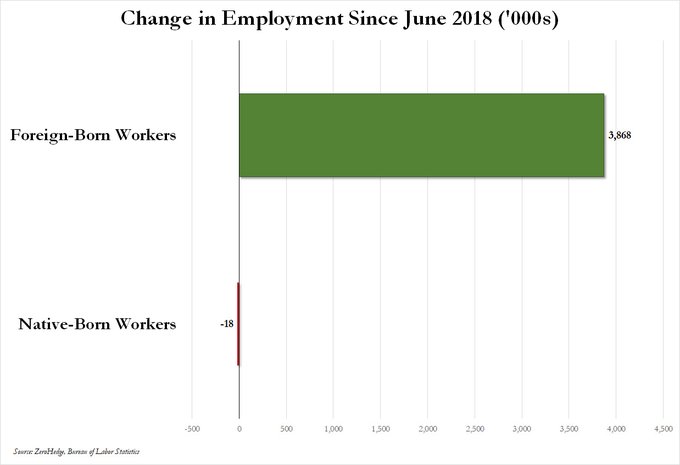
4. Most shocking, since May 2018, there have been ZERO jobs created for native-born Americans. All jobs in the past 6 years have gone to immigrants, legal and illegal.

If you really want to take a massively deep dive into the clown show that has become our government’s reporting on labor data vs. what the actual internal data says, feel free to click here … which makes the term ‘unsettling’ the understatement of the year!
That being said … the data is the data; though as ZeroHedge also notes in the aforementioned article (should you click the above link) … 4 and 3-sigma ‘beats’ in labor data, as we’ve seen the past two months, “used to only happen in the USSR … and now in the US, apparently.”
Some might frown upon us talking about the Fed, BLS and government’s manipulation of the data?! At the same time, as we came to print, the Philadelphia Fed released a paper suggesting jobs were over-reported by roughly 800k last year through December 2023 … even MORE if you extrapolate further into 2024! We encourage you to read the report by clicking on the embedded link.
We’re NOT the ones who are full of sh*t here … we just happen to be one of very few calling out those who are. You can read a more detailed report dissecting the report by clicking here.
Danger remains
‘Unsettling’ misrepresentations of the internal labor data isn’t the only place danger still lies. We’ve referred to small and mid-sized businesses as the heartbeat of our country in the past and have the ability to take their pulse in multiple ways. One way is through the lens of the NFIB data, which remains problematic as small business sales, earnings & optimism remain near cycle lows … with earnings down -1 points to -31; sales down -2 pts to -13 and optimism down -1.5 points to 89.40 (a 10-month low).
Plans to spend, i.e., Capital expenditures (Capex) was down -5pts to 54 with inflation being the “single most important problem” accelerating +3 points to 23 … leaving small businesses in shambles; soft demand, increasing pricing pressures, including wage inflation, and squeezing margins?!
Dear, Mr. Powell … would you care to revisit your “bumpy ride” comments in regard to inflation with the majority of small business owners in this country who are seeing inflationary pressures completely different than you?!
Someone’s either blind, completely out of touch or LYING?! Though, moving on…
“Manufacturing activity fell significantly in New York State in March, with a decline in new orders pointing to softening demand. Labor market conditions remained weak as both employment and hours worked decreased.” ~Richard Deitz, Economic Research Advisor at the New York Fed
Along with the most recent NFIB data, the March 2024 Empire Manufacturing headline remains problematic coming in at a negative -20.9 vs. -2.4 MoM with ‘new orders’ falling to -17.2 vs. -6.3 MoM; as, both the average workweek and number of employees both fell sequentially to negative -10.4 vs. -4.7 and -7.1 vs. -0.2 MoM, respectively.
Needless to say, while many data points are speaking ‘quad 2’, or a ‘reflationary’ investing environment, we do NOT believe for a second that we’re out of the woods!
At the same time, the macro tailwind, courtesy of government manipulation/intervention, coupled with the passive investing dynamic now pushing through 50% of investable market assets continues to create an increasingly inelastic market which can push equities higher much longer than anyone staying short can remain solvent.
Some would say what’s going on is irrational, though understanding the passive investing dynamic provides an extremely rational explanation for what seems to be absurd.
That being said, structural deficiencies can also bring with them massive drawdowns when most unexpected and both short & long-term danger still exist; be it a massive search for liquidity when nearly 24% of all CRE loans restructure this year, or should $BA (Boeing) debt actually be DOWNGRADED TO JUNK and not just put on negative credit watch, (which, Moody’s did just this week for those paying attention)!
A downgrade to junk for Boeing’s debt would very likely create a 2020 $F (Ford) debt scenario, which sent the bond market into turmoil and forced the Federal Reserve to backstop junk paper in order to prevent the bond market and bond ETFs from imploding. (again, it wasn’t CV people, it was a structural collapse due to a $1.1 trillion dollar bond market being unable to absorb the nearly $350 billion of Ford debt that would have otherwise been forced upon it due to the countless investors who held those bonds unable to hold junk paper by prospectus/mandate.
So, to be clear … we’re not out of the woods, though clients have seen us putting more capital to work due to the reflation dynamics given the RoC acceleration in both growth and inflation, though we are MAINTAINING STRICT AND TIGHT RISK MANAGEMENT PARAMETERS ON EVERY HOLDING.
Any of this sounding familiar?!
The sad truth is our government officials on both sides of the isle and unelected bureaucrats have been manufacturing jobs data while burying our children in ungodly sums of debt that they’ll never be able to dig themselves out of.
The U.S. National Debt currently sits at an eye watering $34.6 trillion, adding, on average $1 trillion in new debt every 90 to 110 days … and as Hedgeye’s Josh Steiner recently stated:
“We’re going to be in an environment where we’re in basically a 5-6% deficit annually, growing steadily to 7%, and then to 9% every year.”
Noting that the U.S. Debt to GDP ratio is projected to jump from 97% to 172% over the next few decades as yearly government spending will be sustained at near GFC levels every single year moving forward.
We’ve been discussing the dynamic of increased interest rates on an obnoxious amount of debt since we opened our doors as certain politicians were immaturely arguing about whether or not they could find $5 to $10-billion to fund a border wall in 2018 … we wrote:
“Perspective
As I write, our government has been shut down for over 3 weeks now, quarrelling over a $5-billion-dollar allocation to fund a border wall… I don’t care what your politics are – don’t care if you want a wall or don’t, I think it’s important to put things into perspective…
As mentioned earlier, our national debt is well in excess of $21,000,000,000,000… That’s TRILLION. Every 100-basis point increase on interest rates equates to more than $210,000,000,000 billion in our cost to carry that debt.
- On Dec. 25, 2017, the federal debt was 20,492,874,492,282.58, according to the Treasury.
- According to the latest numbers published by the Treasury, which show where the debt stood on Dec. 20, 2018, the federal debt was $21,863,635,176,724.12.
- The federal government has added another $1,370,760,684,441.54 to the debt since last December 25, according to numbers published by the U.S. Treasury.
Politicians are quarrelling over a $5-billion-dollar wall and not a $1.37-trillion-dollar addition to our national debt over the course of a single year, bearing with it an interest expense of roughly $13,707,607,844.41 with every 100-basis point increase?”
Please, just take a second to consider what the interest payments alone, on $34,615,000,000,000 trillion dollars, will do to our economy, knowing full well that interest rates are roughly 400 to 500 basis points higher, having accumulated more than $12.751 trillion of debt in under 6 years?!
In the past, when we’ve discussed debt, we’ve referred to the work of economist Dr. Lacy Hunt’s often coupled with that of storied philosopher, historian, and economist (among other things), David Hume! To refresh our reader’s memory as well as inform our newer subscribers … in Hunt’s words, as we wrote in May of 2020:
“My professor, Ingrid Rama said that the Enlightenment could not have occurred without David Hume. Adam Smith, who was mentored by Hume, said that he was the greatest intellect of the age. And Smith knew Voltaire. He knew Ben Franklin. And Hume was the greatest.
With this in mind, I would hope we could then, at the very least be able to agree that Hume was a fairly intelligent and well-respected individual, held in high regard amongst fairly good company (historically speaking)?!
In that same May 2020 note we went on to further quote Hunt, and his description of Hume’s work … ‘Of Public Credit’ … we wrote:
In 1752, Hume wrote a paper [called “Of Public Credit”] which I recommend you read. You can get it on the internet easily. It’s only about 20 pages. It’s not in modern English, but it’s very understandable.
And he looks at these cases that were available up until the time of 1752. He looks at Mesopotamia and Rome and a number of lesser cases that have long been forgotten.
And this is what he says. He says when a state has mortgaged all of its future revenues, the state by necessity lapses into tranquility, languor, and impotence. And today, we know that it triggers diminishing returns and an insufficiency of saving to generate physical investment.”
We feel it important to bring Hume back into the conversation today as many of Hume’s views fall in line with that of French economist, Richard Cantillon who published his ideas in the 1755 book Essay on the Nature of Trade in General … the Cantillon effect suggests changes in money supply (i.e., printing) effects the relative prices of goods and services, which leads to a misallocation of scarce resources.
As also recently noted by Hedgeye Financials Sector head Josh Steiner, what Cantillon basically concluded was that:
…when you print a lot of money three things happen and they happen in specific sequence. The first thing that happens is that you get asset prices that go straight up … the second thing that happens on a big lag is that you get broad based inflation (it takes time to for the money to seep out into the into the system; he (Cantillon) said it typically takes about a year) … and the last thing that happens is you get wage inflation at the very end, but the wage inflation isn’t enough to compensate for the broad based price inflation and so that ultimately creates this “K” shaped framework, where in his day the people who were closest to the king in terms of being land owners and able to benefit from the creation of money benefited whereas everybody else the further from the king were harmed.”
Final thoughts
Printing ungodly sums of money during the pandemic … sending asset prices through the roof as the Federal Reserve cried “transitory”, allowing those who held “hard assets” to benefit most while those without means suffered the most?!
It’s akin to us screaming massive inflation was coming as we got long commodities and correlated equities like $FCX (hard assets/copper), just before a massive inflation ramp from 3Q2020 into 4Q2021. By the time the Fed finally came around to the fact they could no longer hide behind their “transitory” inflation narrative, we were already discussing the looming disinflation, which we began to do September 2021 … citing 2Q2022 as the most likely time given the data, though we flipped our positioning and wrote about why in January 2022.
The Cantillon effect suggests the current recovery is much more shaped like a “K” than anything else as we now see the “HAVES”, or those with means and an ability to own hard assets, reaping the benefits of reckless government borrowing & spending, which is pushing GDP, inflation and in turn, asset prices higher … while those forced to borrow or who are already sitting with an abundance of debt on their books currently repricing (or set to do so), falling deeper into a depression.
Just as the Cantillon effect suggests … the money printing or change in money supply (i.e., financial engineering) has without question redistributed purchasing power, providing more to those who already have money in multiple ways … if nothing else … simply by collecting a 5% interest rates in what would be considered a “risk free” treasury?!
It also suggests that through this, it affects the relative price of goods and services, as hard assets inflate, workers demand higher wages in an effort to offset these gains (i.e., wage inflation), and resources are then misallocated and so on down the line…
It is our opinion that this will not end well, and in time, there will be nothing “risk free” about our treasuries as our debt to GDP consistently rises from 97% to 172% over time … but currently, no one in Washington has their big boy or girl pants on; willing to do what’s necessary to stop this debt fueled freight train. We believe it will end in similar fashion to what Hume concluded:
“when a state has mortgaged all of its future revenues, the state by necessity lapses into tranquility, languor, and impotence.”
So, while Powell states that, “we are fully committed to our 2% inflation goal”, given the Fed’s dovish tone in signaling rate cuts at his most recent press conference, the markets (and data) are telling Powell that it knows he doesn’t give two ****’s about hard working American people, let alone the greater than 60% who are living paycheck to paycheck, struggling to put food on their tables as hardship 401k withdrawals continue to rise!
At some point he’s got to make a choice between his rich Wall Steet buddies or the majority of Americans and for the time being, it looks as if he’s already done so?!
Should the FOMC move to cut rates, it will likely do nothing more than re-inflate asset and commodity prices at a faster pace strangling those with limited means; it’s not just going to be a bumpy ride, but a finishing blow to the bottom half of the “K” in a “K” shaped recovery … and quite possibly to the economy (in time).
Should you not be familiar with Neil Howe’s 4th turning … you may want to familiarize yourself with it. We are literally walking a tightrope stretched across the Grand Canyon with the weight of billions of people resting squarely at the mid-point.
Point loads and anchor points will eventually snap. One thing is for sure, I don’t want to get caught in the middle when it does happen! To which we’d offer a few solutions … either don’t play or keep those risk management strategies extremely tight, or possibly a combination of both?!
Good Investing,

Mitchel C. Krause
Managing Principal & CCO

4141 Banks Stone Dr.
Raleigh, NC. 27603
phone: 919-249-9650
toll free: 844-300-7344
mitchel.krause@othersideam.com
Please click here for all disclosures.

