

In This Article


Last month we discussed the importance of understanding the details in the data quoting Twain, “There are three kinds of lies: Lies, Damned Lies, and Statistics” … we noted that it’s not the data that lies, but those who manipulate it.
This month we’re going to piggyback off a few of our more recent notes for as the data continues to deteriorate behind the scenes, the lies are just piling up, becoming more troubling with each passing data point and “expert” speaker taking the podium.
At this point, the Federal Reserve keeps painting themselves ever deeper into the corner and Fed Chair Powell’s Jackson Hole promise of “data dependence”, looks more and more like a punch line.
They’re moving their lips…
As the old joke goes … Q. How can you tell when a lawyer is lying?! A. Their lips are moving!
You can substitute lawyer with politician and the joke still works. Serendipitously, Fed Chairman Jay Powell received his AB in politics from Princeton University in 1975, before earning his law degree from Georgetown University in 1979. He also happened to be editor-in-chief of the Georgetown Law Journal … all this before working his way through the Private Equity ranks on his way to becoming the 16th Chairman of the Federal Reserve; so, by training and trade, he’s more of a wordsmith than economist, though recently he’s failing at both.
We’ve been highly critical of Powell over the years … from his “Powell Pivot” abruptly cutting rates following a sharp selloff in equities December of 2018; cow tailing to his private equity buddies after initially “talking tough” in regard to needing to end cheap money … only to “crossing many red lines” as he once again saved his P/E buddies (and passive markets) in April 2020.
We could go on for quite some time discussing his mountains of lies and calamity of errors over his tenure at the Fed, but we don’t have all day. However, from his “inflation is transitory” to his “assess our progress bases on the totality of the data” from his very recent Jackson Hole speech on August 25th 2023:
“At upcoming meetings, we will assess our progress based on the totality of the data and the evolving outlook and risks … Restoring price stability is essential to achieving both sides of our dual mandate.
We will keep at it until the job is done.”
A lie is a lie.
Now, we understand that suggesting he’s lying is a strong accusation … we’re fully aware of this! At the same time, we know he’s full of **it and lying to the American public about being data dependent; HOW?!
THE DATA!
In late August:
- GDP growth was at 1.0% YoY … today, with the help of the BIG “G” in Government spending, it sits at 2.5%. (Inflationary) Remember: [GDP = C + G + I + (X-M) where C= Consumer spending, G= GOVERNMENT SPENDING, I=Business Investment, and (X-M) is net exports]
- Unemployment, which we discussed ad nauseam last month and will elaborate more on below was at 4.1% and now sits at 3.8%.
- Headline PCE was 3.2% YoY, while Core PCE was 3.9% … today both Headline and Core PCE now sit at 3.3% and 4.2% respectively, which is HIGHER today than when Powell spoke those words and reiterated his data dependence.
Powell specifically focused a good portion of his Jackson Hole speech on core PCE inflation, which per his words, “OMITS the food and energy components” … due to their volatility … which, “can provide a misleading signal of where inflation is headed” (insert eyeroll here).
It was July when we began noting the re-acceleration in oil and how, given its dynamics would flow through to create and elevated CPI print. We literally titled the piece, “What Wall Street is conveniently failing to show you”, and we stated:
As we’ve been reminding readers over the past 2 years … each component to the CPI contributes on a lead/lag basis. In regard to oil:
“The way energy flows through to inflation is that it’s the sequential change in YoY (Year over Year) RoC (Rate of Change) on a 1-month lag, or 1-month lead from energy’s perspective…” Josh Steiner MS 7.13.23 minute 3:38
Which lead to our conclusion (at the time), with “oil up nearly 20% in the last month” it would be “placing upward pressure on future (CPI) reports.”
And a handful of weeks later, which amount to a few short weeks ago in our August piece we wrote:
By the time those who never saw inflation coming to begin with (and were wrong), and then suggested it was transitory (and were wrong) and … by the time they realize what stage of the cycle we’re in, they won’t be able to hide their panic, nor will the BLS be able to mask the carnage in labor markets via their Birth/Death guestimates.
Making matters worse, we haven’t even touched on the re-acceleration in inflation data (w/CPI up +0.2% to 3.2% vs. 3.0% MoM, which is transpiring exactly as we said it would last month(see: OIL, ENERGY, & COMMODITIES).
So, buckle up, things are about to get a whole lot worse!
Today, oil has increased by roughly 38% from June’s $67 price to WTI’s current $92 +/-, up an additional 15% since we highlighted this re-acceleration in inflation dynamic.
More importantly, we know what oil’s price was in August as well as September, so given oil’s one month lead/lag into the CPI’s calculation, when coupled with the 1-year base affects and a good understanding as to the other CPI inputs, it gives us good reason to conclude that we should see more upward pressure on the next two consecutive CPI reports.
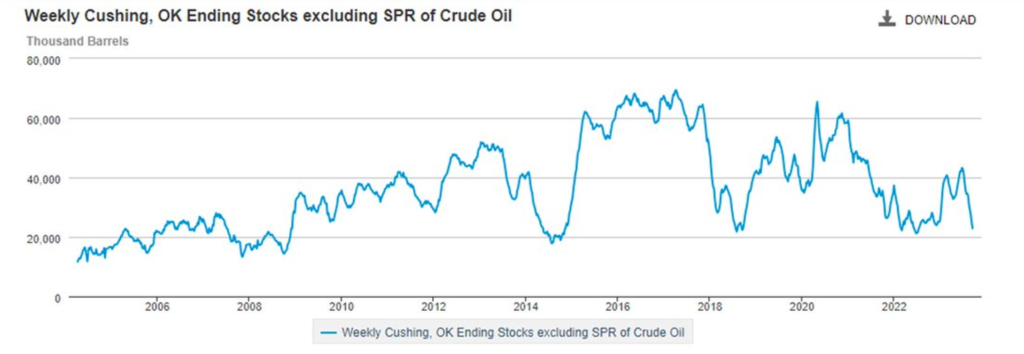
And so long as oil prices continues to lead, inflation expectations are IN FACT, rising … from a fundamental perspective, oil inventories are at dangerously low levels. It was recently reported that weekly stock at the Cushing Oklahoma hub is sitting near a 14 month LOW … which is a touch above a 10-year low and Cushing is one of the world’s largest oil hubs.
If that wasn’t bad enough, per @KobeissiLetter on September, 11th, TOTAL Strategic Petrolium reserves INCLUSIVE of the Federal Government’s SPR has breached below 800 million barrels; these are levels not seen since 1985.
“The U.S. has just 46 days worth of supply in total reserves, an all time low vs. that of 3-years ago we had a record 92 days of supply in inventories … 100% more than current levels.”
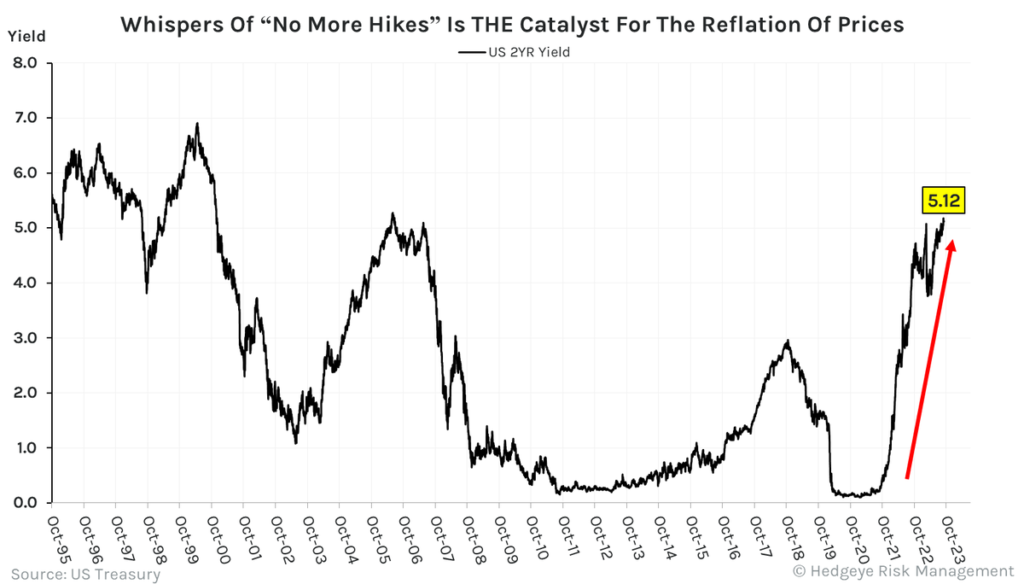
This dynamic is WITHOUT QUESTION, feeding the massive move higher in inflation expectations, which is in turn, creating a tailwind for rates and the U.S. dollar, contrary to what Herr Powell said in his most recent press conference:
“… rates have moved up significantly. I think it’s always hard to say precisely, but most people do a common decomposition of the increase, and the view will be it’s not mostly about inflation expectations. It’s mostly about other things, you know, either term premium or real yields, and it’s hard to be precise about this. Of course, everyone’s got models that will give you a very precise answer, but they give you different answers. But essentially, they’re moving up. It’s not because of inflation.”
Sure, 10-yr Treasury yields have rocketed higher over the course of a few weeks from a 4.05% to 4.61% because of “term premium or real yields” not because of inflation expectations?!
We’ve been attempting to educate readers on this topic for some time now … more so, in recent months as noted above, though with inflation expectations now re-accelerating alongside the rise in commodity prices, so too goes CPI with sequential MoM Headline CPI accelerations as August accelerated by +0.6% MoM and to +3.7% YoY which is GREATER than +3.2% in July.
Now as prices and input costs move higher, how does one say, “margin compression” without actually using the words “margin compression”?! Let’s take a peek at the most recent Philly Fed survey for that one, where new orders came in DOWN -26.2 points with prices paid +4.9 points … (and prices received flat at +0.8 points)!
Don’t like the Philly Fed data, how about August ISM New orders which were DOWN -0.5 with ISM prices paid UP +5.8 MoM, or the 3-month change in August NFIB data showing Actual sales down -6 against compensation plans up +4.
So, pricing power is stifled by the tapped-out consumer, while demand is literally cratering and input/labor costs are RISING in virtually every survey, pretty much summing up “margin compression” in a nutshell!
Additionally … Real PCE/consumption continues to decline, which literally drives the economy … when the consumer is afraid of getting laid off as they run out of money (which we’ve been telling you for months and will discuss in detail below) it leads to deplorable consumer confidence numbers, as shown by the August U.S. Michigan Consumer confidence numbers which all decelerated (EXCEPT WHERE POWELL SPECIFICALLY SAID IT’S NOT; INFLATION EXPECTATIONS):
August Headline Consumer Sentiment slowed to 69.5 vs. 71.6, current conditions slowed to 75.7 vs. 76.6 and expectation slowed to 65.5 vs. 68.3 … while 1-year INFLATION EXPECTATIONS ACCELERATED to +3.5% vs. +3.4% … the DATA is telling you inflation expectations are accelerating as are inflation, while Powell stands up and says … nah, “It’s not because of inflation or … inflation expectations!”
Speaking of confidence, the Conference Board Consumer Confidence Index declined in both August and September with August slowing from a downwardly revised 114 in July to 106.1; with both “present situations” and “expectations” weakening … most recently falling again in September to 103.0, down from an upwardly revised 108.7 in August.
The most recent Present Situation Index did rise, albeit a meager +0.4 to 147.1 from 146.7, though the “expectations index”, which is based on consumers’ short-term outlook for income, business, and labor market conditions, declined AGAIN to 73.7 in September, after falling to 83.3 in August.
All while US real income decelerates … AGAIN!
We constantly remind readers, it’s not us whom you should believe … it’s the data, and the data is screaming LIARS! Which is why understanding what their reaction function is going to be is equally important. The Fed is getting massive pressure to cut rates. There are entire industries which simply cannot survive under these economic conditions which we began talking about last September:
“The fundamental problem here is that you have entire business models and capital structures that have been built up over the past decade that were just based off of zero percent or very low levels of interest rates and now with rates and spreads where they are, and continue to go, the math just doesn’t work.” Andrew Friedman @Hedgeyecomm “The call” 9/27/2022
At the same time, the Fed knows that they can’t cut rates without massively re-igniting inflation … which is exactly what bond yields and oil told Powell with just a breath of pause. Powell didn’t even raise rates, and both yields and oil screamed higher.
It’s why there is currently an all-out marketing blitz with every proclaimed “expert” to calm the American public with their, “everything’s fine, the economy is in good shape … the labor markets are firm” mantra … all while providing virtually NO DATA.
Recently, Janet Yellen was pulled away from bathing in the multi-millions she recently acquired from her Wall Street speaking engagement tour of 2021 to grace the American public with her presence and wisdom in this very recent interview on @CNBC from 9/24/23.
For reminders … this is the woman who openly admitted to NEVER seeing the GFC coming as head of the San Francisco Federal Reserve. She’s the same woman who attempted to provide IndyMac with a loan the very day the OTS was shutting them down heading into the GFC … And the same person who stated on national television that there will never be another financial crisis in her lifetime pre-2020 collapse (all FACTS).
She’s literally addicted to lying for money … the below is a direct quote from last week’s interview:
“we still have a good healthy labor market, consumer spending remains quite robust, we’ve seen strong industrial production … I don’t see any signs that the economy is at risk of a downturn. And this is the best of all worlds … to see continued strength in the economy, a good strong labor markets and inflation moving down and that is what we’re seeing.”
You truly can’t make it up folks! We’ve been detailing the deteriorating data in virtually every area of macro markets for nearly 20 months now … H8 Banking data continues to crumble (most recent data discussed below) … every labor report to date (that’s 7 now), have seen significant downward revisions … last months grossly so (also discussed in great detail below).
And while recent U.S. Industrial Production data did come in SLIGHTLY “better than expected” increasing by +1.0% MoM, it follows two consecutive monthly DECLINES with YoY data remaining negative at -0.2% (for those wondering … NEGATIVE is NOT STRONG)! We’re literally in the middle of an industrial recession with data SUB-ZERO and Yellen cites it as strong?!
The Empire State Manufacturing data for August fell off a cliff … again; down -19.0, vs. +1.1 MoM and has been in free fall for over a year.
What about PMI’s?! Anyone care to take a guess?! Yep, they DECELERATED, too: with both Services PMI and Composite PMI slowing to 6-month lows coming in a 51.0 vs. 52.3 and 50.4 vs. 52.0 MoM, respectively … while the Manufacturing PMI slowed from 49.0 to 47.0, a new 2-month low.
Finally, in regard to robust consumer spending, we have seen a bounce in retail sales, which has also been decelerating since January and remains in a downward trend. This data point is literally just recently back to positive after countless NEGATIVE prints. All of this just happens to coincide with back-to-school spending and increased attempts to gain access to more credit at absurdly high rates! Again, you can’t make it up…
Lobbyists gonna lobby
And still, everyone is out lobbying for themselves. In a recent interview with The Times of India as reported by Bloomberg, Jamie Dimon recently said:
“Going from zero to 2% was almost no increase. Going from zero to 5% caught some people off guard, but no one would have taken 5% out of the realm of possibility,” Dimon said. “I am not sure if the world is prepared for 7%.”
Charlie Jamieson, chief investment officer at Jamieson Coote Bonds, told Bloomberg Television on Tuesday (as we nod our heads in agreement!) … “At that level (7% FFR) we would expect that we would have a deflationary asset unwind, it would burst a lot of asset bubbles, it just simply wouldn’t be sustainable,”
Again, these are outright marketing campaigns … first, going from zero to 2% was in fact a 200% increase, so from a Rate of Change perspective it was massive move, more importantly, it takes TIME to work through a refinancing / restructuring of debts, cycle.
Second, we have repeatedly stated that whether the Fed raises rates, holds firm or cuts, the damage has already been done. Financial markets unequivocally can’t handle rates at these levels, they couldn’t handle 3% let alone 5% or 7% … the Fed has just raised rates so quickly, in the face of firms praying for a cut which is why new bond issuance is anemic … but as we say often, bonds eventually mature, which will force a company to refinance, restructure or shut its doors.
All Dimon is doing is lobbying for lower rates; yet lower rates will throw lighter fluid onto an already burning, very prolonged fire.
There fact of the matter is, there isn’t a single data point that the Fed relies on, from Jackson Hole leading up to this most recent Fed meeting, that hasn’t been higher/more inflationary. Had Powell not been lying, he would have raised rates at this most recent meeting in a continued effort to restore “price stability”. But he didn’t, he took the easy way out (most likely for his P/E buddies), but the markets are calling him out and at the moment he’s losing control.
Similarly, there isn’t a data point out there that supports a word the Treasury Secretary recently uttered on national TV.
We’re at a point in time where unelected bureaucrats sit in front of a camera and literally lie directly to the American public’s faces with zero consequence, as THE DATA proves they are willfully misleading the public (likely as larger investment banks search for exit liquidity ahead of a monster collapse) … which will crush the majority of unexpecting investors educated by these “experts”.
The only other explanation outside of something downright evil is that these individuals are truly ignorant to history; having been trained and subscribe to the same “group think” version of boom/bust economics.
Though as history teaches those willing to learn, there comes a point, as stated by David Hume in “Of Public Credit”, written in 1752:
“When a state has mortgaged all of its future revenues, the state by necessity lapses into tranquility, languor, and impotence.”
To Hume’s point, Dr. Lacy Hunt of Hoisington Asset Management has said:
“And today, we know that it triggers diminishing returns and an insufficiency of saving to generate physical investment.”
We can be smarter and more patient, for the set up here is very dangerous.
Quick aside
I am hard on these individuals; Powell, Yellen, Dimon … its warranted. Their actions and decisions materially impact the lives of all Americans; and while it’s a massive responsibility, it doesn’t make them immune to criticism … it should open them up to more scrutiny and yet, virtually no one holds them to account! Reporters ask them softball questions and not a single one holds them to actual rate of change data. These people have an obligation to be honest, especially when speaking to the data.
Powell and Yellen are literally duty bound to all Americans, NOT wall street; but they don’t act that way; and while Dimon is the CEO of a public company and his allegiance should be aligned with shareholders, his company is literally a quasi-4th arm of the U.S. government, being handed sweetheart deals any time a smaller institution is in trouble, while assuming virtually no downside risk as their backstopped by the government.
As hard as I am on them, I also do my best to be fair and to Dimon’s credit, he did say something very meaningful in that interview we quoted above:
“We urge our clients to be prepared for that kind of stress,” … noting, “a hard landing remains a risk for the US economy.”
At the most recent Fed press conference, Fed Chair Jay Powell stopped reporter Howard Schneider, when he attempted to hold Powell to a soft landing being his “base case” echoing something similar:
SCHNEIDER Q: “So just to boil that down for a second, you know, we’ve gone from a very narrow path to a soft landing to something different. Would you call the soft landing now a baseline expectation?”
CHAIR POWELL: A: “No, no. I would not do that.”
It’s one thing for Dimon to “urge their clients to prepare for that kind of stress” to the Times of India … it’s another thing to understand, how so?!
The question everyone should have for DIMON is HOW?!
HOW is $JPM “urging” their clients to position and with what type of “urgency”?! Or will that just come after they’ve positioned themselves properly as a firm?!
How did he urge them to position in 2022 when very little to nothing worked outside of the US dollar and energy?!
We continue to be underweight equities … out of or short interest rate sensitivity … long oil/energy related companies while clipping 5%+ in treasuries is a decent start (for now)!
Time, space & cycles…
We’d like to consider ourselves students of economic cycles as dictated by the data … while we’ve done this for nearly 3 decades, we will always approach life with an open mind, willing to learn. One of our philosophies is that of Shoshin:
A word used in Zen Buddhism meaning “beginners mind”. It describes an attitude of openness, eagerness and lack of preconception when studying a subject, even when studying at an advanced level.
With this in mind, in our nearly 3 decades in this industry, we’ve found no better aggregator/processor of the global body of economic data from a Rate of Change standpoint than Hedgeye Risk Management.
Coupled with their independent research, and recent partnership with flows/options experts, Tier1Alpha, led by senior advisor Mike Green, one shouldn’t have to look much further for the proper tools needed to be successful over the long-term din this ever-evolving business … evolve or die!
As we’ve stated frequently, price action does NOT dictate where we are in the economic cycle, the DATA does … and while we don’t want to speak for them, we’re fairly confident all of Hedgeye would agree. Additionally, as we’ve also noted in the past, flows can and will impact price action over a shorter to even intermediate term duration (we KNOW Tier1Alpha would agree with this statement) … though it’s history which dictates that it’s the economic cycle that wins out over TIME … just like gravity!
CYCLES TAKE TIME to develop, they can take multiple YEARS. Historically, the financial cycle (as dictated by the data) leads the GDP cycle; as the cost of capital rises, spending slows leading to a deceleration in consumption which, in turn, creates a profit recession that ultimately flows through to the “labor cycle” (LAYOFFS)!
It’s why you continually hear us note that, “labor, is the latest of late cycle indicators” … because “time and space” is needed for each of the other cycles to work themselves through as they cascade and feed off of each other (SEE: OUROBORUS).
History, when coupled with the data allows us to not get shaken out of the boat when navigating bumpy seas … it’s what allowed us to stick with out process and successfully navigate our clients through the worst of storms and rockiest of waters during the February-April crash of 2020 while also warning readers 3 weeks prior to the crash, on January 26th, 2020, in our piece titled, “THE IMPORTANCE OF HISTORY…AND BOY, IS IT “RHYMING” TODAY”!
Again, we’re keenly aware that history doesn’t always repeat itself, … but cycles do have a rhythm to them, a “flow” (similar to that of a sine curve) … sound familiar?!
The “time series” or duration of the economic expansion/contraction can always be influenced by outside forces … for example, trillions in (government) deficit spending can positively impact GDP (temporarily keeping us out of a recession) IN THE SHORT TERM, but inevitably, the Rate of Change in this spending slows while deficit spending no longer produces growth as we noted above via Hume and Hunt.
Last month we discussed the importance of understanding the granularity of the data, for while people and headlines lie, the truth most frequently can be found deep in the data … another example of this would be the most recent (and VERY LARGE) downward revision to the consumption component of 2Q23 GDP as noted by @LizAnnSonders on 9/28/23:
“final adjustment took growth rate from +1.7% (q/q ann.) to +0.8 (weakest since pandemic decline)”
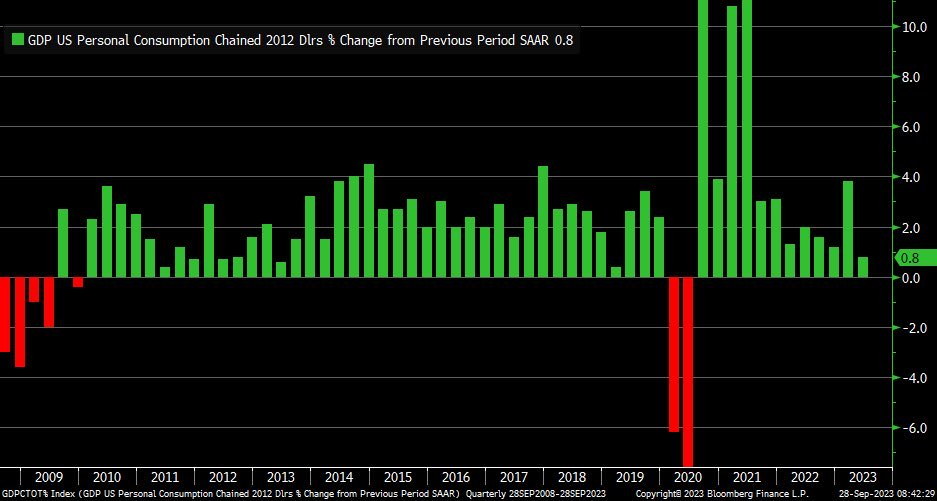
Any takers as to what one of the largest drivers of GDP is … we repeat it in our monthlies frequently! That’s right … CONSUMPTION! (After engulfing ourselves in the data for as long as we have, it’s going to take a lot of convincing to get us to think that the government isn’t doing everything they can to artificially inflate/manipulate both GDP and Labor data) … though, I digress!
Still pondering
Last month we called BS on the BLS, noting that month after month, payroll data released by the BLS had handedly beaten “expectations” only to be revised LOWER … EVERY SINGLE MONTH OF 2023 without fail … we wrote:
“…not only have Non-Farm Payrolls for both May and June been revised LOWER by roughly 25K jobs respectively; per the most recent BLS report:
“The change in total nonfarm payroll employment for May was revised down by 25,000, from +306,000 to +281,000, and the change for June was revised down by 24,000, from +209,000 to +185,000. With these revisions, employment in May and June combined is 49,000 lower than previously reported.”
But EVERY SINGLE PAYROLL REPORT IN 2023 HAS SEEN A DOWNWARD REVISION?!
Sincerely leaving one to ponder: “what’s going on? Is it intentional? Malicious?!”
And while we’d like to report otherwise, unfortunately we’re still pondering this question today as this trend of; headline beats, rolling into negative revisions of previous months data remained intact for the most recent labor report.
With Wall Street median consensus set at 170k, the most recent BLS report did BEAT expectations, coming in at +187k; which on the surface would have been a flat print MoM (YAWN). The problem again, as noted above, the previous months print was revised DOWN, this time by 30k, bringing July’s report down to 157k … but it gets worse!
June’s data was ALSO revised LOWER … for the second time! For what was initially reported as a +209k payroll report and was subsequently revised negatively by -24k to 185k last month (down -11.5%), was just recently met with another negative revision of -80k bringing June’s data down to 105k; representing a 50% DECLINE from the original report (while almost nobody pays attention), which ties the below quote from last month, coupled with this month’s theme even closer together:
“The proverbial “heartbeat of America” is currently on its knees while a bunch a bureaucrats lie with statistics as “better than expected” headlines prompt algorithmic traders to bid equities higher … only to have the data quietly revised lower months later with few paying attention … almost as if someone is attempting to game the system (until it can no longer be gamed)!”
To our recollection, we’ve never seen more than 3 consecutive revisions to NFP’s in the modern era where the labor cycle hasn’t seen a massive reversal … currently, we’re sitting at 7 consecutive negative revisions this year alone.
Last month we also noted another troubling trend, that of “full-time” job loses:
“you’re looking at is a staggering decrease of -585k FULL-TIME JOBS (LOST) vs. an increase in part-time jobs “gained” of +972k, with an additional INCREASE of +118k multiple-job holders MoM (Month over Month), respectively … from June to July 2023 … which should make everyone reading this data extremely uncomfortable”.
Which also continued in the most recent data as we lost another -85k FULL-TIME positions, making it a grand total of roughly 670k full-time jobs lost over the last two months alone … don’t fret though, headline data suggests everything’s rosy as more than 1 million “part-time” job gains will surely pick up the slack in consumption?! (palm meet forehead)
Circling back to deteriorating labor data, we also saw a re-acceleration in job cuts per Challenger, Grey & Christmas data, which showed a spike of 217% MoM and +267% YoY as August data came in at +75K. Per Hedgeye Director of Research Daryl Jones, this data is “the third highest YTD total since 2009.”
Additionally, as can be seen by JOLTS data with the number of job openings available collapsed in July to 8.8mm from 9.2mm in June; this is the lowest reading since March 2021.
All of which ties in directly with what we highlighted in regard to $ZIP recruiter’s quarterly shareholder letter last month:
“The decrease in Quarterly Paid Employers is primarily reflective of weakness among small-and-medium-sized businesses who make up the vast majority of our Paid Employers.
We have seen this softening continue in Q2 and in July. Demand among both SMB and enterprise employers continues to contract as thy reduce the number of jobs they post and the amount they spend for job advertising.”
Most companies with revenue DOWN 29% YoY don’t have the ability to maintain their current employment structure; even $GOOGL with a POD 1 top line acceleration just announced more layoffs of “hundreds” from their “global recruiting team” … and there aren’t many outside of $GOOGL & $META in the tech space with top line accelerations.
Still, as the internals of labor markets continue to weaken, the headline data “appears” to be strong on the surface with last week’s weekly jobless claims coming in at +201K, as Continuing Claims declined to 1.662mm, vs. 1.683mm WoW.
So, given the most recent labor and inflation data it becomes extremely difficult for the Fed to shift from their higher for longer policy stance … which is playing out exactly as we wrote in June:
“Based on the math, we’re more likely to maintain inflationary levels in the high 3’s to low 4’s for the foreseeable future … when coupled with the superficial labor market reports, failing to catch the internal deterioration, this will continue to keep the Federal Reserve in their higher for longer missive.” ~ OSAM June 2023
Credit and the cost of capital
The data surrounding the consumer is abhorrent and it all begins with credit … both the extension and cost of. This is nothing that we haven’t discussed before, however, the most recent Fed H8 data again confirms the continued deceleration as total lending growth saw another deceleration of 40-bps over the most recent 4-week period declining from +4.8% YoY growth in late August to +4.4% YoY as of earlier this week.
For context this data point is down from a growth rate of +10.1% YoY in March just prior to the SVB collapse (which happened with interest rates much LOWER than where they currently are today … what could possibly go wrong)?!
CNI loans came in at +0.1% YoY, down from +0.7% YoY, on the verge of being outright negative. Auto lending continues to fall deeper into negative territory, deteriorating further from -2.1% to -2.3%, while credit card growth, which has recently been touted as a signal of strength for the American consumer, also saw another deceleration … falling from +11.2% YoY growth to +10.8% YoY.
The survey also revealed CRE lending decelerated an additional 60-bps from 7.8% YoY to + 7.2% YoY. These are significant drops over a 4-week time frame!
But it’s not just the H8 data showing a deceleration in credit availability … the most recent NY Fed Household Survey of Consumer Expectations noted, among other things:
“Perceptions of credit access compared to a year ago deteriorated in August, with the share of households reporting it is harder to obtain credit than one year ago hitting a new series high.”
Make no mistake, “perception” deteriorated to a new series high because access to credit is outright collapsing and measurable.
Also, per the NY Fed … over the 12 months ending in June, “21.8% of people who applied for credit were rejected”, the highest level since June of 2018 as, “the rejection rate for auto loans increased to 14.2 percent from 9.1 percent in February, a new series high. It increased for credit cards, credit card limit increase requests, mortgages, and mortgage refinance applications to 21.5 percent, 30.7 percent, 13.2 percent, and 20.8 percent, respectively.”
Access to credit is closed …
And while we’ve discussed many of these things before, many are reaching either all-time or cycle highs; for example, credit card delinquency rates at small banks are at all-time highs while consumer foreclosures and bankruptcies have accelerated to levels not seen since 3Q2010 as we were exiting the 2008/2009 GFC.
This is what happens in an over leveraged society when the cost of capital (interest rates) on ALL DEBT skyrockets.
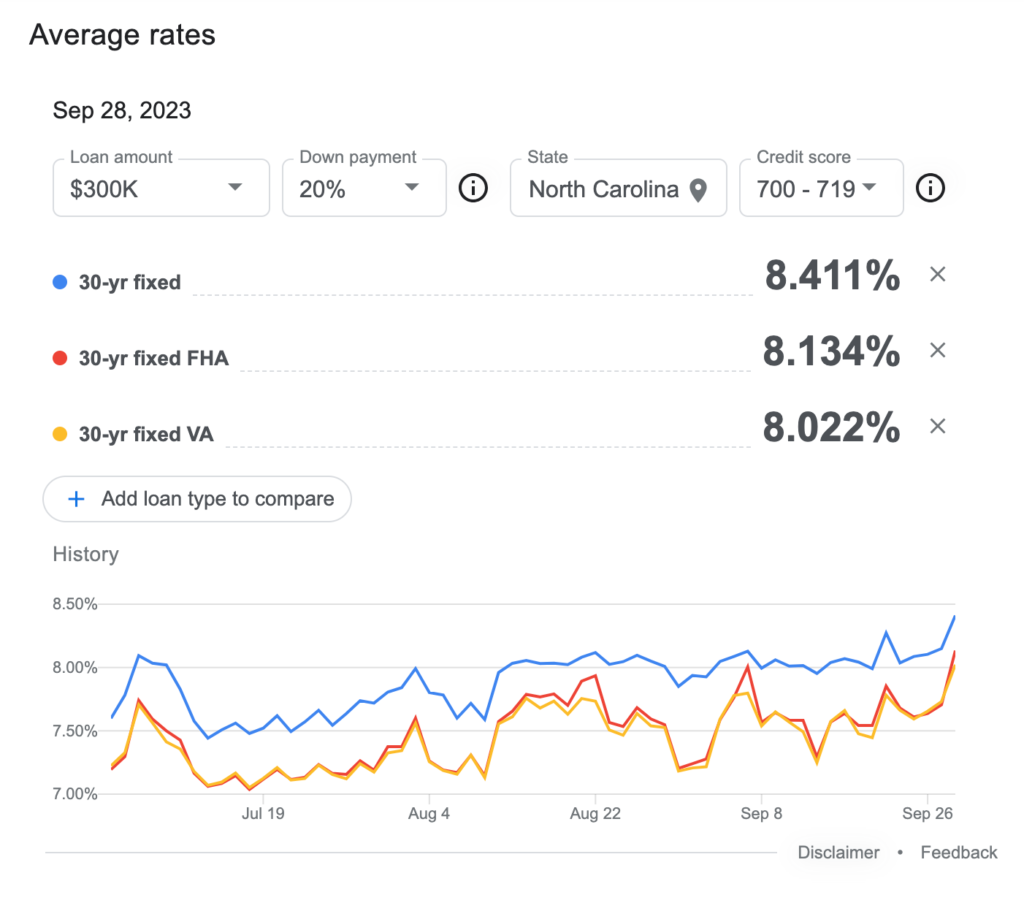
The 30-year mortgage just touched its highest rate in over 24 years registering 7.83% … and as we’ve noted in the past – that’s if you can get that rate – most are coming in closer to an eye popping 8.4%
Which flowed through the August Pending Home Sales Index as it decelerated -7.1% MoM vs. +0.5% MoM in July with all four regions down Month over Month and Year over Year. Home equity loans or cash out refi’s are gone … interest rates don’t discriminate based upon location; they don’t see color, race, religion, or creed … they’re crippling to everyone reliant upon debt!
Unfortunately for the masses, “personal debt” dwarfs interest income on investment, as the average APR for all new credit card in September 2023 is 24.45% with the MINIMUM interest rate being 21.03% vs. a bank account paying 0.58% basis points or T-bill at 5.00% as savings plummets.
Per Hedgeye, “2023 is the first time EVER the percentage of rolling credit card debt is greater than the percent of those paying in full!” … Why?! because as we’ve been discussing for months, the consumer is RUNNING OUT OF MONEY!
The “carry trade” made sense in a ZIRP world, borrowing money at near zero to earn X% more was a profitable endeavor for many years (courtesy of the Fed). Though, with borrowing rates at current levels, the only reason you would use a credit card with a 24% APR and not pay them off in full every month is simply because you’re spending more money than you make, and you simply can’t afford to pay off your loans!
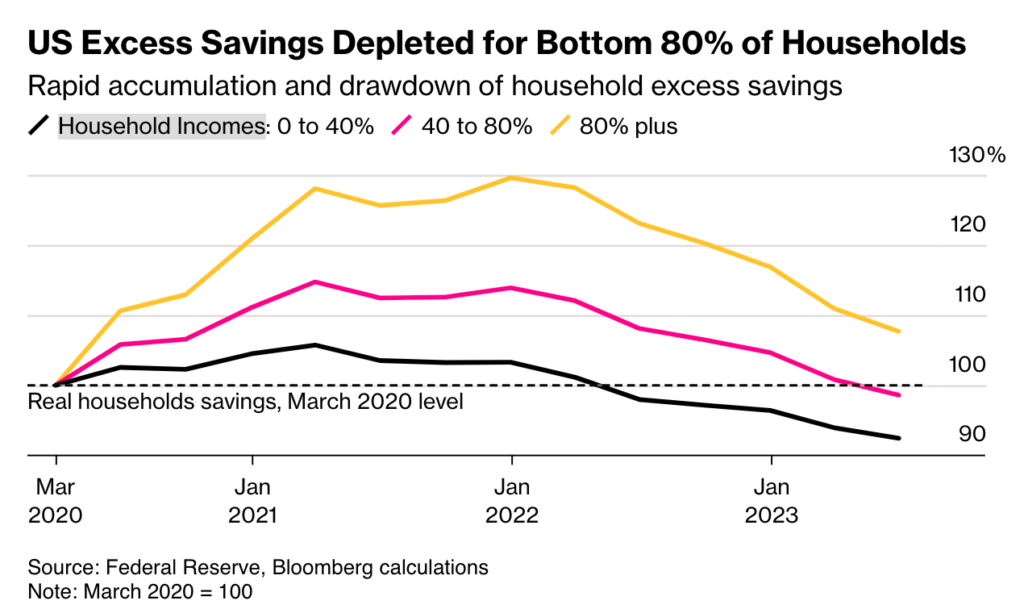
Which, at this point, is even evident to the mainstream financial media! As recently noted by Bloomberg:
Only Richest 20% of Americans Still Have Excess Pandemic Savings…
“For the bottom 80% of households by income, bank deposits and other liquid assets were lower in June this year than they were in March 2020, after adjustment for inflation.”
Ordinarily the solution would be a Federal Reserve rate cut or some type of bailout/back stop. In the past, there have also been some forms of government solutions?! And yet, the Fed’s lies, and looming government should be speaking volumes to everyone!
We believe Powell is well aware of what the most likely outcome of the Fed’s limited solutions will create given the ramp in fabricating the truth coupled with making sure “soft landing” was NOT his “base case” as we discussed earlier.
We’re literally drowning in the Federal Reserve’s (and government’s) previous “solutions” to past catastrophes. Rather than allowing for a normal credit default cycle decades ago, free money funded via low interest debt became the “go to” solution … which has now created a massive problem!
And now we’ve reached an inflection point. As a country, we recently crossed the $33 TRILLION in debt mark, and it took a week to add north of $100 billion to that number. That’s roughly $14.3 billion per DAY; $596 MILLION per hour! We’re now spending over $3 billion in interest on debt per day as the current administration is attempting to deficit spend to the tune of another $1.85 trillion by years end?!
Things are coming to a head, and quickly! But it’s going to be very difficult to “bail” out the consumer when the government is drowning in debt and the Fed has lost control of the bond markets.
As if the consumer hasn’t been through enough over the past 3 years, they’ve recently been hit with SNAP benefits ending, the resumption of student loan interest accruing (9/1/23), student loan payments set to begin for nearly 30 million borrowers on 10/1/23; the IRS recently halting ERC payments given the massive amounts of fraud in the program, and the UAW strike now a few weeks in … we’ve previously discussed everything above except for the UAW strike; NOW CONSIDER:
On Hedgeye’s most recent 4Q2023 macro themes call this past Thursday, their 180-page slide deck educated subscribers to, among other things, insight on some additional, significant, and more importantly, imminent financial shocks that admittedly, we didn’t have on our radar:
- October 1st: Childcare-Cliff ($24 billion funding expiring for nearly ~3 million people
- October 4th: Kaiser Permanente worker strike (75k Healthcare workers)
- October 15th: California Tax Extension deadline: bills are finally due.
- 4Q23: Health Insurance premium spike
- 4Q23-1H24: Continued unwind of Pandemic Medicaid coverage (coverage loss for 8 to 24mm people)
- 4Q23-3Q24: EIDL Pandemic Loan Repayments due (on $380 billion in loans)”
The granularity of Hedgeye’s data is unsurpassed, but more to the point, the financial impact of these events will just further compound the massive contraction that’s already in motion crushing growth and most Americans.
Final Thoughts
“If I’m addicted to anything it’s my process and discipline … given the severity of the dislocation in markets from the data, other than some price action in a select few securities, the only thing we can find that’s changed … is the data continues to deteriorate, in MOST cases, at a faster pace!” OSAM June 2023 monthly
That was June … and since then, the data continues to deteriorate “at a faster pace” … and markets, from bonds to equities have begun to sell off again right on que. The most recent 3 to 4 weeks are reminiscent of last year with a limited number of asset classes “working”.
As more cracks appear in the system, the facade that “all is well” needs to be maintained at all costs by Federal Reserve officials, even if that cost is burying themselves beneath a pile of lies … this happens in every cycle. But there comes a point in time where the mistruths are so blatant, the markets begin to call bluffs.
Markets understand that a 38% increase in oil over the course of 3 months will have re-accelerating impact on CPI. They also understand as oil goes, so goes the input costs of countless items. Whether an oil by-product is needed to manufacture a specific product, or it’s just used to transport it, higher oil/energy prices will lead to increased prices of other products.
In Powell’s pause, “hawkish” or not, he eroded what little confidence was left in the system. Everyone heard him speak in Jackson Hole, he was specific in stating the Fed would be data dependent and when he ignored the re-acceleration in every metric the Fed considers, markets began to call him out sending both bond yields and oil higher.
Why?!
When we suggest the Fed is painted into a corner, what’s the Fed going to do when a massive hedge fund or credit manager blow up? What do they do as swaths of businesses either can’t refinance their debt at these levels or decide to just close their doors because they can’t survive in the current rate environment (which is already happening)?
What do they do when credit and/or equity markets really begin to collapse?!
Do they cut rates, as we head into a recession?!
What do you think happens to the price of oil if interest rates are cut?! Oh, hello again massive inflation! And goodbye any form of price stability the Federal Reserve or Global Central Banks attempted to achieve the last year and a half.
(This is where we remind you that historically, markets crash even harder when the Fed starts to cut as even they finally conclude, along with investors, that we’re already in a recession!)
At the same time, what do you think happens as interest rates remain at current levels (or move higher) in an effort to quell inflation in the face of a wall of $1.5 trillion face value bonds that need to be repriced by next year?! The answer is a wave of bankruptcies and defaults from personal to corporate, that will make a normal default cycle look like kinderspiel.
Did we mention that a massive layoff cycle ensues as labor is the latest of late cycle indicators?!
We just witnessed Oil, USD, Global Yields (including US treasuries), mortgage rates all scream higher when Powell didn’t raise rates … as we steamroll into a recession. What do the markets know that Powell doesn’t?!
They know what the data is screaming … markets know Powell was lying, too!
Higher rates will absolutely crush asset prices in everything from equities to anything with rate sensitivity. While a cut in rates won’t fix the current macro landscape … it doesn’t save the consumer, doesn’t put more money into their pockets to spend; or consume more.
It’s some corner the Fed is painted into … patience is prudent!
Good Investing,

Mitchel C. Krause
Managing Principal & CCO

4141 Banks Stone Dr.
Raleigh, NC. 27603
phone: 919-249-9650
toll free: 844-300-7344
mitchel.krause@othersideam.com
Please click here for all disclosures.

