

In This Article


We began our 3Q2022 note off with an Aesop fable … “The ass &his driver”. To my surprise, some readers were unfamiliar with both Aesop and this particular “fable”. Though, as we noted then:
“The beauty in these fictional tales resides in their elegant simplicity.”
Given the “disconnect” between current economic conditions as defined by THE DATA vs. recent equity market reaction as most perceive it to be, we felt it appropriate to break things down … and simplify things as best we can?!
This month we’ll discuss the data (which we’ve primarily gotten very right); liquidity, which we’ve gotten both right and wrong (on timing) and more.
To start, we’re going to piggyback off of last month’s theme of “reflexive loops”, as they become more transparent daily, but first:
The Hare & the Tortoise
A Hare was making fun of the Tortoise one day for being so SLOW. “Do you ever get anywhere?” he asked with a mocking laugh. “Yes,” replied the Tortoise, “and I get there sooner than you think. I’ll run you a race and prove it.”
The Hare was much amused at the idea of running a race with the Tortoise, but for the fun of the thing he agreed. So, the Fox, who had consented to act as judge, marked the distance and started the runners off.
The Hare was soon far out of sight, and to make the Tortoise feel very deeply how ridiculous it was for him to try a race with a Hare, he lay down beside the course to take a nap until the Tortoise should catch up.
The Tortoise meanwhile kept going slowly but steadily, and, after a time, passed the place where the Hare was sleeping. But the Hare slept on very peacefully; and when at last he did wake up, the Tortoise was near the goal. The Hare now ran his swiftest, but he could not overtake the Tortoise in time.
Moral of the story: The race is NOT always to the swift … similarly, when it comes to investing, we’ve noted in the past that, “patience, at times, is prudent”!
The proverbial noose tightens!
Lending is tightening – it’s no longer up for debate … while we’ve been detailing it for nearly ¾ of a year via the Federal Reserve’s Senior Loan Officer survey (SLOOS) and last month per the Dallas Fed Survey … at this point all of Wall Street has now become an expert on a data series they never spoke about until recently.
Admittedly, they’ve been busy shifting the laser pointer around trying to focus everyone’s attention on the performance of 7 large cap tech names and everything other than the rot under the hood of the economy, including the US banking system … but this most recent report is too damaging for them not to address.
April’s Senior Loan Officer Survey showed an acceleration in tightening standards with increasing spreads, and lower demand in virtually every type of loan … per the report:
The April SLOOS included three sets of special questions, which inquired about banks’ changes in lending policies for CRE loans over the past year; about the reasons why banks changed standards for all loan categories over the first quarter; and about banks’ expectations for changes in lending standards over the remainder of 2023 and reasons for these changes.
In response to the first set of special questions, banks, on balance, reported tightening lending policies for all categories of CRE loans over the past year, with the most frequently reported changes pertaining to wider spreads of loan rates over banks’ cost of funds and lower loan-to value ratios.
Regarding the second set of special questions about reasons for changing standards on all loan categories in the first quarter, banks cited a less favorable or more uncertain economic outlook, reduced tolerance for risk, deterioration in collateral values, and concerns about banks’ funding costs and liquidity positions.
Finally, regarding the last set of special questions about banks’ outlook for lending standards over the remainder of 2023, banks reported expecting to tighten standards across all loan categories. Banks most frequently cited an expected deterioration in the credit quality of their loan portfolios and in customers’ collateral values, a reduction in risk tolerance, and concerns about bank funding costs, bank liquidity position, and deposit outflows as reasons for expecting to tighten lending standards over the rest of 2023.
In August of 2022 when discussing this topic, we explained to readers:
“The Federal Reserve reaches out to Senior loan officers at financial institutions across the country asking 3 primary questions in regard to ALL types of lending: C&I (Commercial and Industrial), CRE (Commercial Real Estate), RRE (Residential Real Estate), Consumer lending, etc.
The question asked are: 1. Are you tightening lending standards? 2. Are you increasing spreads? 3. Are you seeing stronger demand?”
We continued…
“What’s more troublesome, as noted by Hedgeye Financials sector Head/Macro team member Josh Steiner on “The Hedgeye Call” from August 2nd (2022):
“When 2 of those 3 (the questions asked) have inflected to net tightening conditions, you’ve had a recession every time shortly thereafter. In all cases, we’re seeing this here … a massive increase in the net percentage of firms tightening standards.”
As is the case today, as it was back then … in all cases, we’re seeing a net tightening in conditions.
First, let’s take a look at CNI (Commercial and Industrial) lending per the report:
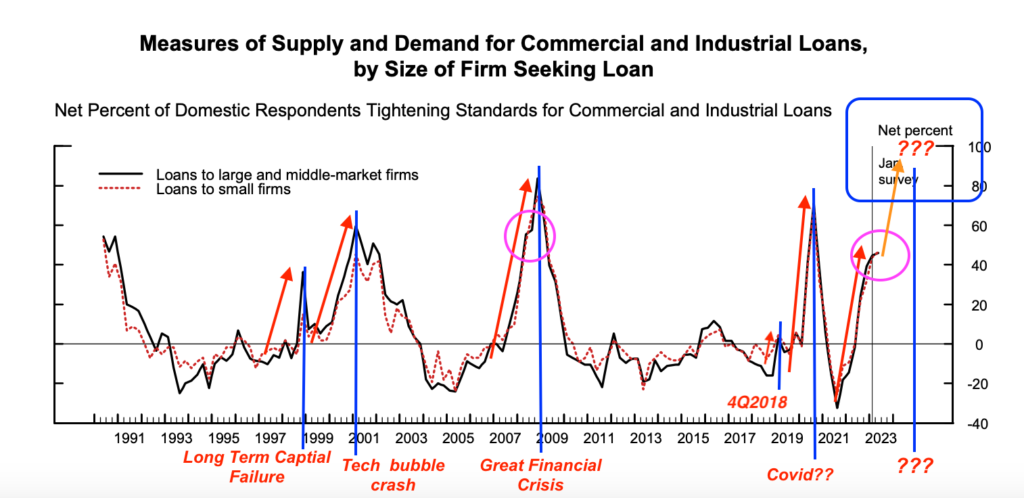
We added red arrows as a guide to illustrate when tightening in previous cycles began, while the vertical blue lines provide readers with an understanding of timing as it relates to the peak of previous CNI tightening cycles … and how they historically coincide with major drawdowns/crashes in U.S equity markets. Again, in all cases: LENDING STANDARDS TIGHTENED PRIOR TO MARKET DRAWDOWNS.
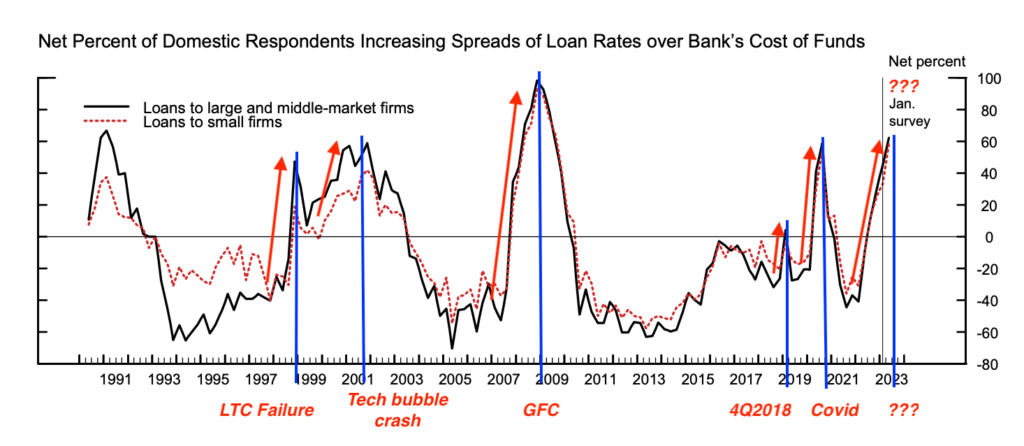
You can see the same dynamic/timing take place as institutions increase spreads:
And finally, STRIKE 3 … loan demand SLOWS prior to previous historical drawdowns.
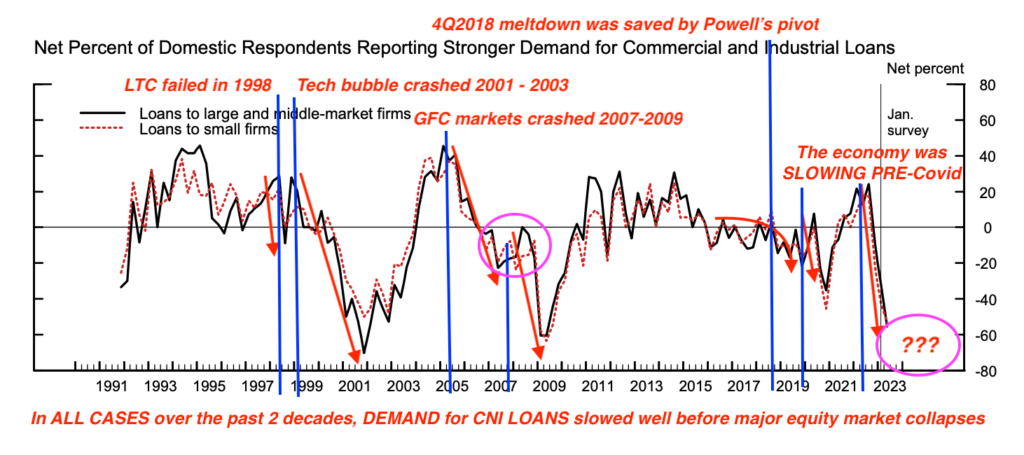
What these three charts illustrate is the very foundation of the reflexive loop we described last month. As the economy slows down, financial institutions tighten lending standards, as we’ve been discussing it for nearly 17 months; the Federal Reserve then tightens into this economic slowdown, which exacerbate the problem further … as extreme tightening conditions accelerate how it adversely affects the:
Consumer
… who continues to struggle today, which is clearly visible in the data.
For starters, U.S. Weekly Redbook Sales did end April with a slight WoW acceleration of +1.8%, before it continued its slide to a new post pandemic low of 1.3% for subsequent weeks throughout May. For context, Weekly Redbook Sales data began the year up in the neighborhood of roughly +10% and has been steadily weakening since.
Headline Retail Sales data has also collapsed in lock step with the weekly Redbook numbers; what began the year at +7.41 YoY has since cratered to +1.60 YoY, a 581 basis-point or (5.81%) deceleration, is one of the largest decelerations over a 3-month reporting period EVER… as we stare at a more difficult comp set up moving forward.
Earlier this week, Hedgeye Consumables sector head, Howard Penny dropped another data bomb re: the consumer:
“Restaurant/casual dining has seen a 1600 basis-point slowdown from the first month of the first quarter (2023) to the first month of the second quarter (2023) … with a 1300 basis-point slowdown in (foot) traffic, down almost 700 basis-points in April alone!”
As credit dries up, the consumer has little to spend on anything but necessities.
Credit card balances also continue to grow at their fastest pace in decades (as we began noting last April/May) and again, have never been larger!
Per the Federal Reserves, Quarterly Report on Household Debt and Credit, household debt is now in excess of $17.05 TRILLION dollars, with interest on credit cards spiking to ALL-TIME high of 20.33% … and while historically, consumers pay down their credit cards in the first quarter of the year, 1Q2023 is the first year in over TWO DECADES, they failed to do so.
The cost of capital on home equity loans & mortgages are also at levels not seen in decades, and still, there is an insatiable demand for more credit … why?! because people don’t have any money and borrowing is their only option.
Which is why we’re seeing credit applications get rejected at an epic pace … per the National Association of Credit Management’s more recent CMI (Credit Managers’ Index) report REJECTIONS have accelerated with April’s factor index hitting 47.9 (which is THROUGH GFC levels) … as card delinquencies continue to spike!
The need/want/thirst for more credit is there, but as we’ve been detailing … the pace in which banks are now tightening credit standards, especially in the aftermath of the largest bank failures in history, is accelerating … expeditiously cutting more borrowers from their lifeline … which bolsters our ouroboros thesis from last month.
So, it should surprise none of our readers that total credit card spending data published in a recent Bank of America report saw its largest decline since February 2021 in April, down -1.2% YoY … Americans don’t have any more money to spend!!!
You may note this rapid deceleration in consumer spending data coincides with 42 million Americans losing SNAP payments we discussed in March…
In the same section of that March note we also highlighted the moratorium on student loan payments would be ending shortly, forcing roughly 40 million Americans to start repaying their loans … at the time we quoted Hedgeye’s Josh Steiner:
The average payment for an undergraduate is $235 per month, student loan with a Graduate degree is on average $600 p/month … so net net, on average, we’re looking at roughly a $400 per month ($393), per household payment that’s set to resume.
We are that much closer to those words being a reality:
“The student loan deferment program will end no later than June 30, 2023, and payments are expected to resume by September 1, 2023.”
With debt servicing at its highest level EVER (on avg. 20.33% as noted above), the cost to service debt is eroding the consumers purchasing power at the fastest pace, EVER! Half of all American’s having less than $500 in savings and/or NO emergency money (as we detailed in February citing date from the Prudential Pulse Survey) …
So, do we really think spending is going to re-accelerate in the face of 40+ million Americans being forced to start repaying their student loans again (roughly $400 p/month) as job losses continue to mount?! Which brings us to:
Labor
Initial jobless claims ticked down to +230k from its prior week of +246k to finish out April, then subsequently moved higher throughout the month coming in at +242k WoW and +264k; it’s highest reading since October 2021 … further supporting what we discussed last month; that despite the nominal fluctuations WoW (Week over Week), claims TROUGHED September 24, 2022, at +182k and is trending higher; UP 45% from the cycle low.
After sequential increases, both the Challenger Job Cuts and Continuing claims data took a breather “improving” slightly with the Challenger data coming in at +67k vs. +90k in March and Continuing Claims decelerated to 1.80mm vs. 1.84mm the previous week, to which we’d reiterate from last month:
- Continuing Claims bottomed at 1.289MM, a mere few weeks prior on September 10th, 2022
So even with the slight improvement it REMAINS +40% off its trough … and:
- We’ve been noting Challenger, Grey & Christmas data since January, in March it was is up roughly 15% MoM … and roughly 320% on a YoY basis!
+320% on a Year over Year basis … very little goes up in a straight line.
For nearly a year we’ve been detailing the deterioration occurring underneath the surface in labor markets and the dominoes continue to fall as another important early warning sign is flashing red; “layoffs” as a percentage of separations are rising while “quits” as a percentage of separations continue to fall … which means more people are getting fired vs. leaving on their own accord.
On their most recent Macro Themes Update, Hedgeye placed today’s labor data into historical context:
“The YoY change in continuing claims has NEVER been this high without a subsequent recession and “warn notices” are pointing to an acceleration in initial claims” Hedgeye CEO Keith McCollough, 2Q2023 Macro Themes Update
A “Warn Notice” for those unfamiliar:
“The WARN Act requires large employers to provide 60 days advance notice of mass layoffs. WARN notices therefore LEAD actual layoffs by 1-2 months and can serve as a lead directional indicator for Claims/JOLTS.” Hedgeye Macro themes update call 5/17/23
Which also points to MORE near-term layoffs! As is, JOLTS job openings for March just registered its lowest level since April 2021, decelerating to 9.59mm, (-18.4% YoY vs. 11.755mm April 2022), with both “overtime” and “temp” staffing collapsing! These are not numbers to be ignored.
When discussing labor, it’s negligent to not discuss the NFIB Small Business Sentiment which recently hit yet another new cycle low of 89.0 … registering its lowest level in over a decade.
The more worrisome part of this already miserable report is the FORWARD outlook component which continues to hover around all-time lows at -49
In a recent Market Edges email sent to all Hedgeye clients, Hedgeye Keith McCollough spoke to the NFIB:
The National Federation of Independent Business goes straight to the source, asking everyday people how they feel about the economy. What they found is small business owners have lost confidence. The NFIB Small Business Optimism Index reached a new cycle low in April, plummeting even further than it did during the COVID pandemic.
As Mitchel Krause, founder of Other Side Asset Management and Hedgeye Power User, pointed out in this tweet, 99.9% of all businesses in the U.S. are small (500 or fewer employees) and contribute 45% to 50% of the U.S. GDP. These companies will have no choice but to lay off employees in a #Quad4 recession.
There’s a reason we’ve been discussing the importance of financials tightening lending standards, for it flows through to both, the consumer, and small businesses … which are the true drivers of the economy. Credit flows to small businesses and consumers via lending, which drives consumer spending, and ultimately the economy.
A contraction in credit translates into a ‘lack’ of spending which equals a collapse in earnings. This, in turn, forces layoffs which feeds back into more tightening of credit (again, see reflexive loop)
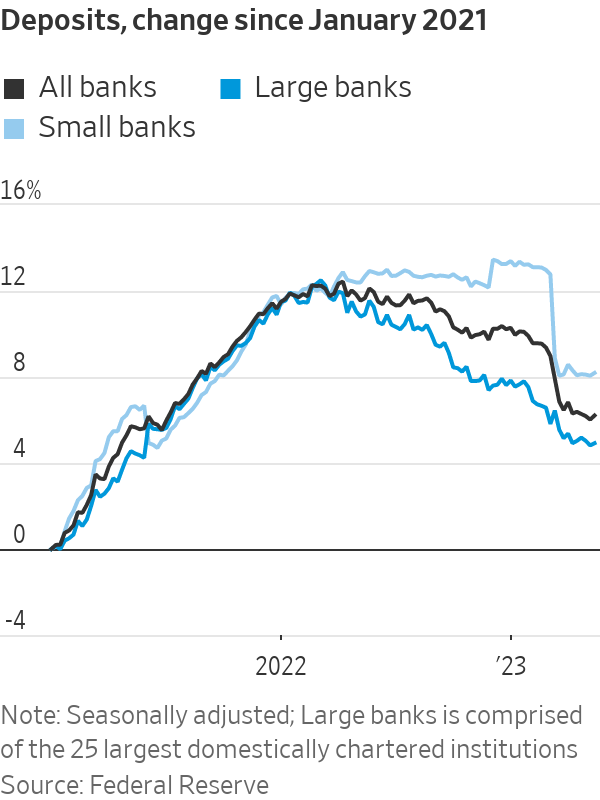
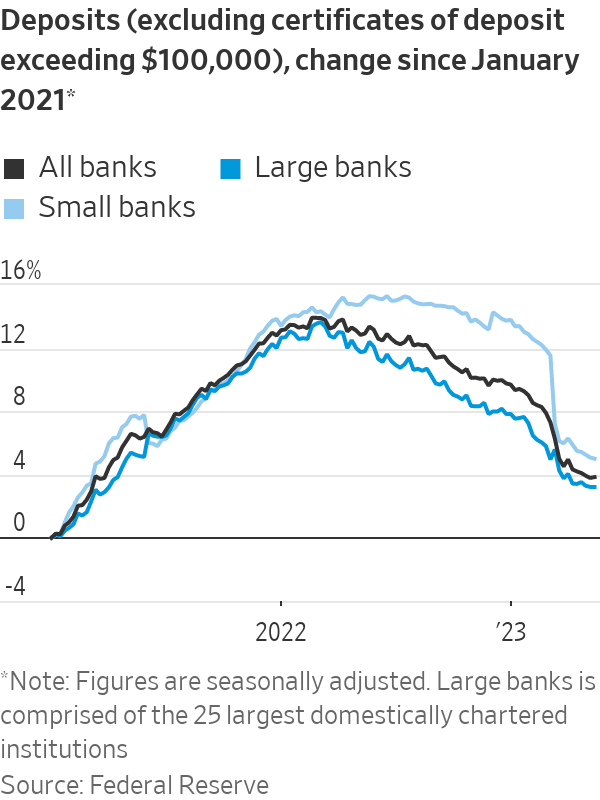
The data is empirical fact, and it all began to decelerate well before the current ‘regional banking crisis’ courtesy of the Federal Reserve hiking rates 500 basis-points in such a short time frame, creating a duration mismatch of the balance sheets of virtually all Regional Banks (where deposits continue to fall) … per the WSJ
So, if the data is truly as bad as it is, why haven’t certain “equity markets” as most define them, outright cratered?!
LIQUIDITY
While we’ll explain this catalyst below; let’s briefly take a step backward to move a few forward, for this dynamic is likely to change, and abruptly.
In February we detailed the “liquidity” dynamics across global markets, highlighting an article published by the FT (Financial Times) written by Michael Howell, managing director of Crossborder Capital and author of ‘Capital Wars: The Rise of Global Liquidity’.
Howell contended, 2023 shouldn’t be “so bad for assets, because the cycle of global liquidity is bottoming out” … being of the belief that we’ve “just passed the point of maximum [global central bank] tightness.” and “stealth QE may be back next (this) year and make what looks to be a difficult year feel a tad better” … at the time we suggested his conclusion to “possibly be pre-mature”.
To date, if you measure markets by the S&P 500, Nasdaq, or Russell 2000 indices, he’s been right, we’ve been wrong … these indices are currently up on the year while at the same time, they continue to be down quite significantly, for the cycle.
However, remember how the math works: Inclusive of this year’s YTD performance, the Nasdaq is still down nearly -21% from its November 19th, 2022, cycle peak, which means investors still need to be up over 26.5% to breakeven; the Russell 2000 and S&P 500 are down roughly 27% & 14% from cycle peak respectively; requiring a ballpark return of 35% & 17% to break even … buying into the marketing of YTD returns skews these facts.
At the same time, the performance of these indices are being held up by roughly 7 tech stocks which now comprise a mind-numbing percentage of these indices and nearly 90% of their returns. $AAPL and $MSFT alone represent 14.5% of the entire S&P 500; and over 40% of the $XLK.
The chart below (my sincere apologies and credit to the source as I cannot find my link) shows the relative performance of these 7 companies within the S&P 500 which have provided the ‘outperformance’ while the rest of the S&P ‘493’ have done virtually nothing on the year.
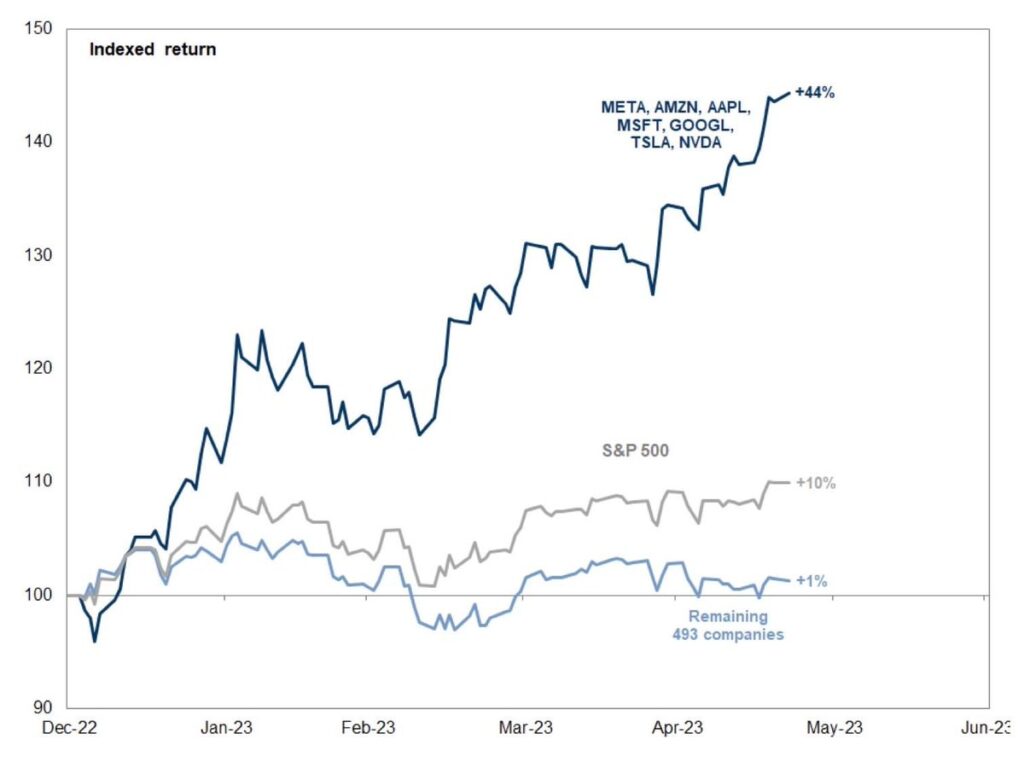
As it stands today, $AAPL has a larger market cap than the entirety of the Russell 2000 index.
For those who are frustrated we are not long these 7 names: $AAPL recently reported major decelerations in sales in most product lines and just cut their iPhone 15 deliveries by 30%; $MSFT just began laying off more employees last week and South Korean exports of semiconductor chips were recently down over 30%, yet $NVDA just added nearly $200 billion in market cap, in a single day, on a 14.4% YoY revenue deceleration, but a forward “guide” in revenue relating to AI (Artificial Intelligence) chip sales (i.e., something that has yet to happen).
Nvidia ($NVDA) is currently a stone’s throw away from a $1 trillion dollar market cap, with less than $40 billion in annual revenues, making it 6 times the size of Intel ($INTC) with roughly half the revenue.
Decelerating sales, reduced demand and slowing revenue on a RoC basis does NOT equal “growth”, they are bubbles, created and fueled by increased liquidity and the passive investing dynamic, which ultimately pop as liquidity dries up!
In his article, Howell believed was of the opinion that the Central banks would be running “stealth QE”, but they’re not; outside of Japan and China, central banks have been muted! On the other hand, we can’t say the same thing for the U.S. Treasury?!
To date, we’ve definitely underestimated the power of Treasury Secretary Yellen spending down the TGA (Treasury General Account), which has translated into roughly $200 billion per month, which has, in fact acted like a synthetic QE (Quantitative Easing).
Where ordinarily, the U.S. Treasury would be issuing bonds to fund the government’s current and future spending needs, given the debt ceiling limits, there has been no treasury supply to be bought … thus the liquidity that would ordinarily be soaked up by these treasury purchases has been free to slosh around in the financial system, primarily flowing through to a select number of risk assets, which happen to represent the largest percentage holdings of major indices, and as such, they are deemed the ‘most liquid’.
While we knew this liquidity was out there, one item we outright missed, was the liquidity dynamic generated from ERC refunds also known as, “employee retention credits” or government subsidized COVID relief programs to employers that retained employees through September 2022, in order to receive a tax-free credit of nearly $27k for every employee retained through covid.
This along with other COVID aide became a near $400 billion dollar windfall for business owners over the past year and a half, but ERC’s have been largely paid out over 4Q2022 into 1Q2023.
When coupled with the passive bid that lives and breathes in markets daily, which amounts to somewhere in the neighborhood of $2.5 billion dollars from Blackrock and Vanguard as 401k contributions remain largely intact (partially because of the ERC program), this excess liquidity has concentrated in the largest of names (described above). So, while layoffs have been rising, they have not reached a level which tames this daily passive bid … yet!
Additionally, on average, share repurchases provide a bid of roughly $800 billion dollars over the course of any given year … which, when combined with the 401k/passive bids, suggests roughly $1.5 to 1.6 trillion dollars (or 5% of the S&P) will be bought throughout any given year, until certain dynamics change.
Again, we understand that there are reasons markets WANT to go higher and frequently do (in the face of bad news, and it’s not always the reason Wall Street sells you) … AT THE SAME TIME, cycles, fully loaded with deleveraging and credit events, happen!
Market crashes historically take place when the economy is slowing as defined by both growth and inflation simultaneously decelerating (Hedgeye #Quad4). CREDIT EVENTS typically occur under these same conditions but are exacerbated by poorly timed and executed Federal Reserve policy in the form of excess tightening via their “blunt tools”. A substantial increase in the cost of capital slowly but surely forces a deleveraging upon a system … which it can’t handle.
When these credit events take place, they are most frequently CRUSHING to the life’s savings of most investors.
As the cost of capital skyrockets (like it has), and access to capital in the form of credit dries up, funds are forced to deleverage. When asset prices in non-tradable investments collapse, firms will be forced to sell what they have the ability to … where they can find the liquidity; in the meantime, they will place whatever excess capital they have in what’s perceived liquid (creating a liquidity trap)!
So, what makes us think the liquidity dynamic is what will inevitably create such a credit crisis?!?
As we’ve been telling you, it already has … BREIT, SREIT, KKR, CIM Real Estate Finance Trust, Inc. (CMFT) is a $7.4 billion dollar, public, but non-listed REIT among others that have all frozen shareholder redemptions … THIS IS A MASSIVE CREDIT EVENT!
When investors can’t get their money out of an investment, that’s a credit event! The masses rushing towards the perceived liquidity in roughly 7 equities, it also part of such an event. In the past, it is eventually where everyone is forced to pull their money from when redemption requests need to be met (as the above liquidity measures dry up) … performance like this should NEVER take your attention away from the enormous red flags that are being waved!
If pressed for more examples as proof that we’re in the heart of a major credit event … residential real estate and refinances have near frozen with mortgages back over 7%; multi-billion-dollar commercial Real estate deals are selling at a fractional of a. build cost and b. multi-decade pricing if bids and financing can even be found … Moody’s analytics recently noted that 84% of the $7.8 billion in commercial CDS scheduled to mature this year “could have trouble refinancing”.
And finally, for the purposes of this example, dare we mention we’ve had more bank failures to date than took place in all of 2008 throughout the GFC (Great Financial Crisis)?! With the Federal Reserve bumping short term rates as high as they have, there’s little reason to keep your deposits in a bank that can’t compete with a treasury backed money market fund. BANK FAILURES WILL CONTINUE.
But broader indices are up on the year?! Yeah … I got it!
“Change, & abruptly”
The first sentence we wrote in the above section was, “this dynamic is likely to change, and abruptly” … let us elaborate?!
First, the TGA Yellen has been “spending down” is just about empty. She’s on record as saying the U.S. will “run out of money” on June 1st, and while her statement is a bit disingenuous … the TGA is spent down … so, she may be able to temporarily pull some strings, her options are ‘abruptly’ dwindling, she can no longer draw blood from a stone.
Speaking of disingenuous, for anyone to suggest the 14th Amendment gives the government the ability to wave a wand to infinitely spend … it does not!
“The validity of the public debt of the United States, authorized by law … shall not be questioned!”
Default on our debt is protected by the 14th Amendment … what is NOT protected by the 14th Amendment are all of the other government spending programs, which means resources are to be cut and/or diverted from other areas to pay interest on our debt until a deal is struck.
I want to be clear, while in final edits a “preliminary” debt ceiling resolution was announced. By no means am I suggesting that anyone should root against a resolution … nor should anyone want this to become a constitutional calamity, though I am having a difficult time believing what’s been put on the table from McCarthy turns into anything other than that; a calamity, as 34 Republicans have already stated they will #HoldTheLine for America.
Regardless of how this turns out, it’s very important to understand that ANY resolution is in fact, a NET NEGATIVE given a. debt is deflationary (especially at current interest rates) and b. the dynamics of the liquidity suck out of the system as we begin to issue treasuries, fund government spending and re-fill the TGA.
While we don’t know exactly when this ‘liquidity suck’ bleeds into risk assets, @ZeroHedge gives us a glimpse into history of what happened, “the last time Treasury cash (TGA) dropped to almost 0 and was rapidly refilled was Dec 2021”
Please be sure to read those log scales properly, risk markets ARE NOT GOING UP!
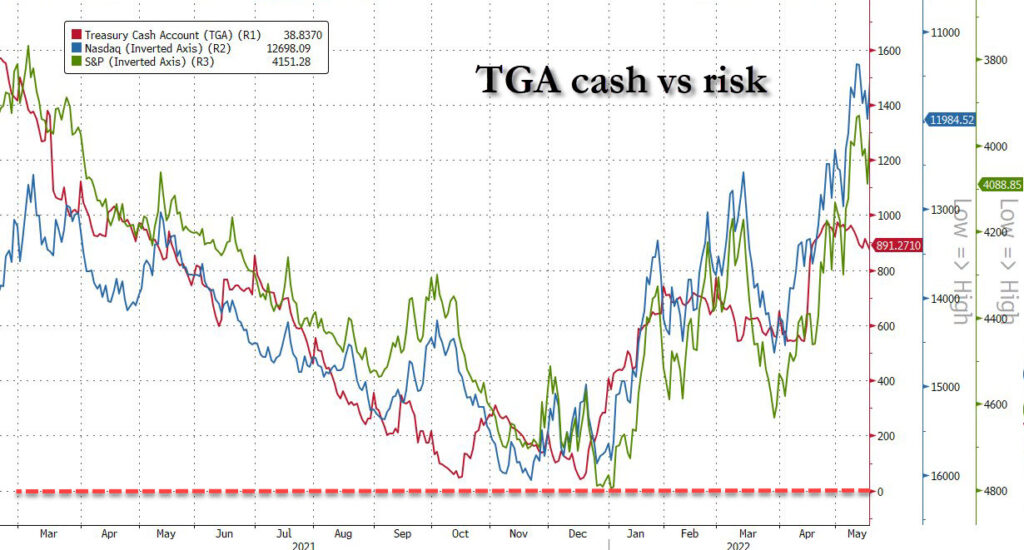
It’s also important to note that everything we’ve discussed above … the gating of redemptions, bank failures, CRE debacle, oil, and commodities down 40% and 22% respectively from cycle highs … the Nasdaq, Russell 2000 and S&P 500 still down 21%, 26% and 14% respectively from their cycle highs; all of these events continue to unfold WITH a synthetic QE running in the background in the form of the TGA spend down and the ERC refunds being paid out … which are both about to end, ‘abruptly’.
Running through the paces
As we walk the final few holes of this note let’s quickly tie some additional data into the conversation.
GDP came in at an annualized SAAR of +1.1%, down from 4Q2022 at +2.6% … on a YoY basis it accelerated slightly up +1.6%, versus +0.9% YoY in Q4 2022. This “beat” of Hedgeye’s NowCast came at the hands of an +81-basis-point contribution from GOVERNMENT SPENDING … or the G in C+G+I calculation (consumer + government spending + business investment). Per Hedgeye Director of Research Daryl Jones:
“Incidentally, this was the largest Q/Q contribution from government spending since Q1 2021”
While we touched on the preliminary debt ceiling debate ‘agreement’, there are a few things we do know:
- Government spending will slow, mildly or not!
- The TGA (Treasury General Account) still needs to be replenished!
- The Consumer continues to slow.
- Student loan payments are re-starting on 40 million Americans.
- The deceleration in M2 (money supply) is at an all-time low.
All are net negative liquidity sucks from the system, and ALL are impairments to each component of the GDP calculation noted above (C+I+G).
The current macro set up, when combined with the Fed’s actions have created an environment where many businesses simply can’t survive (debt ceiling resolution or not). Last September we made this point by quoting Hedgeye communication sector head Andrew Friedman, succinct and to the point:
“The fundamental problem here is that you have entire business models and capital structures that have been built up over the past decade that were just based off of zero percent or very low levels of interest rates and now with rates and spreads where they are, and continue to go, the math just doesn’t work.” Andrew Friedman @Hedgeyecomm “The call” 9/27/2022
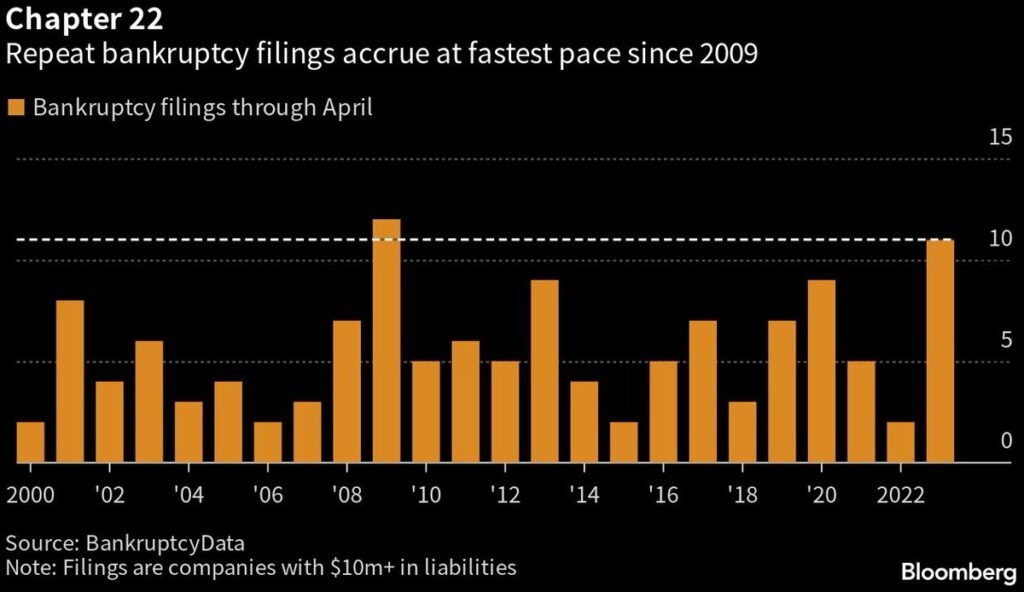
About that bankruptcy cycle … per Bloomberg … FILINGS ARE ACCELERATING AT THEIR FASTEST PACE SINCE 2009!
And while we’ve been screaming about the negative cascading consequences from commercial real estate and redemption request rejections (i.e., liquidity freezes), the failures in regional banks will have a larger impact on the overall economy due to the importance of the extension of credit (or lack thereof)?!
Famed distressed asset manager Howard Marks of Oaktree penned this in a recent memo to investors:
Since banks are so highly levered, with collective equity capital of just $2.2 trillion (roughly 9% of total assets), the estimated amount the average bank has in CRE loans is equal to approximately 100% of its capital. Thus, losses on CRE mortgages in the average loan book could wipe out an equivalent percentage of the average bank’s capital, leaving the bank undercapitalized. As the BofA report notes, the average large bank has 50% of its risk-based capital in CRE loans, while for smaller banks that figure is 167%.
Over the months, we’ve provided numerous examples of realized losses mounting in the CRE space with buildings being abandoned and/or sold for a fraction of their build/development cost.
Additionally, we’ll reiterate: $1.4 TRILLION in debt needs to be refinanced in commercial real estate loans between now and the end of 2024 with rates continuing to rise and the 2nd largest group of lenders to the CRE markets (regional banks) barely functioning as deposits continue to flee these financial institutions given our current rate environment.
Short-term treasuries have also just reached the very point which triggered the implosion of regional banks that occurred in March (at the same time the TGA will start to be refilled) … but, you’ve got to own $NVDA?!
As for whether or not we’ll get any reprieve from the Fed with a reduction in rates, recent inflation data ala CPI & PCE echoes what we’ve been saying for what feels like an eternity … the inflation data, as the Fed reads it, will not fall fast enough:
the reality is that while inflation is falling, it’s not declining at a fast enough pace to alter the Federal Reserve’s path, nor is it decelerating where the majority of Americans need it to the most. OSAM January 2023
Which continues to be the case:
Headline CPI for April registered 4.9% YoY, slowing fractionally from March’s 5.0%; Core CPI (ex-food and energy) slowed marginally as well, down 10bps to 5.5% YoY! This remains well in excess of the Fed’s 2% inflation target, which should hold them higher for longer doing further irreparable damage to the economy (i.e., the regional banking system).
As Wall Street aggressively prices in rate cuts, Federal Reserve Chairman Powell’s message has remained the same; recently speaking with former Fed Chair Bernanke, Powell had this to say about rate ‘expectations’:
“markets appear to be pricing in a different rate path than the committee expects to be appropriate, but I would say that this disconnect does not seem to reflect a misunderstanding of our reaction function, or a lack of belief that we’ll do what’s necessary to bring inflation down, rather it appears to reflect a different forecast; one in which inflation comes down much more quickly than committee participants think is most likely. Perhaps due to a significant downturn. I would say also so far, the data have continued to support the committees view that bringing inflation down will take some time.” Fed Chair Jay Powell Minute 37:45
And this to say about rate cuts at the most recent Fed press conference:
So, we on the Committee have a view that inflation is going to come down—not so quickly, but it’ll take some time. And in that world, if that forecast is broadly right, it would not be appropriate to cut rates, and we won’t cut rates. Fed Chair Jay Powell 5.3.2023 Press conference
As we reminded readers last August and subsequently thereafter, investors should also be careful in what they wish for re: rate cuts; historically, it doesn’t end well as markets finally conclude the Fed has been dead wrong the entire time, the economy is in worse shape than “marketed”, and the damage done at the hands of Fed policy will be crippling.
Odds & ends … lightning round
- The goods economy is clearly slowing (peaked in March 2021)
- Manufacturing orders have collapsed (Empire Manufacturing data for May -31.8, vs. +10.8 in April)
- NFIB Capex YoY change plummeting
- Real Earnings Growth negative for 25 consecutive months (record)
- Bankruptcies are accelerating (2009 levels – shown above)
- Bank failures have eclipsed GFC levels ($FRC, $SIVB, $SBNY, $SI)
- U.S. Consumer confidence is in the cellar with April decelerating to 101.3 vs 104.0 in March.
- FANNIE MAE % of households expect better financial situations = ALL TIME LOW
- Inventories are up … growth & profits are down … WARN notices are up = more layoffs
- MBA mortgage purchase apps are down –28% YoY.
- Housing affordability has NEVER BEEN WORSE
- Mortgage rates back above 7% = Mortgage purchase applications languishing
- Mortgage refi’s are non-existent!
- ‘Services’ activity has decelerated for 11 consecutive months, and:
- Global trade volumes are slowing!
Having said all of this … Wall Street consensus has been increasing forward looking earnings estimates for the next 12-24 months and Goldman Sachs along with the Atlanta Fed just took UP their forward GDP guidance.
The credit spigot continues to tighten, interest expense continues to accelerate (making CC & home equity payments greater), the savings rate is being depleted at an epic pace and student loan payments are scheduled to resume shortly, further crippling the consumer.
This will further impact the earnings recession and in turn … layoffs will accelerate; unemployment will rise … which eventually reduces the passive bid in markets as those who no longer have a job, pause 401k contributions!
We’re in the midst of a massive credit/deleveraging cycle, and currently, we see no fresh fiscal or monetary bailouts on the horizon; especially to the tune of $5-7 trillion dollars. Being data driven, we have no idea where they believe this growth to be coming from?! and as we’ve said it before … CYCLES TAKE BOTH TIME & PATIENCE!
When liquidity dries up…
As I sit and type after hours at my daughter’s gymnastics practice; I’m often befuddled when I see high level athletes consistently making the same mistakes that are met with grade A coaches who repeat the same message in an effort to fix those mistakes … the more this pattern repeats, the more I scratch my head!
The coaches and athletes who separate themselves from the pack are those with the ability to recognize that there is a disconnect between what the athlete is ‘hearing’ vs. that which the coach ‘believes’ they are conveying. Which is why we believe it’s important for us to find new ways to express/highlight very specific concerns we have to our readers, especially when we feel as if the importance is being lost or overshadowed.
In the past we’ve discussed Michael Green of Simplify ETFs & Tier1 alpha, @profplum99 on twitter … we believe his knowledge and skill set makes him one of the brightest minds in this business … and still, bad things can happen to really intelligent people!
In our efforts to illustrate what a credit event looks like when liquidity dries up, we’ve discussed bonds/equities & ETFs going “bidless”, we’ve explained the dynamics of banks failing, BREIT/SREIT/KKR and others “gating redemptions … ALL OF WHICH HAVE HAPPENED IN THE LAST 6 MONTHS, yet investors are focused on a handful of equities; so, we’re going to try to present this slightly differently.
In May of 2008, Mike was managing a portfolio of roughly $750 million dollars for the hedge fund he worked for at the time, Canyon Partners. Over lunch, a business associate paid him a compliment … he was told that “he was the smartest guy in the world”. Given Mike’s humility, in his mind, if this individual considered him the smartest guy in the world, something was wrong – so, upon returning from lunch, he immediately reduced the risk in his portfolio, liquidating most of his assets … which was a good decision at the time!
Come October, with markets having crashed, Mike was ready to get his portfolio back to work … which was met with upper management letting him know, that wouldn’t be possible! Given market conditions, and the performance of certain investments made at (and by) the firm, Mike’s portfolio represented the majority of a very limited amount of liquidity available at the firm.
Mike went from managing $750 million in May to $27 million in October … let me repeat that … Mike went from managing $750 million in May to $27 million in October.
October of 2008 is the same time, Hedgeye CEO and founder Keith McCullough was fired from his employer, the Carlyle Group, as the firm’s liquidity also disappeared virtually overnight when the ‘marks’ on bond portfolios had to be taken.
The same thing happened to Long Term Capital in 1998! WHEN LIQUIDITY DRIES UP, IT OFTEN HAPPENS IN A BLINK! While warning signs have been flashing for some time now, Hedge fund Tiger Global just announced their “looking for bids” (i.e. liquidity) for much of their “illiquid portfolios” at the same time “Private Market Fundraising Hits the Skids”.
Anyone care to take a stab at what happens when they can’t get any bids?! Or when the bids reflect the true marks to market well below current reported ‘values and redemption request/margin requirements hit?!
Final thoughts
We continue to stress patience in the cycle, as supported by the data. From the onset of this note we began with highlighting the proverbial noose around the economy’s neck. This tightening of credit dynamics will further retard an already weak economy due to the ongoing crisis in regional banks (courtesy of Federal Reserve rate hike policy), by restricting the spending capacity of consumers and businesses alike.
The re-start of student loan repayment is just gasoline to the already roaring fire.
This slowdown adversely affects everything from slowing demand leading to excess inventory issues being met with the slashing of prices, to narrowing of margins, then a collapse in earnings (think $TSLA). This accelerates the labor cycle (layoffs) completing the reflexive loop we discussed last month.
We follow the data for many reasons … first, it back-tests, and as much as we’d like it to, it doesn’t always do so in a straight line! Outside influences (i.e., noise like the debt ceiling debates) can impact markets creating what we’ve previously discussed as “micro-cycles within a broader macro-cycle”.
Second, it allows us to navigate markets by removing emotion from the equation. That doesn’t mean we don’t ‘feel’, we take our profession and duty to our clients VERY seriously. It also doesn’t mean that we aren’t keenly aware of what others are feeling.
Recently, we’ve fielded some calls of frustration, which we completely understand; we have seen underperformance YTD with both our long and short positions under pressure. Interest rate sensitivity, such as gold, gold miners, consumer staples, utilities (which we’ve been stopped out of), bonds, have been weak as bond traders have been pricing in default risk.
Short exposures have also faced pressure given the performance of a small group of large cap technology companies (discussed above), which have become the ‘perceived’ stability/safety trade, holding up the entirety of the S&P 500 and Nasdaq … while the breadth of these markets are screaming concern with new 20-day highs being dwarfed by new 20-day lows.
The title of our note published on January 26th, 2020, roughly three weeks before one of the largest and fastest U.S. financial market collapses in history was The Importance of History … and boy, is it “Rhyming” Today?!
Which was the last time we heard the very same message from some clients that we’re hearing today … History rhymes, because human behavior and the emotional responses of the masses never changes. Market structure and liquidity dynamics have convinced many through price action that everything is fine, and all is clear when THE DATA and underlying signals are singing the same song that has led to just about every major market collapse in modern history.
Just as the hare lost its race to the tortoise due to extreme over confidence and arrogance, the impatient are very likely to figure out why “history rhymes” and so many people are caught off guard by it.
While down YTD, our performance remains MUCH better than both the Nasdaq and Russell, from a cycle to date perspective, while being in-line with the S&P. It may not ‘feel’ that way, because we didn’t feel the extreme pain of most investors last year, who lost between 23% to 33% in the S&P. Russell, Nasdaq, or Government bonds last year, respectively.
History also rhymes when it comes to the negative impact employment has on markets, as recently noted by Chief Investment Strategist at Piper Sandler, Michael Kantro:
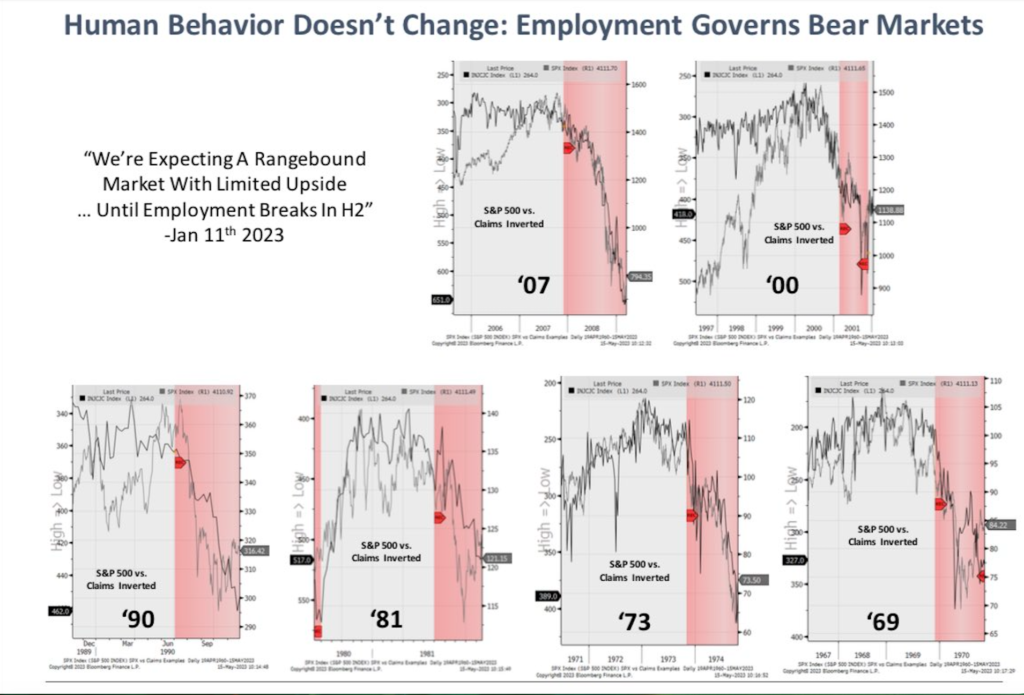
And as the tightening in credit (by banks) and the reintroduction of student loan repayment sucks the life from the consumer, the lack of spending will drive us deeper into recession; in turn, accelerating layoffs.
Given the ever-rising importance of the passive bid with the growing popularity of passive investing over the years, a spike in unemployment will likely have an even larger impact on market performance as it will be shrinking this bid concurrently with the reversing of the previously aforementioned liquidity dynamics … and still, no data in sight for the Fed to point to cut rates, let alone pause for any length of time.
Given its importance, a quick note on employment as we sign off…
Mike Green, who we mentioned above, writes a weekly substack titled, “Yes, I give a FIG” … we highly recommend you take a look at his most recent note. Mike’s been breaking down the labor data on an extremely granular level, which echoes what we’ve been discussing for some time in regard to high wage earners getting laid off.
“This week the BLS added evidence to this outlandish claim with the release of the Quarterly Consensus of Employment and Wages. Labor compensation actually FELL in 2022. Not only in real terms but in nominal terms. This is exceedingly rare and completely incompatible with the narrative of a strong labor market:
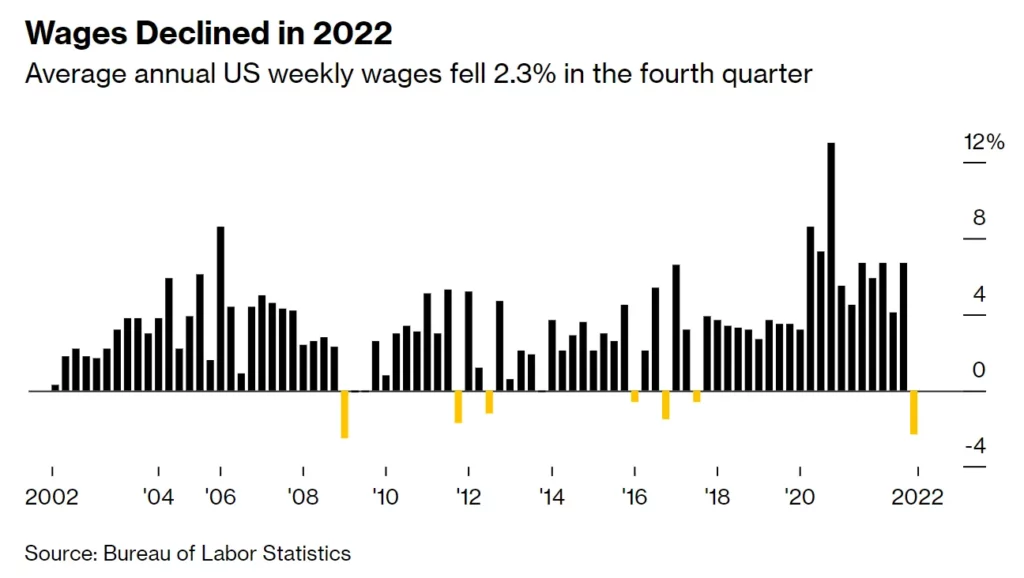
And if we continue to push on this thread, we discover that, exactly as we had hypothesized in last week’s note, the damage is coming from the high end:
The QCEW figures differ from other government measures of wages in that they include thinks like bonuses, stock options and severance pay.
From last week’s YIGAF in reference to the oft-cited Atlanta Fed Wage Tracker:
“Does anyone else see a problem in the data series that ignores the top 15% of workers in a recession that appears to be LED by the top 15% of workers losing their jobs and facing diminished earnings prospects?””
The dominoes are falling, and it’s all being revealed in the data. We consider ourselves to be in VERY good company when the likes of Mike Green are aggressively pointing these things out.
Please exercise some patience, we’ve seen this story play out multiple times throughout our career; over confidence in the belief that we have the “all clear” in markets due to the price action in a few names that are holding up two broader indices. This can and often does lead to significant pain when the above-described liquidity games can no longer be played, and economic gravity becomes reality.
This ride has NOT come to a full and complete stop just yet, we suggest investors prepare accordingly!
Good Investing,

Mitchel C. Krause
Managing Principal & CCO

4141 Banks Stone Dr.
Raleigh, NC. 27603
phone: 919-249-9650
toll free: 844-300-7344
mitchel.krause@othersideam.com
Please click here for all disclosures.

