

In This Article

Spring is coming … it’s not what you think!
As we publish, we’re less than a month away from my favorite season of the year, Spring! Especially here in North Carolina!
When we moved to Raleigh nearly 11 years ago, one of the very first things I noticed while driving the highways were the meticulously manicured on/off ramps; what simplistic, yet breathtaking landscaping. Ironically, it wasn’t necessarily what was planted that caught my eye … but a combination of both what and more so, HOW the items were planted.
The more I admired the beauty of the scenery, it quickly became apparent as to why it stood out to me. The fields were planted using a method taught to me by one of the most highly respected individuals in the field of horticulture; I’m blessed to call him one of my dearest of friends … the approach is known as mono-sweeping.
A Google search of “mono-sweeping a landscape” will yield roughly 3.9 million results, my good friends article published on the subject in 2006 will likely be your first hit. As only Bob can explain:
“Mono-sweeping is an industry term used to describe the massing of a single plant material, in abundance, in one particular area. Far too often I am asked to select plants for a particular site and come up with as many different types as possible. This is not only confusing to me, but the customer is left not with a viable landscape, but merely a collection of plants. This type of mind set is fine if your goal is to present specimens in a museum-like atmosphere.
However, it lacks a certain rhythmic flow and cannot afford sweeping, elongated lines that envelope and captivate one’s attention simultaneously disarming and inviting them towards a destination without their knowledge. Landscape design should not be confusing, frustrating, or intimidating. You need only be cognizant of color, texture, and size. Repetition is a good thing.” Robert LaHoff, Halls Garden Center, Berkeley Heights, NJ
Simplicity often yields awe-inspiring results … try planting 400 “pedestrian” liriope monkey grasses together throughout your landscape and let me know what you think come mid-August?! A decision I made over planting a variety of the rarest specimens on top of each other; which would amount to a guaranteed muddled look, detracting from both their true beauty and your landscape within a few years.
Some of the most beautiful sites along my NC drives are enormous fields of the same trees, bushes, shrubs, grasses or flowers planted independently, and while the individual flower for example would look ‘ok’ planted amongst a bunch of different varieties of plant material, the impact of those flowers planted en-masse is just … WOW! That’s mono sweeping!
The manipulation of how things are viewed comes at the hands of those in control of the specific situation. In this case, the N.C. Department of Transportation’s roadside environmental unit aesthetics engineering division works diligently to develop, “harmony between the natural and man-made environments along North Carolina’s roadways” … and they do a brilliant job laying out or manipulating the plant material for optimal presentation. (We’d encourage you to click this link to view a representation of their work!)
As is often the case with many of life’s wonderous creations, how we manipulate things can be the difference between whether or not it’s stunningly beautiful or a hot mess … at the same time, it can also be the difference between something that’s both delicate and elegant or quite possibly, deadly.
Consider for a moment if those fields of daisies or sunflowers on North Carolina’s highways were filled with opium poppy?! By itself, an opium poppy flower is brilliant; when planted by a “farmer”, row upon row, field upon field, mile upon mile … in bloom, it’s one of the most gorgeous pictures I’ve ever seen.
Though, what was initially cultivated in Mesopotamia in 3,400 B.C. and referred to as Hul Gil, (translated as the “Joy Plant”) by the Sumerians, has created an abundance of heartache causing more damage to humanity than most wars!
The poppy plant, or Papaver somniferum, produces opium, which humans manipulate into powerful narcotics which include morphine, codeine, heroin, and oxycodone.
Given this scenario, the “deadly” part of this plant isn’t caused by its beauty, but again, by those who control, exploit, and play pernicious games with it.
While some may not choose to describe financial markets as “beautiful”, the initial mechanism which allowed businesses to raise capital in an orderly fashion, as shares exchanged hands in an instant was nothing short of impressive.
Though much like a landscape with no rhythmic flow or direction, or the opium poppy flower turned narcotic, the financial market’s simplistic beauty has been transformed from a useful tool to a highly complex and fragile system.
Today, markets are a shell of what they once were, much less a system used to raise capital while much more a medium designed to roll/refinance ungodly sums of global debts (>$300 trillion in aggregate), which becomes nearly impossible to do when facing a true economic cycle … especially when the cost of capital explodes higher in such a short period of time (as it has).
And while it does happen, it’s infrequent that data freefalls with no reprieve, which should have been a key takeaway from last month’s discussion regarding shorter-term “trade” vs. the longer-term “trend” durations:
Understanding the importance of trade vs. trend is extremely important! We utilize @Hedgeye research’s trade and trend methodology defining trade as 3 weeks or less and trend as 3 months or more.
Collectively, this creates mini cycles within a much larger cycle! This is the foundation of Hedgeye’s trade, trend, and tail models; be it company specific or a much larger macro cycle.
Wall street will have you believe that price action in equities or a single event; ala, a CPI report, hike in interest rates, release of retail sales data, et al., defines the beginning and end of a bull or bear market.
They point to the equivalent of a “collection of plants … in a museum-like atmosphere” pretending as if the market is static vs. dynamic, misrepresenting the purity of the data in an effort to drive their narrative rather than address a. the underlying integrity of said data and b. the entirety of global macro markets; the rhythmic flow of economic cycles and how they cohesively work together over a trade, trend, and tail basis.
As is the case with all of our notes, we’ll work through the current state of the data; how it intertwines with the current economic cycle and why it’s never been more important to be macro aware!
A collection of plants or cohesive landscape
You’ve heard us say it before, the data is the data … though at the same time, we’ve stressed the importance of understanding the dynamics of the data, not just the number being reported, but the inputs which drive these numbers.
Similarly, to our work in helping readers understand the different lead/lags in data like the CPI, there are defining moments when investing, where a more educated decision is required to help decide whether or not one should be participating with or fading the consensus crowd.
This month brought us what wall street considered a “hot” CPI inflation print with headline CPI “beating” wall street expectations earlier this month +0.5% MoM; up +6.4% YoY with Core (ex-food and energy) coming in at +0.4% MoM and up +5.6% YoY … and while minor, these “beats” continue to be mild decelerations from December’s +6.45% (headline) and +5.7% (core) YoY numbers, respectively.
With the exception of the “used car” component, which was down -11.9% YoY, ALL major sub-categories of the CPI were UP on a Year over Year basis.
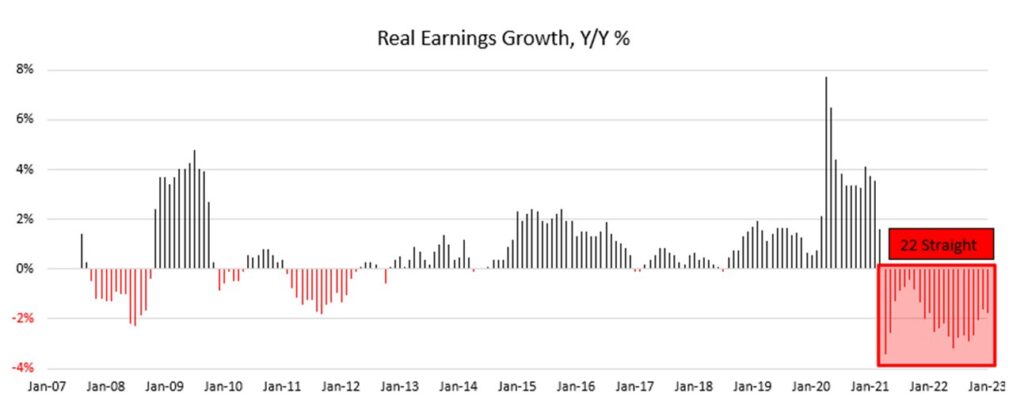
Suffice to say, inflation continues to remain “higher for longer”, while still decelerating … adversely impacting businesses on down to the consumer as real earnings growth registering it’s 22nd consecutive month of negative real earnings growth … Graphic courtesy @KeithMcCollough
Which makes the wall street cheering of this month’s Retail Sales “beat” that much more insincere.
January Retail Sales did come in “stronger than expected” in at +3.0% MoM; +6.4% YoY (which admittedly is an acceleration), however, if they took a minute to actually understand the number rather than just point to it, clapping like a trained seal, they’d be hard pressed to miss that it comes at the hands of:
- comping against the Omicron variant (when NO ONE was out shopping)
- the recent COLA adjustment higher for 50 million struggling Americans
- a significant increase in food services of +7.2% MoM; 25.2% YoY (INFLATIONARY)
- a sequential increase in autos; up +6.4% MoM (INFLATIONARY)
Beating a weak, transitory comparison makes this more of a trade vs. new positive trend, in the face of continued acceleration in both food service and autos, which are both inflationary and bearish, supporting our longer-term thesis that the Fed will be forced to maintain a tighter policy stance for longer.
A hawkish Federal Reserve prolongs our current higher cost of capital regime which increases the probability of a significant credit event with each passing day … full stop!
And as much as wall street would like you to believe this is new news, it’s not! Long time readers should recall our words from November 2022, reminding readers what we wrote as far back as May 2022:
“Back in May we discussed both companies’ earnings reports highlighting the adjustments U.S. consumers had made to their spending habits … in regard to $WMT we wrote:
- Grocery was up low double digits (necessity)
- Health and Wellness was up high single digits (important items)
- General Merchandise was DOWN low DOUBLE DIGITS (discretionary – NOT NECESSARY)”
We were specific in highlighting the change in the dynamics of the consumer’s spending pattern … a trend which continues. Earlier last week our friend $WMT “beat” (already reduced estimates), while at the same time guiding 1Q2023 data DOWN with “general merchandise” continuing to be an albatross around Walmart’s neck, & “grocery”, up; as inflation in necessities continue to squeeze the consumer, imagine that!
The good news is they provided an updated guidance for comps to decelerate from +8% to +2 (a significant deceleration). I do sincerely apologize for the increased sarcasm, but at this point, there have been very few times in my career where the Wall Street narrative has diverged so far from the economic data, and earnings recession reality; its comical if nothing else. Consider corporate earnings are currently DOWN -15.1% as wall street consensus forward estimates remain a mere 6% below all-time highs. They can’t be considered serious anymore.
On the very same day Walmart made their announcement, Home Depot ($HD) comped down -0.3% … which ordinarily wouldn’t be a big deal … but when you go 12 years without a negative comp, with a noose currently wrapped around the consumer’s neck, it’s without question, noteworthy.
While we’re on the subject … let’s talk housing!
Similarly, to last month, we did see another bounce in the February NAHB/Wells Fargo Housing Market index in the US, which accelerated 7 points from 35 to 42 … from the release:
“The gauge for current sales conditions rose to 46 from 40, sales expectations in the next six months went up to 48 from 37, and traffic of prospective buyers edged 6 points higher to 29.” (Insert golf clap here)
Let’s put things into perspective … the data is literally just back to September levels as Real Estate was in an absolute free fall … again, nothing free falls forever! With this in mind, the current sales condition reading of 46 is the third worst number over the last 37 YEARS! Third only to previous two prints … so again, are we looking at a short-term knee jerk or has the trending data (longer term) changed?!
In order to answer this question, we’d have to couple some forward thinking & an understanding of the data with more data. First, the improvement comes on the heels of mortgage ratesmildly improving; since when?! … last October (when the data started to marginally improve)! Can anyone remind me what Housing is most sensitive to??! Say it with me folks, mortgage rates (we’ve previously discussed this dynamic ad nauseum).
Keeping this in mind, as noted above, the most recent CPI print and all major subcomponents (ex-used cars) accelerate YoY, which immediately sent the yield curve higher with consensus finally beginning to digest what we’ve been telling you for a year … that the Federal Reserve is likely to be tighter, with a higher rate policy for MUCH longer than the system can stomach.
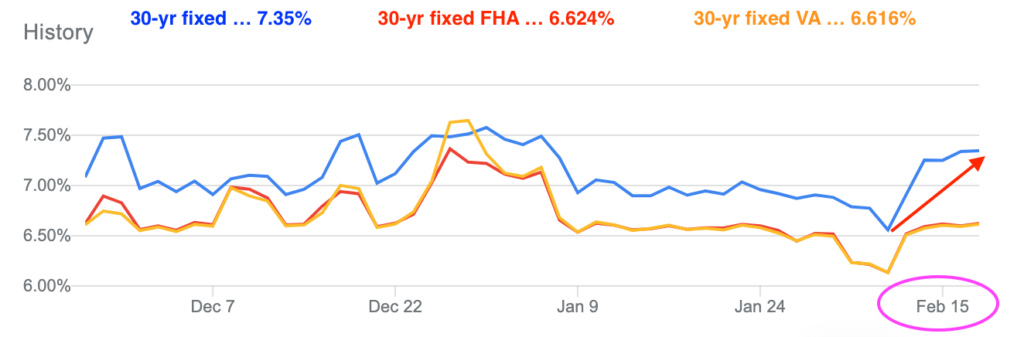
Mortgage rates hockey sticked higher, back to YTD highs … which again, drives housing! The 30-year mortgage jumped nearly a full point in a week.
Given the move in rates, MBA weekly mortgage applications were DOWN -5.8% WoW; with refinancing’s also down an eyewatering -14.3% WoW. This should have surprised no one … now remember “mortgage applications” are “forward looking”.
Additionally, U.S. January Existing Home Sales decelerated to 4.0MM, from 4.1MM which is a -37% YoY decline … a 12 year LOW and Mortgage Purchase Apps just printed -18.1% WoW; down 41.3% YoY! As Hedgeye Macro Team member Christian Drake reminds us … this takes “the index to its worst level in 28 years at 147.1.”
Most recent Case-Shiller and FHFA home price data also declined -0.8% and -0.1% MoM respectively, though both still being up YoY … at the same time, this data is from November, when rates were falling, they’ve now spiked back to YTD highs.
Home buyer traffic is an unmitigated disaster, so are pending home sales, CNI lending, the Sr. loan officer’s surveys … credit is tightening; regardless of what one or two data points you attempt to cherry pick, the data, as a collective, is not getting better!
This chop in data is most likely to continue in the short term while maintaining the longer-term trend unless we see prolonged low rates or ungodly sums of money thrown from helicopters … which is what will more than likely be needed to maintain any form of sustainable rally in housing.
Given the inflation data being nowhere close to the Fed’s 2% mandate, this higher cost of capital environment will likely cripple those who continually attempt to shift focus from one random data point to another … again view your broader landscape as a collective, with a “certain rhythmic flow” not one or two “special” trees!
Consensus
With this in mind, lets circle back to something we said earlier:
“…there are defining moments when investing, where a more educated decision is required to help decide whether or not one should be participating with or fading the consensus crowd.”
Following last week’s most recent economic data and subsequent market action, consider this thought brought to you by Hedgeye CEO Keith McCullough:
“2 Weeks Ago: Consensus = “Soft-landing”, 1 rate hike left then 2 cuts … Now: Consensus = No-landing, ~4 rate hikes, 0 Cuts, a potential 50bps hike in March and whispers of a 6% Terminal Rate The more you chase consensus/tourist narratives, the faster they run…”
In roughly a week, consensus (i.e., the crowd) shifted 180° (for now) to match their positioning with what we’ve been preaching … the difference is we haven’t deviated from the simplicity of the data from the onset, while wall street chases the daily manufactured narratives, they are forced to push out of necessity given their improper positioning.
While risk managing price action is important, the underlying data gives us confidence in our thesis and positioning regardless of consensus. We’ll go along with consensus when the data tells us to; but at the same time, it’s the data, not price action that is our north star guiding us along the way in an effort to protect and risk manage our capital according.
The irony is … you’ll continually hear wall street talking heads say the markets are forward discounting mechanism … as they tout old, stale data with zero forward vision?!
High on Opium
The data suggests the collective of Treasury Secretary Yellen, Fed Chair Powell and the majority of Wall Street are all taking turns hitting some form of a manipulated opium poppy flower … for regardless of what they are trying to sell you, the consumer is in abysmal shape.
In the essence of time … the personal savings rate has crashed, bank deposits QoQ are decelerating at an exponential pace, and we’ve recently seen a 24%+ increase in individuals prematurely pulling money out of retirement accounts over the last year … as credit card balances grew at their fastest pace in 20 years and interest rates on these cards have reached multi-decade highs!
Credit card delinquency rates are spiking across ALL major lenders, sub-prime auto loan defaults continue to hit all-time highs … as the percent of individuals earning more than $100k living paycheck to paycheck has increased to over 50.8%; this should all sound familiar to our readers!
In our December note we also mentioned luxury goods consumption was cratering, which continues to be the case as recently confirmed by Luxury retailer SAKS Fifth Avenue CEO, Marc Metrick recently stated:
“What we’re starting to see is a deceleration of the aberrational growth we experienced in the last few years, and I think we have to prepare ourselves for that to be a new reality.” h/t: @HedgeyeRetail Brian McGough 02/24/23
Saks is about as “luxury/high end” as it gets in retail and when combined with the aforementioned data on both the consumer and housing, it should surprise no one that luxury home sales are currently down over -38.1% YoY.
So, remind me how strong the US consumer is? Hold that thought … we’re not finished!
From the Prudential Pulse Survey
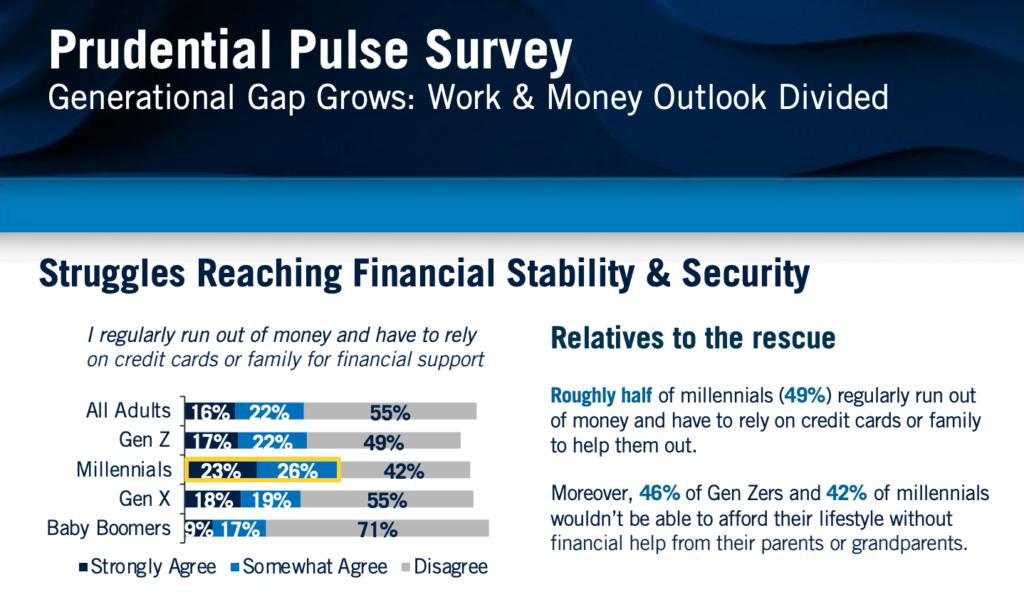
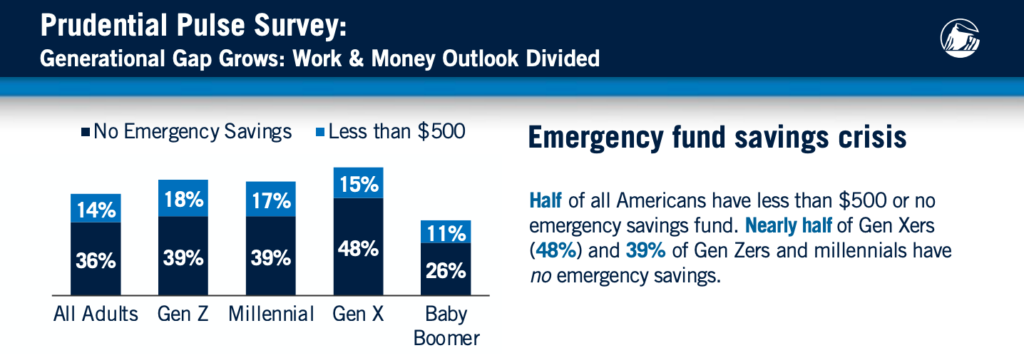
The negative wealth effect = net worth down → consumers spend less … it’s not rocket science folks!
But, don’t look now, it’s time to rejoice!
Home Depot ($HD) just announced they will now be paying every hourly employee $15 per hour in all markets they serve. $HD operates 2,000 stores in the U.S and 182 in Canada, employing 437k and 37k respectively; this will cost the company billions of dollars … as we just told you above that they reported their first NEGATIVE same store sales comp (miss) in 12 years!
At this point, we believe it would be extremely difficult to find a single reader who does NOT think this won’t further compress their margins! Nominal higher income for some, unfortunately, pink slips await many more!
Labor
Unless today is your first read, we’ve not only been screaming that Labor is the latest of late-stage cycle indicators, but we’ve done our best to simplify the why … leading us to a story closer to home than we’d like; but pretty much nails the point we’ve been attempting to make for the last few month re: labor!
A very close friend was recently fired from one of the more well-known global tech behemoths. He received his notice ~ February 2nd … but he’s been given until May 2nd to work on “finding a new job” (internal or external) while he transitions his current workload. On May 2nd, assuming he hasn’t found a new position, his severance package will pay him for 9 months.
If you do the simple math … it could very well take more than a year before my friend finds himself in any “unemployment data” … though at the same time, I can guarantee you he’s already being prudent pulling back on spending, which is large in part why we’re seeing a #RoC #slowdown in spending but the unemployment data hasn’t adversely shifted just yet.
The most recent “strong” NFP (Non-Farm payroll) print is consistent with past recessions, be it the mid 70’s, early 90’s early 2000 and 2007 … robust labor prints have always preceded recession, for most businesses overzealously hire without seeing the recession coming; they never hear the music stop until it’s too late! Why?! Multiple reasons, but we’ll give you the two most important we’ve discussed before:
- Very few have a forward-looking macro approach, they NEVER see the slowdown coming (this includes the largest companies in the world as we’ve previously highlighted ($MSFT, $GOOGL, $WMT, $META, etc.) throughout 2022
- Incentives!
Unfortunately for them, based upon THE DATA, Powell will continue hiking rates into the fastest part of the growth and Inflation deceleration just as the past year’s layoffs begin to register in the data … and at the same time, he’s already acknowledged the Fed is willing to see unemployment data tick higher.
That he’s willing to do the “unpopular” thing as we note below … to revive our avalanche analogy, they won’t know they’re about to be buried under 10 feet of snow until they’ve already been buried.
It’s ok, we’ve only been writing about this dynamic since LAST APRIL … patiently noting cycles take time!
Speaking of Powell
Current GDP projections from the Atlanta Fed is currently at 2.7% … our belief, given the data and how it flows through Hedgeye’s NowCast model has growth headed to negative -2.00% for 1Q2023 and likely worse for 2Q2023, on a QoQ SAAR basis, as the data decelerates at a faster pace.
As the data stands, it is our belief that we’re about to witness one of the largest sequential decelerations in growth … EVER! And before you think that statement is an exaggeration, we ask you consider this:
Do you remember when the Federal Reserve, Washington politicians, financial media pundits and the vast majority of Wall Street suggesting inflation would be “Transitory”?! During that timeframe, you may recollect we were screaming inflation will be higher for longer?!
When we told you we had flipped our positioning to a disinflationary investing regime (January 2022), doing so before markets crashed and over 6 months before Wall Street cheered because they finally saw inflation headline number peak (while had they understood the dynamics of the CPI and broader macro-economic signals, they would have known markets had already warned the world about global disinflation in January 2022 sending specific asset prices down in a blink; which is in line with what we’d been saying from September 2021?!)
The sad reality is while price stability is something we should strive for; most don’t understand the pain true disinflation/deflation will cause.
This is MUCH LESS a “we told you so” moment but MORE an understanding that how most read or interpret the data is typically, at minimum, 6 months or more behind.
It is IMPERITIVE that you to remember this as you continue to hear the current “soft landing” narrative pushed!
There will be no soft landing … and the data suggests we’re about to bear witness to one of the largest crash landings, EVER … and ever is a long time!
Due to the lead/lags in CPI calculation, there is still another month or so of challenging comps before things start to roll over at a faster pace. And while there are bound to be knee jerk reactions in equities, unfortunately for those hoping for a Federal Reserve “pivot” on interest rate policy … 1Q2023, in aggregate, is likely to remain in the HIGH 5% range (5.75% – 5.95%), with Q2, Q3 & Q4 remaining persistently annoying in the high 4’s; STILL DOUBLE the Fed’s 2% target with a resolute Powell, constantly repeating:
“I continue to think that it’s very difficult to manage the risk of doing too little and finding out in 6 or 12 months that we actually were close but didn’t get the job done.” Jay Powell, 2/1/23 transcript; page 7
Earlier this January, he also stated:
“Restoring price stability when inflation is high can require measures that are not popular in the short term as we raise interest rates to slow the economy.”
Noting the importance of not giving into the pressure or succumbing to the need to be liked!
If Home Depot’s same store sales comps are negative with GDP still positive, what do you think happens with mortgage rates higher for longer while facing sequential quarters of negative GDP?!
Better yet, wall street’s current consensus earnings estimates for the remainder of the year is all of 6% below their peak, ALL TIME HIGH numbers, while at the same time, S&P 500 earnings are currently down -15.1% this quarter alone. Given all the data that we’ve currently presented:
- Where in the name of all that’s holy do they believe the growth will come from?!
- What do you think really happens to earnings with 0% YoY GDP and sequential negative 2.00% quarters?!
Liquidity
But, but, but … the Nasdaq had its best start since 2001 and Janet Yellen just said, “the economy is strong and resilient” … “you don’t have a recession when you have the lowest unemployment rate in 53 years” AND a slight paraphrase, but … she’s confident that the U.S. will find a path where inflation declines significantly, with the economy remaining strong!
She’s also the same person who, while head of the San Francisco Fed, attempted to extend IndyMac a significant loan the same day the OTS was shutting them down. Then also said that she didn’t believe, “there would be another financial crisis in her lifetime” (palm meet forehead). I could go on for days discussing the idiocy that’s come out of this woman’s mouth over the years, though, my point is to know your source!
Without question, Yellen is doing her absolute best to dress up the proverbial pig, as many would argue her act of “cashing up” is largely what attributed to the initial strength in financial markets to start the year. “Cashing up,” in its most simplistic form, is drawing down or “borrowing” capital from other sources … like the TGA (Treasuries General Account).
In late December through January, she borrowed to the tune of over $600 billion dollars as she began exercising “emergency measures” to fund the countries liabilities as Washington engages in yet another debt ceiling debate, slated to come to a head in June.
This excess liquidity injected into the system largely offset the Federal Reserve’s QT (Quantitative Tightening) efforts in the most recent 7 to 8 weeks; conveniently coinciding with the most recent “bear market rally”. It also corresponded with large liquidity injections from the PBOC (People’s Bank of China) and the BOJ (Bank of Japan).
While global central bank liquidity had expanded, this dynamic has begun to reverse itself as we’ve just seen a significant drop in global Central Bank liquidity led by a WoW decline of $127 billion from the ECB, followed by the Fed -$50.6 billion and the BoJ’s -$46.6 billion. Charts courtesy of Gordon Johnson of GLJ research
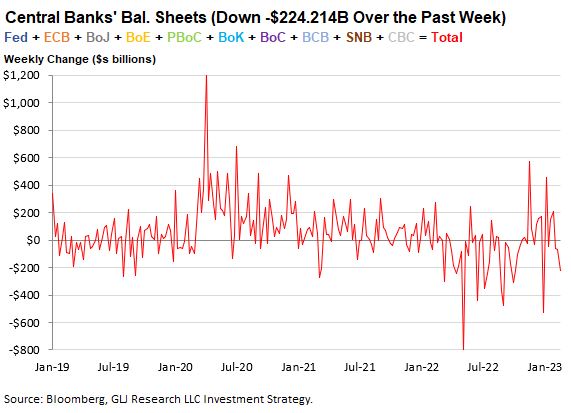
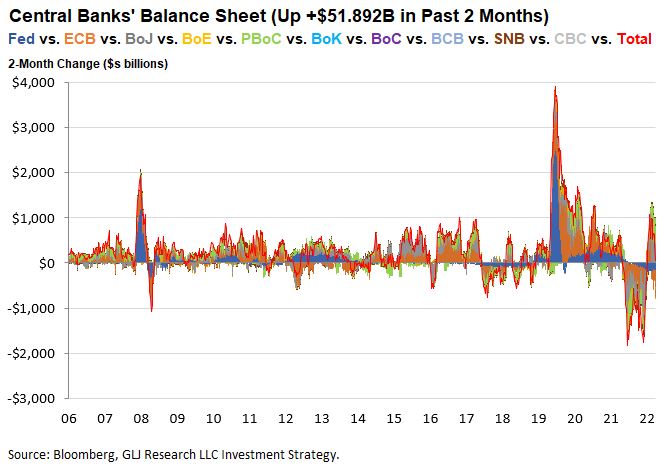
Per Johnson: “this is QUITE bad for stocks. In fact, when looking at the 2-month net change in global central bank liquidity, the +$52B 2-month change this week collapsed from last week’s +$435B change – i.e., liquidity is being taken out of the system at an ALARMING rate.”
We won’t argue…
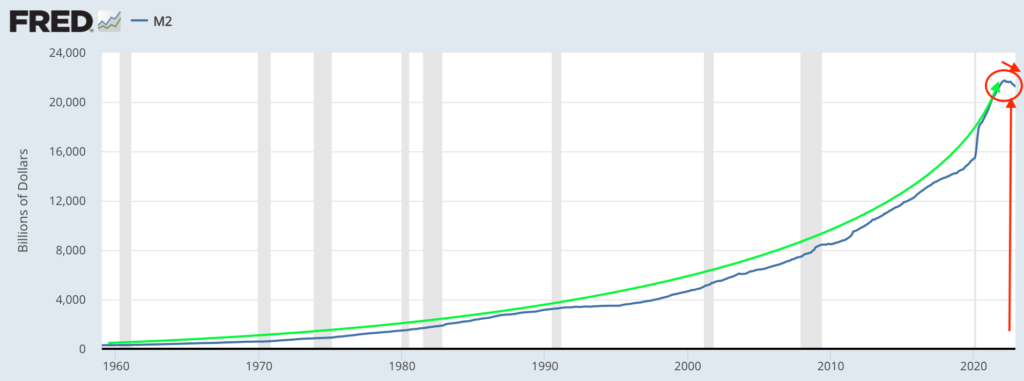
This is taking place at the same time M2 (money supply) is contracting. As you can see from the graphic on our right courtesy of Hedgeye Director of Research Daryl Jones …
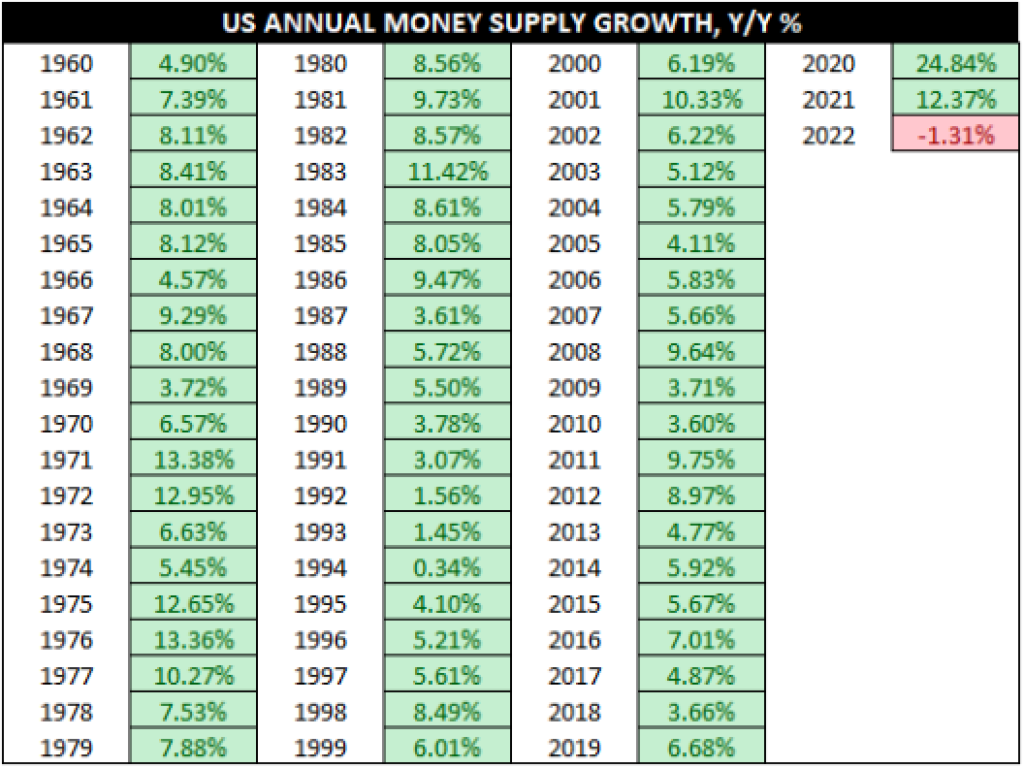
M2 went negative for the first time in over 60 years on a YoY basis in 2022!
Please note: the M2 growth on a YoY basis during the tenure of Federal Reserve Chairman Volker (1979 – 1987); a far cry from today’s -1.31%!
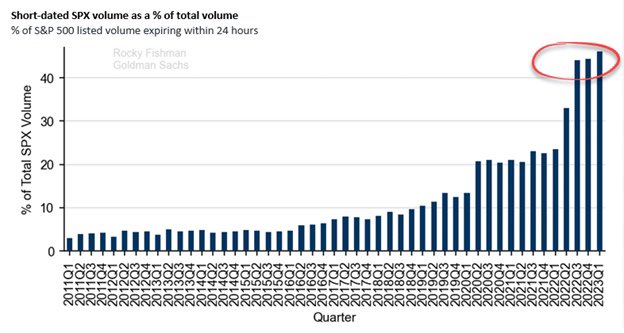
We are in the midst of a liquidity crisis. Underlying liquidity in individual stocks is anemic which is a large contributor to the rise of the 0DTE options we wrote about last month. If the liquidity doesn’t exist in the underlying name, it goes to the derivative which drives flow.
The lack of liquidity can be seen in the blow ups we’ve been noting for months now; including but not limited to private real estate funds like BREIT, SREIT & KKR freezing redemptions and the rise of 0DTE options trading.
Per Rocky Fishman of Goldman Sachs, the percentage of S&P 500 options expiring in less than 24 hours is now roughly 45% of total volume: with the largest volume of options being purchase EVER occurring on February 2nd, 2023 (the most recent peak of the latest bear market rally) with 48 million contracts printing!
One important thing to mention regarding 0DTE options. Last month we stated the below:
“While we won’t speculate on who’s doing the manipulation, eventually, buyers become exhausted and gravity sets in, especially as this current earnings recession forces more selling volume, increasing the amount of capital necessary to perpetuate this trade.”
What we’ve seen in the last week is not only what we mentioned here; exhausted buyers, gravity setting in, current earnings recession forcing more selling, thus an increase in volume … but more importantly, 0DTE options worth BOTH WAYS as speculators focused heavily on buying PUTS last week as the market cratered.
What we also saw was outright manipulation as well as last Thursday one of the largest 0DTE option trades printed, “shocking” even Goldman Sachs’s “options/flow” specialist, Scott Rubner, when 26,000 2/23/23 4,000 strike put options on S&P e-mini futures traded at 10:40am … as reported by @ZeroHedge quoting Rubner.
Remember, Goldman Sachs is one of the three largest options dealers, they see it all … so, it would likely take a unicorn trade to shock their specialist. From the article:
The strike notional was $5.2 Billion, and the premium paid $5.5M. There was $2B worth of delta selling as a result of the hedge, 40% delta.
As Rubner summarizes:
- “This trade has an institutional footprint, and was too large for “retail traders”
- “This is the largest 0DTE block trade that I have ever seen. I need to run the data, but this may be the largest block 0DTE ever (or at least top 5). I track this every single day, and I have to admit that I was shocked watching the short gamma hedging impact on the market.”
- “Do you think institutional investors will begin using 0DTE’s in size to hedge specific daily macro events”? My reply is yes.
- “Can the market handle institutional (not retail) flow in 0DTE’s market impact if this becomes, a thing”? My reply is no.
So, $5.5 million dollars in option premium, literally bullied TRILLIONS in equity market cap via billions in delta hedging … sounds safe to me! (insert holy poop eye popping emoji here)
Ironically, to Rubner’s final two points, as I type in final edits, another unicorn just printed; 24,900 e-minis sold taking SPY futures down on $4.9B notional at 10:47:18AM … making this 2 unicorn trades in nearly as many days.
As my close friend and industry veteran @x2da4 (who prefers personal anonymity which we’ll 1000% respect) recently said:
“It’s NOT a stock market at this point. It’s an options market with a stock market wrapper” … and most have no clue!
This is NOT the stock market you grew up in; it is MUCH more explosive and dangerous than most understand. This options volatility is something industry veterans like myself have NEVER seen, because they’ve never occurred over the course of nearly 3 decades.
Those pulling the strings have manipulated these markets via regulation, fiscal stimulus from central bank intervention, monetary stimulus from governments et. al., which have turned the beauty of the exchanges into a mechanism that’s converting both human’s and machines into opium/heroine addicted junkies.
Still, while excess liquidity, at the hands of global central banks without question influences flow and market directionality, unless it’s absolutely enormous, it’s highly unlikely to alter the longer-term outcome of this economic cycle.
With each passing crisis the bailouts required to “save” the system have needed to be exponentially larger with multiple “red lines” being crossed as the fed doesn’t have certain legal authorization to act. The Covid “pandemic relief” exceeded $7 trillion in both monetary and fiscal stimulus in the U.S. alone.
Over the years, we’ve written quite extensively about how the financial system functions through a constant rolling/refinancing of debt … from the consumer to corporations and governments. It’s this dynamic that will make this cycle all that much worse when the real unwind happens, as cheap capital is no longer accessible making it nearly impossible to extend and pretend; the economics just don’t work.
Michael Howell is a managing director at Crossborder Capital and author of ‘Capital Wars: The Rise of Global Liquidity’, He recently penned an article in the FT (Financial Times) suggesting 2023 shouldn’t be “so bad for assets, because the cycle of global liquidity is bottoming out” … being of the belief that we’ve “just passed the point of maximum [global central bank] tightness.”
We largely agree with quite a bit of what Howell’s written throughout his piece, having discussed similar dynamics for years; though we believe his conclusion of, “stealth QE may be back next (this) year and make what looks to be a difficult year feel a tad better”, to possibly be pre-mature.
As you can read in his article, his argument boils down to:
“… markets no longer serve as pure capital-raising mechanisms. Rather they are capital refinancing systems, largely dedicated to rolling over our staggering global debts of well over $300tn” … which:
“puts a premium on understanding collective balance sheet capacity to finance debt issues over analysis of the cost of capital … and:
for every dollar raised in new finance, seven dollars of existing debts need to be rolled each year. Re-financing crises hit us more and more regularly. Hence, the importance of liquidity.
So … “The very act of quantitative tightening creates systemic risks that demand more QE”
AGAIN, we agree with and have written extensively on all of the above; liquidity is imperative to a properly functioning global system, that “as soon as policymakers hit the brakes in early 2022 and triggered a near-$10tn liquidity drop, asset markets collapsed” … he’s crystal clear and right.
While he and I have never spoken, where we differ with the specific argument, he’s laid out in a very well written piece is where he believes; because QT will crack the global financial system, Central banks will stop.
Our thesis regarding Central Banks have pretty much been … they are ALWAYS behind the curve, and the Rate of Change increase of the cost of capital on the global economy (which is falling off a cliff) has already reached unsustainable levels … and at least here in the states, they are handcuffed without Congressional approval which could take time. All of which we’ve written about extensively for some time now.
Net net, this means it’s much more likely for us to see systemic risk before perceived relief.
Howell admits central banks have been reducing their balance sheets, countering Gordon Johnson’s above point with:
the Fed has reduced its holdings of US Treasuries in seven of the past nine weeks as part of QT. But net liquidity provision, benchmarked by moves in the Fed’s “effective” balance sheet, has remarkably risen in six of these weeks. In fact, the Fed added an impressive $157bn to US money markets through its operations.
Ok … let’s assume he’s right for the moment … at the end of the day, what are we really talking about here?! A few hundred billion from central banks here and there … vs. $170/180 Trillion global liquidity pool and $300 TRILLION in global debts that needs to be rolled/repriced over time … at interest rates hundreds of percent higher from where they’ve been in roughly a DECADE and a half?!
And on the other side of that more expensive refinanced debt and exponentially increased interest payments are what?! Tax receipts backed by a slowing consumer who is spending more and receiving less on every purchase they make due to inflationary pressures? And what happens when copious amounts of debt can’t be refinanced?!
Religious readers know we’ve been talking about the disconnect between sub-prime auto loan delinquencies being at all-time highs in the face of the unemployment data being at 50-year lows … last month most recently:
“THE UNEMPLOYMENT RATE PRINTED A FRESH 50-YEAR LOW AT 3.5%” and yet, today we’re experiencing, “THE HIGHEST DELINQENCY RATE ON RECORD”; now, square that circle!
Well, just last week, American Car Center, a 50-store subprime dealer group, just went bankrupt after pulling a $220 million dollar bond sale from the market … the company has more than 40 dealerships across 10 states. ACC is owned by York Capital Management LLC.
While all bankruptcies are unfortunate, the “why” behind this specific one is extremely pertinent and recently explained brilliantly by one of the best credit follows on twitter @Stimpyz1
American Car Center is not failing as a “used car dealership.” They cannot access funding in the ABS markets that re-cycle their capital like your heart recycles your blood … They are simply the latest SP (Sub Prime) issuer to find markets closed.
Like I said, it isn’t idiosyncratic. SP Auto AB# all-in spreads are +275-300. Over a 5% benchmark your cost of funds is 8%–PRE LOSSES to the residual or equity. You need good credits borrowing at 9% to drive the math. The one’s you want don’t need the money.
What he’s saying in plain English for those who are having trouble following along is the cost of capital is too expensive for the business model to work … which is exactly what we’ve been telling you for years now, though shared this quote from Hedgeye Communications sector head Andrew Friedman in September 2022:
“The fundamental problem here is that you have entire business models and capital structures that have been built up over the past decade that were just based off of zero percent or very low levels of interest rates and now with rates and spreads where they are, and continue to go, the math just doesn’t work.” Andrew Friedman @Hedgeyecomm “The call” 9/27/2022
Talk on the street suggests the IG (Investment Grade) tranche of the ABS deal was well subscribed, but no one wanted to touch the Sub Prime tranches. Which should make your mind immediately start to think about how much junk and BBB paper that’s borderline junk there is out there that needs to be refinanced and you’ll understand why we’re short credit exposure.
But this couldn’t possibly be why we’ve been seeing a hockey stick in bankruptcies as they are exploding to the upside, could it?! As can be visualized in the graphic (below) provided courtesy of Quill Intelligence CEO Danielle DiMartino Booth
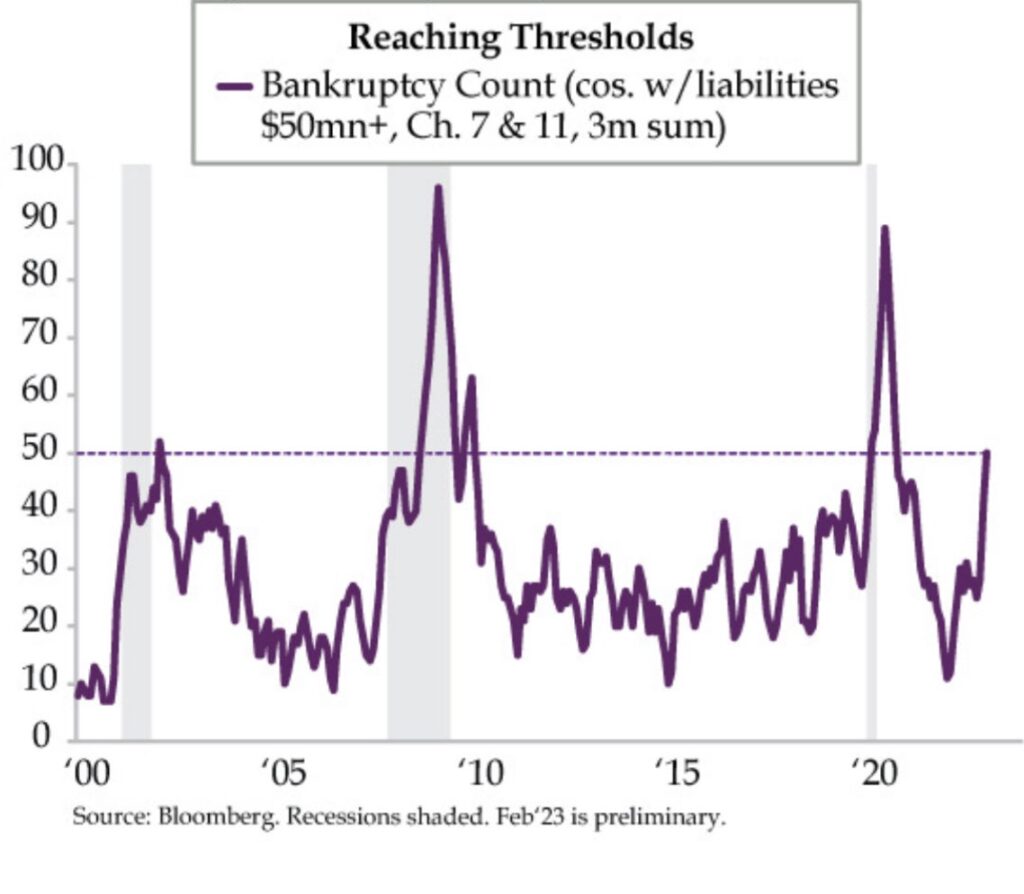
You should be noticing the rise in bankruptcies coincides with previous recessions (which are represented in the below image by the grey shaded areas).
It’s no coincidence that these recessions have also coincided with major market downturns … we’re literally watching a business cycle unfold before our eyes; and you should be questioning the integrity or intelligence of anyone who suggest “this time is different!”
We are a society drowning in debt; as the cost of capital rises, margins compress, banks and lenders tighten lending standards and refinancing become a losing proposition, which = bankruptcies!
Over the next handful of months Washington politicians will be tasked with addressing the debt ceiling … and should they do so, increasing the debt ceiling with the stroke of their wand, borrowing trillions more … do you really think that will fix anything?! Seriously though?! It’s not as if we don’t know what Japan looks like!
We’ve written about debtor nations, citing Doctor Lacy Hunt, PhD., and his work on David Hume many times. We’ve also cited Hume’s paper titled “Of Public Credit”, written in 1752; crediting Hunt quoting Hume on the subject:
“… when a state has mortgaged all of its future revenues, the state by necessity lapses into tranquility, languor, and impotence.”
Hunt continued:
“And today, we know that it triggers diminishing returns and an insufficiency of saving to generate physical investment.”
… this will NOT end well!
$$$
Before moving on, let us remember one more thing. The vast majority of this global debt we’ve been speaking of is denominated in U.S. dollars?! Which, even when considering the most recent 3-month consolidation, is still higher vs. virtually every other global currency over the last year.
This poses a much larger problem for those countries that need to sell their currency (creating downward pressure) to purchase dollars in order to not default on their debt as their debt payments need to be paid in U.S. dollars (generating upward pressure). This creates a vicious cycle, driving more demand for the USD pushing it even higher, while creating a death spiral doom loop on the majority of sovereign currencies.
Making this very recent move in the dollar, increasing nearly 4% over the past 3 weeks and bouncing off of @Hedgeye’s long term tail levels, troubling for all of global macro.
It is our opinion that as right as Howell is with much of what he’s written, that ultimately, an emergency crisis is needed before central banks can just pump the system full of money again.
So yeah, Yellen cashed up, the BoJ intervened … so did the PBOC; but at the end of the day in the grand scheme of all things global macro (debt, credit, leverage, liquidity, etc.), it all amounts to some spit, bubble gum and duct tape holding up the entire Manhattan subway system … good luck with that!
We’ve cited Hedgeye CEO Keith McCullough before with these remarks, “risk happens slowly, and then all at once” … with last week being no exception; we continue to believe the data supports buckling up and strapping in for a while longer.
Human nature
“It ain’t what you don’t know that gets you into trouble. It’s what you know for sure that just ain’t so.” ~ Mark Twain
I met my friend Bob in my mid-20’s.
After what took nearly 2 years of physically building my own home (while growing my first book of business in this industry), it was time for landscaping. I had framed all but my roof line, installed most of my electrical, plumbing, and hot water baseboard heat among countless other things; none of which I knew how to do before I took a deep dive researching and asking countless professionals a plethora of questions.
I was so meticulous with my electrical work that the inspectors didn’t believe that I had done it … it was the cleanest job they had seen in their 12+ years of inspecting. Ironically, the Wake County, NC inspector said the same thing after I did the electrical for my current office … if I’m going to do something, I’m going to do it to the highest standard possible and make every effort to turn over every stone to ensure it’s as accurate as possible!
The word Shoshin sits on our website philosophy page; it’s a word used in Zen Buddhism meaning “beginners mind”. It describes an attitude of openness, eagerness and lack of preconception when studying a subject, even when studying at an advanced level.
In not knowing what I didn’t know, I tried my hardest to unearth all that I could when speaking with as many “professionals” as I did when building my NJ home. The more questions I asked, the easier it became to figure out who is full of **it, vs. those who had a firm understanding of their craft.
When I walked into Hall’s Garden Center in Berkeley Heights, NJ for my “plants”, I began asking this stranger as many questions as I could think of … and while I’d have to ask Bob, I think it was this inquisitive nature that initially sparked our friendship?! Though, I digress…
Bob’s approach was completely different from what I had experienced at every other garden center previously visited. He didn’t talk “at” me but took an educational approach … you could tell he was special, that he knew his profession inside and out, that he focused on the details and took pride in his craft.
I made countless visits before purchasing any plants, absorbing as much as Bob was willing to give; he exercised patience, and a willingness to pass along his passion. I also found that there were so many questions I could never have imagined asking, but most were addressed when Bob discussed his process. My friend is the definition of professional!
I aspire to emulate many of my friend’s traits every day in both my personal and professional lives. At the same time, we fully understand this style isn’t for everybody. Be it horticulture or finance, Bob and I encounter similar human emotions daily.
There will always be those who don’t know or could care less as to why the variety of plant grown at Iseli nursery is a higher quality than something sold at Home Depot, focusing merely on price. It’s most often the same reason as to why the vast majority of landscapes throughout neighborhoods look more like an overgrown collection of plants vs. a beautifully flowing, cohesive mono-swept garden … and that reason is: Human Nature!
“It is impossible for a man to learn what he thinks he already knows.” — Epictetus
Final Thoughts
The parallels in our profession are very similar as there will always be those individuals who believe they already know it all. They fail to approach most things life with a Shoshin or open-minded approach believing, “it’s how I’ve always done it and it will always work this way,” dismissing the changes to structural dynamics!
Investors often look to large wire house firms and certain managers paraded around financial news networks, believing them to be superior for (insert reason here) their name, size, assets, popularity, etc. … and yet those are most often the firms and managers who fail to risk manage and protect investor’s assets when it’s needed the most.
I’m old enough to remember the largest wall street firms not being able to manage their own internal risk properly leading to outright failures and fire sales during the 2008/2009 crisis. Merrill Lynch didn’t want to sell themselves to Bank of America, they had to in order to remain alive … and yet, people take solace in having them managing their money. (Insert eye roll)
If you really listen to these analysts or market strategists employed by these large, bulge bracket firms, ask yourself … are they ever bearish?! Like, EVER?!
In our experience, the only times these analysts/strategist go bearish is after the carnage has already been done (thanks for coming out). These firms are also, most frequently the ones pointing to knee jerk price action in markets or “one off “, “better than expected” data point to validate their investment decisions or thesis vs. using the full body of data to support their claims.
Incentives in this industry dictate these firms only “know what they know” refusing to allow, acknowledge or understand that a better way from what they, “know for sure that just ain’t so”, exists.
Could you imagine if the largest of firms told you disinflation/deflation was upon us in January 2022 and their recommendations were to SELL equities?! It was the right call NONE of them made, but they were sure to ridicule and belittle the fringe minority of us who educated their investors on why it was the proper decision to have made.
Sadly, their advice to clients had nothing to do with risk management, leading most of their investors to losses well in excess of 25% to 35%, many losing substantially more.
Today, these same people who were wrong with “transitory”, “inflation”, “disinflation”, “strong economy”, “resilient consumer”, “hot labor market”, etc. are the same people pointing to the Nasdaq price action in January and its best start since 2001 as reason for you to believe that a “soft landing” is possible.
Without question, the Nasdaq did have a great start in 2001, but for those with short memories, that year ended very, very badly for most investors! While the final outcome of 2023 is yet to be decided we’ll continue to side with the data and business cycle.
As noted above, central banks will need a crisis to respond to before they create their next inflation boondoggle with copious rounds of QE, helicopter money, global digital currency, or whatever bat sh*t crazy solution they come up with to temporarily fix what their manipulation over the years, has destroyed.
And when they respond with force, depending on the data (and assuming the world hasn’t ended, counterparty risk is contained, etc.), we’ll most likely go hand over fist bullish, but we’ll more than likely be doing so from a position of power, having lost either much less … with our goal to have fully preserved and gained! Cycles take time, and as we’ve noted before, patience is an asset class!
From the onset of opening our doors, we have always told you what we would want to hear if we were sitting on the other side of the table. It’s not always going to be good news, and we are by no means perfect. But when this is all over, we’ll have done our best to preserve and protect as much of our capital as possible based upon the directionality of the data and our understanding of economic cycles while keeping historical reference and perspective in mind.
We frequently write, “don’t take our word for it, the data is the data” … and while we do attempt to make all efforts to educate our readers on how to properly interpret it based upon inputs, mechanics, and the current economic cycles, still, it’s the data that will drive our decisions, not short-term price action, nor emotion.
Spring is definitely coming, the landscapes of North Carolina are about to be beautiful with color, but RED is the most probabilistic outcome for markets as the data continues to scream bearish!
Good Investing,

Mitchel C. Krause
Managing Principal & CCO

4141 Banks Stone Dr.
Raleigh, NC. 27603
phone: 919-249-9650
toll free: 844-300-7344
mitchel.krause@othersideam.com
Please click here for all disclosures.

