
In This Article

“I said there’s storm clouds, they’re big storm clouds; now it’s a hurricane.” Jamie Dimon NY Financial Conference 6/6/2022
Let’s talk Tropical Storms …
Were you aware that a hurricane and cyclone are the same thing?!
Both are a “weather phenomenon” known as a Tropical Cyclone. Per NOAA (National Oceanic and Atmospheric Administration), a division of the U.S. Department of Commerce:
“A tropical cyclone is a generic term used by meteorologists to describe a rotating, organized system of clouds and thunderstorms that originates over tropical or subtropical waters and has closed, low-level circulation.”
Both wind speed and origin of where the storm formed is the determining factor as to whether these tropical cyclones are called depressions, tropical storms, hurricanes, typhoons, or tropical cyclones…
“In the North Atlantic, central North Pacific, and eastern North Pacific, the term hurricane is used. The same type of disturbance in the Northwest Pacific is called a typhoon. Meanwhile, in the South Pacific and Indian Ocean, the generic term tropical cyclone is used, regardless of the strength of the wind associated with the weather system.”
Sustained Winds < 39 mph → tropical depressions (and are the weakest of the tropical cyclones) winds > 39mph but < 74 mph → tropical storms and those storms with winds > 74mph → hurricane, typhoon, or tropical cyclone (based on origin of formation)
Ironically, as technologically savvy we are as a society, we still lack the understanding of the exact conditions necessary for these storms to form. At the same time, we know with high certainty that warm ocean water is a primary factor. More from NOAA:
“Warm water induces evaporation, causing more water vapor to rise from the ocean surface into the atmosphere. Hurricanes begin over the ocean as tropical storms triggered by a disturbance in the atmosphere.”
Hurricanes have the potential to cause a tremendous amount of damage.
In 2005, Hurricane Katrina dismantled the shores of Louisiana causing nearly $125 billion dollars in damage and nearly 1800 fatalities. Katrina was a Category 5 (or Cat 5) while over the ocean with wind speeds measuring in at 175 mph, weakening to a Cat 4 as it made land fall.
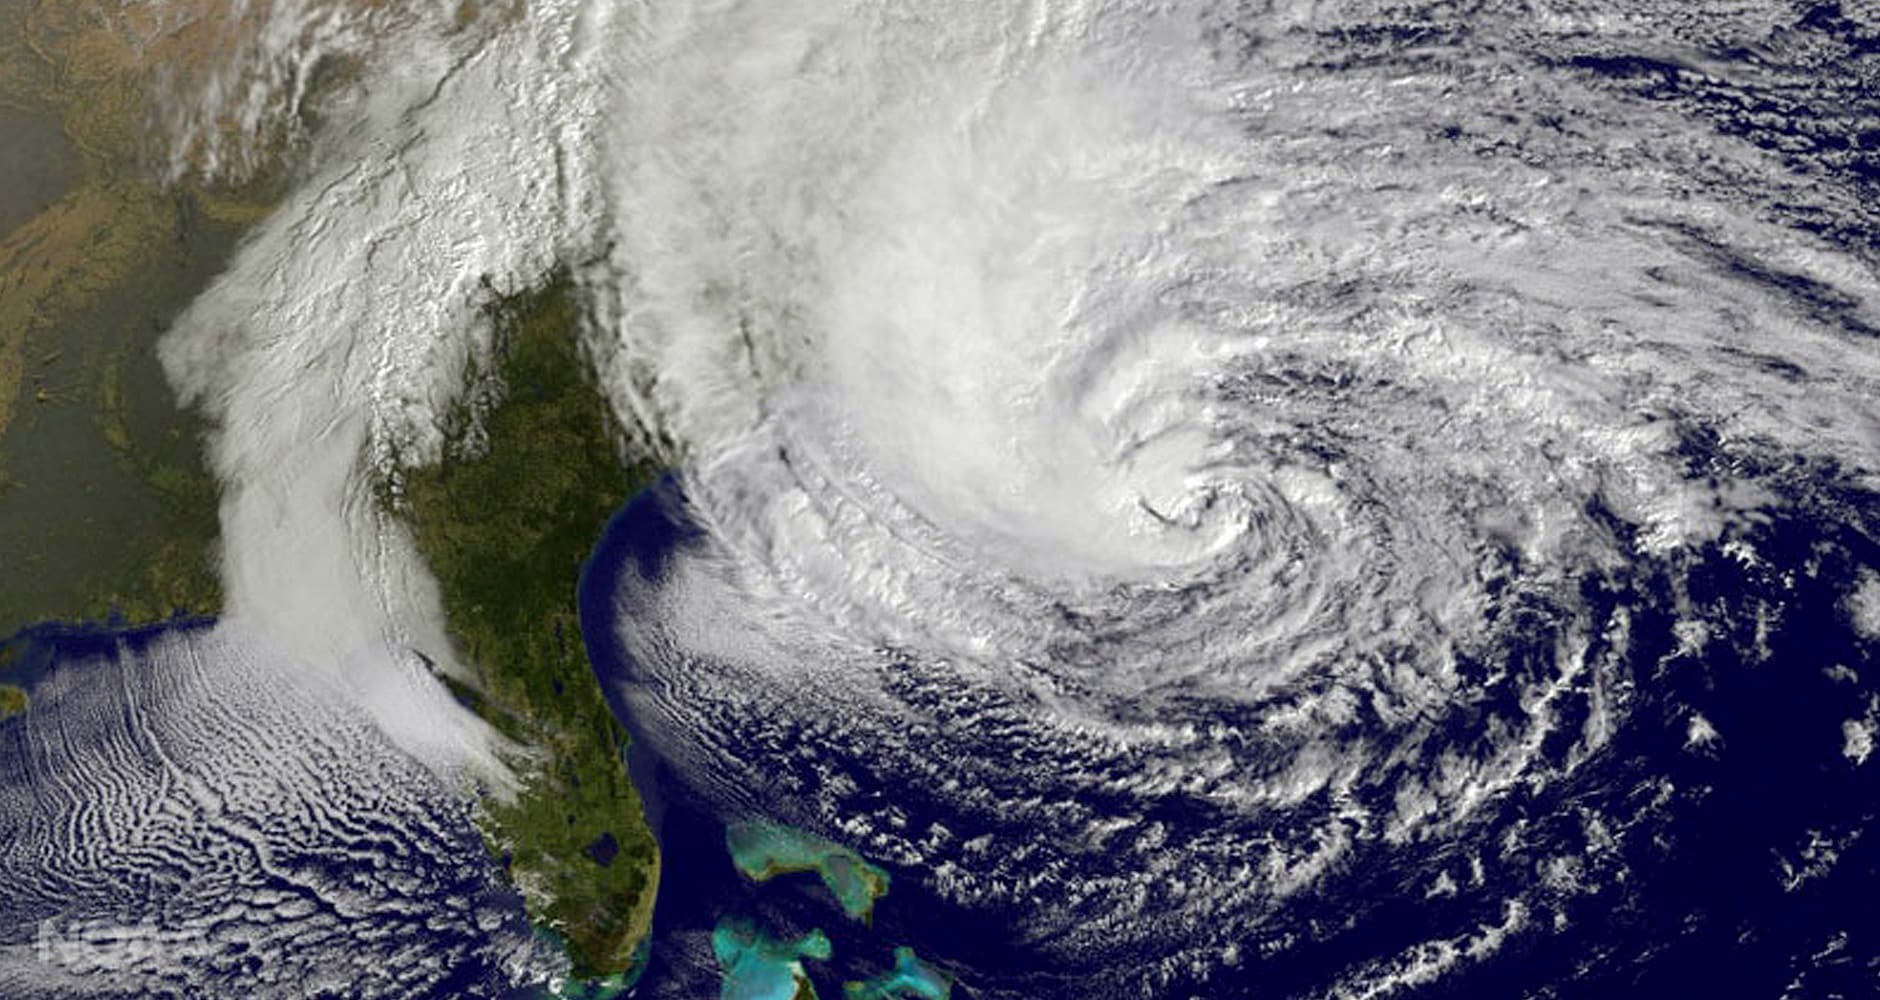
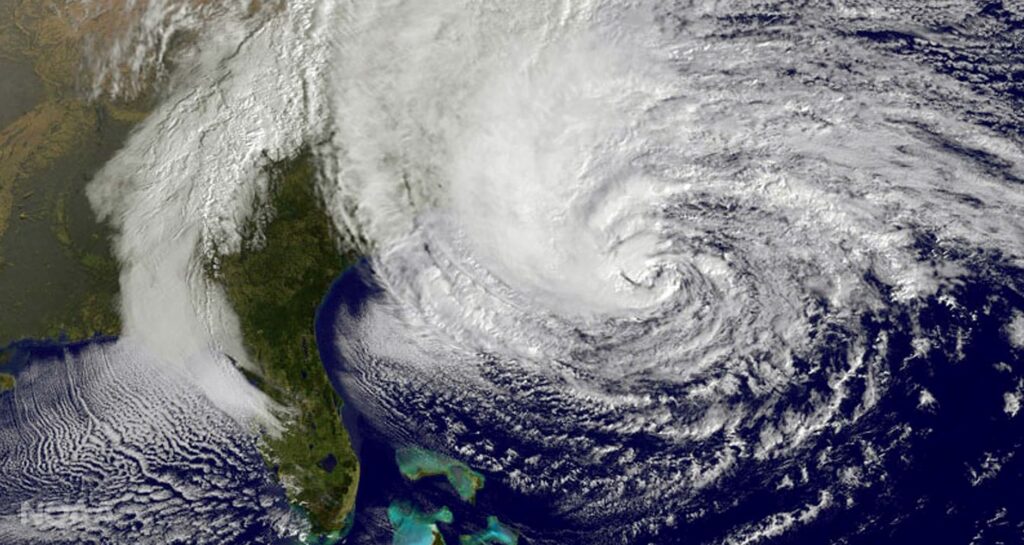
Hurricane Sandy ravaged the east coast in 2012 causing over $70 billion in damages and killing 233 people across 8 countries (from the Caribbean to Canada) as a Cat 2 storm with wind speeds peaking at 115 mph.
THE most damaging tropical cyclone on record, Hurricane Harvey, caused MORE than $125 billion in damages and killed over 100 as it made landfall across the Texas coastline in 2017.
To paint this analogy properly, I’d like to focus on the structure of these storms for a moment. Again, per NOAA, tropical cyclones are: “a rotating, organized system of clouds and thunderstorms.” At the center of each tropical cyclone is what scientists call the “eye” of the storm; the eye is surrounded by the “eyewall” which is subsequently wrapped with massive “rain bands”.
Warm, moist ocean air flows up through the eye is met with cooler air flowing down from the atmosphere, creating a very powerful counterclockwise rotating storm or cyclone (in the northern hemisphere; these storms rotate clockwise in the southern hemisphere). The eyewall is a massively concentrated band of thunderstorms featuring the heaviest, most damaging of winds; the rain bands which wrap the eyewall are vast in size, yet typically weaken the further from the eye you get. (Illustration below)
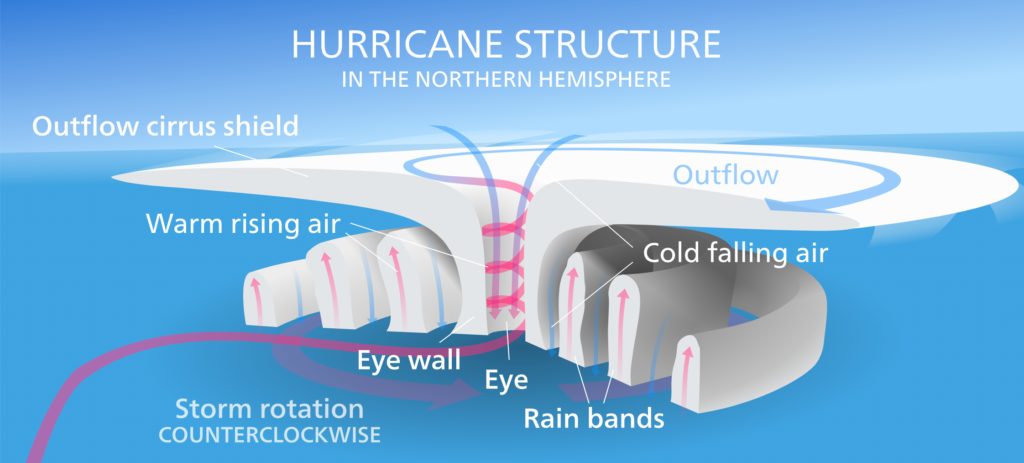
Amidst all the chaos, devastation, and destruction these storms leave in their wake, at the eye of each tropical cyclone is in fact, nothingness, often a calm light breeze, most frequently under blue skies. For as destructive as the eyewall is, the eye is the complete antithesis!
Generally, the eye of a hurricane ranges in size between 20 and 60 miles,
Katrina, for example, was nearly 400 miles wide, though at its core had an eye which measured approximately 30 miles in diameter. Sandy’s footprint was a staggering 900-mile width with a well-defined eye at its core approximately 21 miles wide.
Imagine being pounded by Katrina’s 150 mph winds only for the sun and blue skies to suddenly appear … what would you do?! Understanding what part of the storm you’re in at any specific time could be the difference between life or death (more on this later).
The Eye
Last month we called out Jamie Dimon on his masterful flip flopping, quoting this recent statement:
“I said there’s storm clouds, they’re big storm clouds; now it’s a hurricane … right now, it’s kind of sunny, things are doing fine … you know everyone thinks the Fed can handle this, (but) that hurricane is right out there down the road coming our way we just don’t know if it’s a minor one or Superstorm Sandy or Andrew or something like that; you better brace yourself.” Jamie Dimon NY Financial Conference 6/6/2022
While I don’t agree with Mr. Dimon on much, his hurricane analogy couldn’t have been more accurate, though, there is plenty within the statement we vehemently disagree with.
In the quote above, Dimon said, “right now, it’s kind of sunny, things are doing fine” …
Astute readers may note, Dimon made this statement in early June with markets down between 15-25% (depending on which major index you were looking at).
We personally don’t know anyone who would consider a 15-25% drawdown in equities, with high-yield spreads widening, credit default swaps breaking out, mortgage rates skyrocketing, corporate credit trading by appointment, with a recession looming, a “kind of sunny, things are doing fine” investing environment?! but who are we to question Jamie Dimon (insert eyeroll here).
Roughly 3 weeks ago, most investors opened their quarterly statements, to the economic reality of the S&P 500 having dropped 20.6% in the first half of 2022, with both the Russell 2000 and Nasdaq falling by more than 26% & 31% respectively. Even Wall Street’s “safe havens” that are treasury bonds in their highly touted 60/40 portfolios were down massively!
Anecdotally, I’ve spoken with many individuals (not our clients!!) whose accounts were down well in excess of 25%, OUCH!
Our clients were roughly flat…
Major equity indices had their ugliest first half performance numbers since 1970 at which time the U.S was entering a recession that would last until November of that year.
As Jamie Dimon discusses a “hurricane” coming “down the road”, we can’t help but argue, performance in virtually every sector of financial markets have just been pounded by the front end of an economic cycle hurricane.
“Kind of sunny” …Try again, Jamie!
CARNAGE, DESTRUCTION AND PAIN are a few words that immediately come to my mind, especially for those already retired, living on a fixed income, or drawing from their investment accounts as they get crushed by the 9.1% YoY inflation.
While we’ll acquiesce the most recent week and a half of market strength has provided some “sun” for the bulls who have immediately begun to peacock and strut. Ironically, given the circumstances, those with a bearish slant are (or should) still be playing with a solid lead while the perma-bulls are clinging on to any shred of light that might provide them with some semblance of dignity.
And this is where we circle back to the crux of our introductory analogy…
“Generally, the eye of a hurricane ranges in size between 20 and 60 miles, Katrina, for example, was nearly 400 miles wide, though at its core had an eye which measured approximately 30 miles in diameter. Sandy’s footprint was a staggering 900-mile width with a well-defined eye at its core approximately 21 miles wide.”
So, after getting pelted with copious amounts of water, from extremely heavy bands of rain including the more destructive eyewall, somewhere amongst the 400 or 900 miles of carnage Katrina and Sandy laid in their respective paths, 21 to 30 miles of area was experiencing a serine peace … for a brief period of time!
Bear market rallies exist. In March, we reminded readers of this offering some perspective in our piece titled “Sometimes, you’ve got to take a big step back … to see the full picture”:
“Last week markets “rallied”. For those who continue to find themselves emotionally affected by counter trend bounces let’s allow history to offer some perspective. We’d ask that you refer to the initial graphic above of the S&P 500; drawing your attention to two notable time frames (highlighted in purple and white): the first being 9/18/2008 – 9/19/2008 where the market rallied 11.61% from the intraday lows of the 18th to the intraday highs of the 19th; next is 10/28/2009 – 11/4/2008 when the market ripped 19.19% from the intraday lows of the 28th to the intraday highs of the 4th.
These brief “face ripping rallies” occurred WITHIN a 47% decline … Why?! because many investors get emotional … bear market rallies happen, and they’re violent; don’t get sucked in, don’t get whipped around … don’t get emotional! Remember, to take a deep breath and stick to the data and a process.”
Each piece we write has a very specific goal and lesson pertinent to the current investing environment. We work hard to lay these lessons out as clearly as possible. The titles alone should speak volumes (in our humble opinion).
We frequently talk about economic cycles needing “time and space” to work themselves out while additionally discussing patience as a core asset allocation. Most on Wall Street either don’t have patience, nor do they even understand what an economic cycle is (or why time and space is necessary).
Bear markets don’t end because indices have fallen by 20% or more, and they don’t end during deteriorating data.
Bear markets end when the collective of economic data, from a growth and/or inflation standpoint, begin to accelerate off their trough lows (and/or an intervention of epic proportions delays economic gravity).
Long time readers know we follow the data, and the data right now suggests neither of these scenarios are occurring at this moment in time. As we always suggest, don’t just take our word for it, what’s the data saying to you?!
Painted into a corner … by the data
Earlier this month we received a de minimis upside “surprise” from U.S Factory Orders for May coming in at up +1.6% MoM, with a slight upward revision to April’s MoM data, however, this “surprise” was met with the “New Orders” data from this month’s ISM manufacturing survey which dropped to contractionary levels (<50) coming in at +49.2, a level not seen since May of 2020.
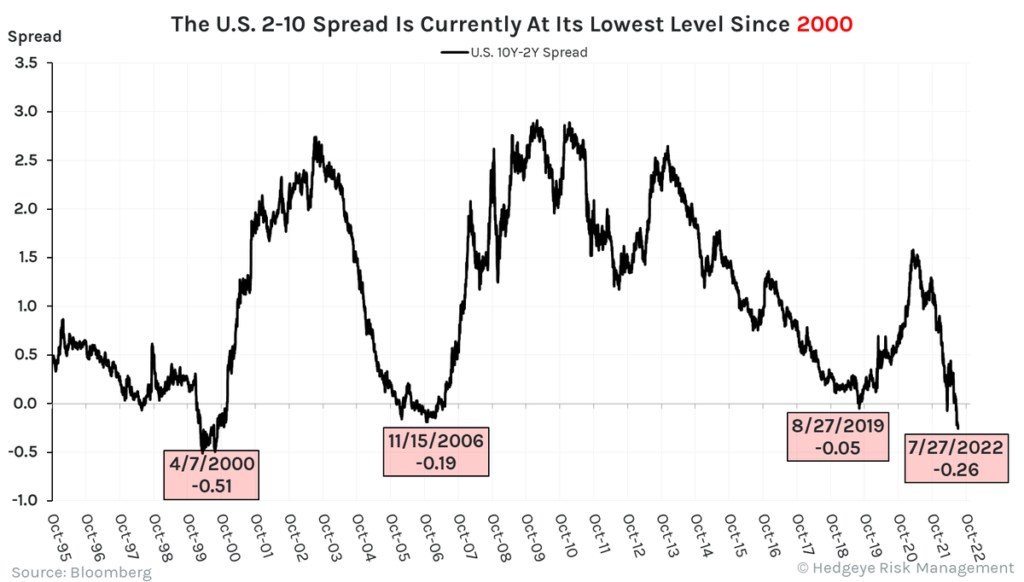
Earlier this year the 2s/10s spread inverted, though subsequently “normalized”. On July 5th, however, the 2s/10s spread was again flat, and today, no more than 3 weeks later, the curve is yet again inverted by -30 bps; meaning, investors are being paid more to invest in a 2-year treasury note than a 10-year treasury bond.
This is NOT the sign of a “healthy” market, it’s much more a sign of a “disturbance in the atmosphere”. The yield curve is telling investors that the Fed is pushing short term rates too high, as the longer end of the curve is telling the world growth is SLOWING at a precipitous pace.
In the last 25 years, we’ve only seen two similar inversions to speak of. The first was April of 2000 where the inversion hit -51bps. The second was November 2006 leading up to the GFC with an inversion of -19bps. Last I checked –30 bps falls between those two levels?! PLEASE NOTE INVERSIONS WITH TIME FRAMES BELOW … then tell me what subsequently followed in each scenario?! Per Hedgeye:
Ironically, in yet another story of narrative vs. data, many have emotionally begun to point to the recent BofA (Bank of America) survey of global fund managers which stated, “investors are showing dire levels of investor pessimism, with expectations for global growth at all-time lows, cash levels highest since 9/11, and equity allocations lowest since the collapse of Lehman”.
Daryl Jones (@HedgeyeDJ) of Hedgeye succinctly provided historical reference in regard to this specific talking point in a recent note to Macro Pro subscribers:
“While this does seem like a contrarian indicator, just be aware that:
- From the collapse of Lehman in September 2008, the SPY then bottomed some -42% lower in March 2009”
- From the end of September 2001, the SPY then bottomed some -31% lower in October 2002”
Anyone else noticing the two previous yield curve inversions of the last 25 years and BofA’s pessimism survey happen to coincide accurately with two of the worst outright collapses in equity prices of the modern era, or is it just me?!
Maybe… Just maybe… there is a reason for investors to be showing “dire levels of pessimism”?!
We continue to urge investors not to get emotionally sucked in to bear market rallies. There is a reason we recently wrote “sometimes, you’ve got to take a big step back … to see the full picture”
Small businesses have been foreshadowing this pain. We’ve been detailing the deterioration in the NFIB small business confidence data series for some time as it continues to plummet down to 89.50. This is now below pandemic levels.
The NFIB small business sentiment Forward Outlook is an even more telling indicator, as it measures the optimism (or lack thereof) of the small business owner looking forward by 6 months. This data series just hit ANOTHER NEW ALL-TIME LOW of -61, cratering -7 points BELOW last month’s new record all-time low of -54!
Small businesses have a difficult time navigating significant input cost changes. Large increases to raw materials, wage inflation, interest expense on debt, etc., all leads to margin compression and ultimately layoffs.
Earlier this month Non-farm payrolls came in slightly “better than expected”, though what’s more than noteworthy is the sequential WoW moves higher in U.S Weekly Jobless claims from +235 → +244 → +251. While these levels are still low, relatively speaking. The level is MUCH LESS IMPORTANT THAN THE DIRECTIONALITY, which is now moving in the wrong direction!
As is the case with all peaks and troughs, things slow, then they flatten, directionality changes slowly, and ultimately ALL AT ONCE.
For nearly 6 months we’ve detailed why “labor” is a late cycle economic indicator. Fed Chairman Powell cited the Beveridge curve and Jolts data, CEOs talked about a robust labor market! In May, we said:
“we’ve been screaming for the past 4 months (at minimum) LABOR is a LATE cycle indicator.
For months we’ve been screaming, as earnings shrink, margins will compress and it will lead to abrupt layoffs … which, again is what the data is already telling us with large companies such as $NFLX, $PTON, $CVNA and more importantly $AMZN (to name a mere few) having already announced layoffs, while tech monsters like $TWTR, $UBER & $FB recently initiated hiring freezes.”
Recently, even more companies have begun to back pedal at a precipitous pace. “Robust hiring” turned to “hiring freezes”, to “rescinding” of recent hiring offers and now outright layoffs (SEE: $F (Ford) laying off 8,000, $SHOP (Shopify) laying off 10% of their workforce, $TSLA (Tesla) now laying off employees, while Microsoft, Google and Apple (among many others) have just implemented hiring freezes.
$GM (General Motors) just saw “profits” tumble by 40% in the face of new car buying slowing dramatically. Again, margins compress, costs are then cut … costs = employees.
We’re nearing the point when the majority of CEO’s finally mea culpa and follow in Ford’s lead as the realization of record YoY earnings contraction hits 2023 budgets, ultimately leading to outright mass layoffs.
The inverted yield curve is telling you this. Small business sentiment has been telling you this. The economic cycle is telling you this.
The only ones who aren’t telling you this are the CEO’s incentivized to mislead, those complicit failed rodeo clowns we described last month and politicians either too ignorant/uneducated to know their agenda and policies that are destroying this country; or worse, they know what they are doing and it’s being done purposely?!
The contraction in growth has become brutally clear in the housing data as it continues to be an absolute train wreck!
June’s U.S. Existing Home Sales fell -5.4% MoM to 5.1mm units on a Seasonally Adjusted Annual Rate or (SAAR) this represents the fifth straight decline and lowest level since June 2020 (for context they have fallen from 6.5mm as recently as January 2022). Housing inventory continues to build +9.6% MoM to a +2.7 months’ supply on a seasonally adjusted rate, up from +2.4% in May (again, January 2022 being the inventory low of 1.8). It should surprise no one that MBA Mortgage Purchase Apps continue to fall off a cliff registering an anemic 222K on a monthly basis.
June U.S. Housing Starts AND Building Permits also decelerated from May to June, albeit nominally, with June “Starts” coming in at 1.559MM v. 1.591MM in May (-2.0% MoM) as June “Building Permits” came in at 1.685MM v. 1.695MM in May (-0.6% MoM). Both were down roughly -6.3% on a YoY basis.
If that’s not enough, July’s Builder Confidence report saw its second largest monthly decline EVER and lowest level since May 2020. Last time we checked… EVER is a long time.
Did someone say demand destruction?!
Meanwhile, Inflation
We won’t continue to belabor this point. We have been in a topping process, and we continue to be in the topping process. Markets know we’re dis-inflating which is a primary reason risk assets are down as much as they are over the first half of 2022. The vast majority of commodities that trade (excluding a very select few) is either significantly dis-inflating off cycle highs or outright deflating (and this now includes the last hold out in oil, which is down well in excess of 20% from its cycle peak … data per Koyfin as of 7/26/2022):

We’ve been screaming disinflation from the rooftops for nearly 6 months. It’s just now becoming visible to the failed rodeo clowns on CNBC or Wall Street talking heads. The only ones who don’t understand disinflation are linear econs, Federal Reserve officials and those who continue to say, but, but, but … CPI, or … when was the last time you went to the grocery store?!
We KNOW prices are high, but we also know they lag commodity prices and are the last to fall as raw commodity prices flow through the life/growing cycle, which you can see is happening from the chart above. Again, we’ve also attempted to painfully detail lead lags into CPI inputs here.
In the spirit of “topping is a process”, this 9.1% CPI print matters MUCH LESS in regard to where we are in the inflation cycle, but MUCH MORE for where the Federal Reserve is with their mindset on “policy” (which continues to lag and be wrong).
Again, markets have and continue to see inflation and growth SLOWING. The Fed, politicians and those unfamiliar with Rate of Change math and poor at macroeconomics simply see “9.1%” and a “benign” Labor report.
Given the Fed cares about “absolute levels” in data vs. directionality, cycles, and RoC (Rate of Change math), they’ll see 9.1% as something which needs to be attacked, while the delta in employment data will be seen as nominal collateral damage giving the Fed ZERO reason to stop hiking rates into this global economic slowdown.
And as anticipated, in our final edits the Federal Reserve Open Market Committee just increased the Federal Funds rate by another 75 bps, stating exactly what we thought they’d say:
“Recent indicators of spending and production have softened. Nonetheless, job gains have been robust in recent months, and the unemployment rate has remained low. Inflation remains elevated, reflecting supply and demand imbalances related to the pandemic, higher food and energy prices, and broader price pressures.”
To be clear, Powell also said:
- “We will be looking for compelling evidence that inflation is moving down consistent with inflation returning to 2%”
- “I said just now that restoring price stability is just something that we have to do, there isn’t an option to fail”
- “The first thing I would say to every household is that we know that inflation is too high we understand how painful it is particularly for people who are living paycheck to paycheck and spend most of that paycheck on necessities such as food and gas and heating their homes and clothing…”
- “Our mandate is for headline of course it’s not for core”
- “I said that another unusually large increase could be appropriate”
For anyone to have taken anything in this press conference to be “dovish” … headline inflation, which is their mandate (as he just stated), won’t be below high 7’s in September and won’t be close to the mid 6’s until Q1 based on how headline CPI is calculated (nowhere close to returning to 2%).
He told the, well over 50% of American’s living paycheck to paycheck that he’s working to restore price stability and failure is not an option. This is NOT dovish … the cycle is still in motion and the damage from the previous hikes are already flowing.
Continued hikes and accelerated measures of QT (Quantitative Tightening) into this probable global recession will be akin to a tropical storm being fed warm moist air off the ocean into a disturbance in the atmosphere … creating a storm of biblical proportion.
With this in mind, there is an eye to these storms.
We are keenly aware that the possibility exists for some of the economic data to incrementally improve on a year over year comp basis given the mild deceleration in 3Q2021 data due to the brief slowdown that came at the hands of the “Covid Delta Variant”. We discussed this dynamic at length in our 3Q2021 note; however, knowing this possibility looms, we’re hyper focused on risk managing around this dynamic, while also knowing the probabilities of a deflationary investing regime for both the 4Q2022 and 1Q2023 are high.
Again, take a step back, understand the full backdrop, and risk manage appropriately.
You keep saying Global?
We’ve mentioned the very real risk of a GLOBAL economic slowdown/recession. While we won’t report all of the data coming out of the Eurozone, consumer confidence out of the region rivals that of the U.S.
As recently noted by Hedgeye’s Josh Steiner… Eurozone Consumer confidence for July 2022 came in at a reading of negative -27, the LOWEST READING ON RECORD. For context, the low hit late February 2009 during the GFC was negative -22. The lowest level touched during the European sovereign debt crisis in November of 2012 was negative -21 and the previous all-time low during the onset of COVID in April 2020 was negative -24.
Hedgeye’s Daryl Jones (@HedgeyeDJ), just detailed Germany’s GFK Consumer Confidence data which literally just cratered to its lowest level EVER, while their propensity to buy hasn’t been this low since the GFC (Great Financial Crisis, October 2008).
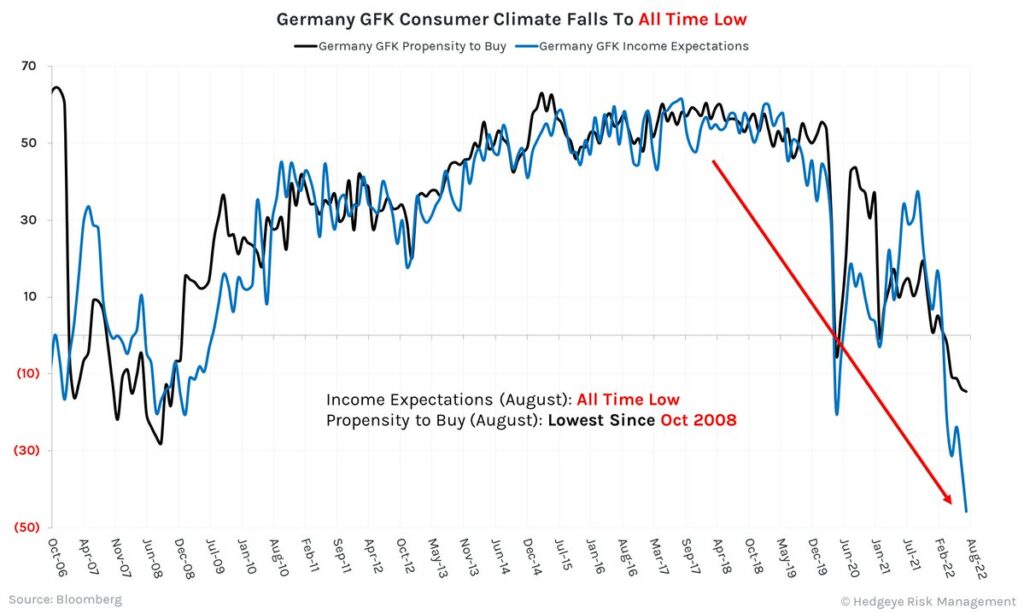
Again, LOWEST READING EVER, and ever is a long time!
Jeffrey Snider, Chief Strategist at Atlas Financial also recently noted the unprecedented curve inversion in Eurodollar markets…
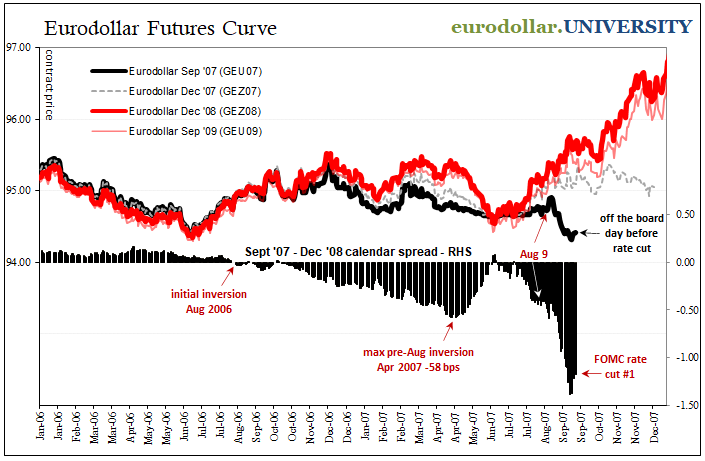
“Because the last time the curve was anywhere close it was just *weeks* before the first Fed panic rate cut in Sept ’07. Understand this meant it took the GFC to have begun to get the curve as inverted as it is right now!!”
Providing the data to outline a global recession (ex-China) would more than double the size of this note, at the same time, it exists making one high probable. The more trading partners that enter recession will simply deepen our own … for it won’t just be the U.S. consumer pulling back on their spending.
As if we haven’t cited enough data, the irony is we’ve barely scratched the surface of the elephant in the room which is the earnings recession unfolding right before our very eyes. If you’re buying into this “better than expected” absurdity, focused solely on your screens when they’re green, you’re missing the massive deceleration in data; from bellwether companies like $MSFT, $WMT, $GOOGL, $JPM, $SHOP, $SNAP to the smaller businesses reporting massively negative YoY data squeezing margins.
Anyone who’s run a company understands you can’t run a business with the same cost and spending structure in place when you’re working with 40% less revenue … something has to get cut and it’s usually people!
Noted earlier, corporate budgets getting cut now will adversely affect the back half of the year and front half of NEXT year … cycles take time!
Given all the above, we would anticipate continued choppiness followed by another significant increase in volatility into the back half of the year. As always, we’ll stick with our #process and #discipline.
A brief reminder re: “noise”
At this moment in time, it’s important to remember there was an extremely small minority (that we have been a large part of) leading the way warning “inflation” as experts said, “nothing to see here”. It was us who yelled inflation would be “persistently high” as the masses came around to “we see some inflation, but it will be transitory”. We then told you both growth and inflation were in a “topping process” as the masses finally capitulated to “inflation is a BIG problem, and we need to do something about it” as we pivoted to a deflation/disinflationary stance. Recently, Wall Street and its cheerleaders continue their calls for 75-100 bps hikes as the Fed does so gladly, with politicians screaming “you’re not doing enough”. (SEE: failed rodeo clowns like Jim Cramer)
We’ve been warning about 2Q2022 deflation/disinflation since September 2021
We concluded our November 2021 note by saying:
“The bottom line — today is NOT a day to position for Deflation, but that day isn’t far off … 3 months will pass by in a blink, and you better know where to go if and when the signals confirm deflation!”
In December 2021 we titled our piece, “It’s about that time, don’t get caught off guard, again…” and wrote:
“Remember, markets tend to front-run economic reality. So, we should not be surprised to see a correction begin in the weeks leading up to 2Q2022. But how many weeks in advance? We don’t know; nobody knows; all that we know is that “things happen slowly, then all at once”. So, we will continue to use strategies to preserve capital against a highly probable correction.”
History tells us the economic cycle peaked in mid-November with the Russell 2000 reaching its all-time high on November 8, 2021, and the Nasdaq on November 22, 2021; with the S&P following a handful of weeks later on January 5th.
And recently in May we wrote…
“Again, topping is a process … the used car data will continue to decelerate, but at a less rapid pace. At the same time, the deceleration in other material inputs on lags such as agricultural products like corn and wheat, industrial metals like copper and housing, coupled with more difficult YoY comps (base affects) will start to kick in making the disinflation to deflation more visible over the next quarter or two.”
Given the current prices in raw commodities, the disinflation should be obvious to you now!
We’re by NO MEANS perfect. At the same time, it’s difficult to be more accurate than we’ve been, while proactively preparing our accounts for this current economic cycle.
We did exactly as we said we would. We followed the data, anticipated the early pull forward by markets, we understood where to go and as such, we’ve significantly preserved capital all the while ignoring nearly all of Wall Street saying to do the exact opposite.
This business is a humbling business. We don’t write the above to brag or boast. last WEEK was one of the more challenging weeks of the year for us. Markets moved through the top ends of their risk ranges four straight days with volatility being pushed through the low ends of their respective risk ranges. We executed to our plan and would do so again given the same circumstance. The moves we made last week in the face of adversity are so far working out nicely.
In 2019 we wrote Odd’s over Outcomes on this very topic; we cited World Champion poker player Annie Duke and her book “Thinking in Bets; Making Smarter Decisions When You Don’t Have All the Facts” (a great resource and we highly recommend the read). With this in mind, a quick revisit to something we wrote in 2019:
“it’s important to remember that there is always a chance of the minority percentage of any specific outcome occurring, it’s called the minority outcome for a reason; they occur less frequently; how much less frequently depends on the percentages – our odds… If the weatherman’s computer models called for rain with an 85% probability, we are much more likely to grab our umbrellas then if s/he called for a 15% chance of rain; 85% is a much higher probability then 15%
We titled a section, “Cloudy with a chance of Meatballs” in our 4Q2017 note (an homage to the children’s film after having watched it with my daughters). In that section we said:
“If the weather report suggests a 20% chance of rain tomorrow, how many people would carry their umbrella? Be truthful – the answer is virtually no one. Human behavior suggests most people either round large probabilities up to 100% likewise, they round small probabilities down to 0%; but if it actually rained, most people would more than likely be upset with the weatherman…”
So, I’m going to ask again: If you knew the odds of any specific outcome was 85% in one direction or another, what would you do??? In most cases – the vast majority, you would use the odds to your favor!”
Markets don’t always move exactly as the probabilities suggest they should, but if you play the highest probable outcome consistently, we “should” perform better than most over the course of time! It rains much less frequently when there is a 15% chance of rain than it does when the odds are 85%.
This is why we turn off the “NOISE” and remain true to our process and discipline.
We approach each day, following the data while simultaneously embracing uncertainty. Though, it never ceases to amaze us why investors place so much credence in those who are consistently WRONG?!
For example:
“I take that (yield curve inversions) very seriously as a signal and it has been accurate in the past, but I do think this time is different.” St. Louis Federal Reserve Chief, James Bullard July 19th as reported by @WSJ
How anyone can take a member of the Federal Reserve seriously when they say something like this is beyond us?! Our initial thought would be confirmation bias … for those positioned incorrectly, need “this time to be different”. Unfortunately (for them), the curve’s inversion is the product of a much larger problem! Nothing Jim Bullard opines on will change the economic cycle. For us, this statement is simply “noise”.
As discussed earlier, the Fed hiking rates into this global economic slowdown is pushing the short end of the curve higher (artificially), while the long end of the curve (which is more freely traded) is screaming growth is getting pummeled. It’s the economic cycle, and both the data and previous outcomes given similar conditions couldn’t be clearer.
While we’re on the topic of “noise” from those who have been consistently wrong … with 2Q2022 GDP set to be reported on July 28th, ironically, the White House has literally just written a piece telling you why a recession, by definition … is no longer, well … a recession?! (no folks, you can’t make it up) per the White House blog:
Determine Whether the Economy Is in a Recession?
JULY 21, 2022
What is a recession? While some maintain that two consecutive quarters of falling real GDP constitute a recession, that is neither the official definition nor the way economists evaluate the state of the business cycle. Instead, both official determinations of recessions and economists’ assessment of economic activity are based on a holistic look at the data—including the labor market, consumer and business spending, industrial production, and incomes. Based on these data, it is unlikely that the decline in GDP in the first quarter of this year—even if followed by another GDP decline in the second quarter—indicates a recession.
Ahhh, when truths become inconvenient … change the definition (palm meet forehead), but I digress!
Final thoughts
We write these notes for multiple reasons, though typically the tenor or tone focuses on the data to cull the “noise”, which is abundant in today’s investing landscape. Whether it be the swath of market indicators like High Yield OAS trending higher, the yield curve inversion widening, the strength of the U.S. dollar, many commodities literally crashing OR the economic data from a growth and inflation perspective decelerating at an expeditious rate, all signs point to a massive hurricane…
Should the movement in the price of equities adversely affect your account for a few weeks, try to keep in mind there is always an eye of the storm somewhere within a tropical cyclone. There is some form of calm amongst a sea of chaos. In the case of investing, consider it a trade within a MUCH larger trend. And while we won’t get every cycle within a cycle right, in sticking to our discipline and process, we significantly shift the odds into our favor.
A friend of mine pointed me to a recent article from Boca Magazine’s July/August issue discussing the Miami Storm of September 18, 1926, which ties the crux of this piece together perfectly:
“By midnight, the storm was roaring through downtown Miami with wind speeds believed to top 150 miles an hour. Weather historians have said they believe that if a storm today followed the path of the 1926 hurricane, the damage, in dollars, would be at least three times that of 1992’s catastrophic Hurricane Andrew.
At dawn, residents ran out in the calm believing the storm had passed. But it was just the eye. The second half would be worse. Many were trapped. Just in Miami, the storm killed 113 people and, for now, the city’s dreams of glory.”
The first sign of “blues skies” or slightly less volatile markets doesn’t mean you completely flip your book to position for the “all clear”, and you don’t just blindly run outside when blue skies appear in the middle of a Hurricane.
It’s imperative you recognize where you are in the midst of the storm, and the data is suggesting we’re in the eye.
Recall, Hurricane Sandy was a 900-mile-wide storm with a 21-mile-wide eye. The area of a circle is pi x radius squared (A = π r2), making the area of the eye 345 sq miles, while the area of the storm was 635,000 sq miles … the eye was 5 bps or .05% of the total storm.
Clear skies don’t last for very long when you’re in the middle of a Hurricane!
Risk management doesn’t mean “never lose money” or “never be down”, risk management means making the highest probability decision at the time based on the data, price, volume, volatility, and the overall economic investing environment (or @Hedgeye #QUAD). The Quad 4 hurricane is still upon us and that’s what we’ll continue to navigate around.
Good Investing,
Mitchel C. Krause
Managing Principal & CCO
Please click here for all disclosures.

